Key Performance Indexes (KPI) Plugin
The KPI plugin periodically collects telemetry metrics and topology data from one or multiple UFM Telemetry and UFM clusters to calculate high-level Key Performance Indicators (KPIs). It can operate as a standalone Docker container or as a UFM plugin.
The calculated KPIs and collected telemetry metrics are stored in a Prometheus time-series database using the remote-write Prometheus protocol.
NICs Connectivity
Name:
connected_endpointsDescription: This KPI shows the percentage of NICs connectivity, namely, from all NICs available, how many are connected. The desired value is 100%, meaning all NICs are connected.
The default threshold for "bad" values is ≤ 95%.
NoteThe complete list of NICs includes all those detected at least once since the plugin is started.
Topology Correctness
Name:
topology_correctnessDescription: This KPI reports the number of wrongly connected links. The ability to spread traffic over multiple minimal-distance paths is critical in utilizing the bandwidth provided by the network.
Therefore, a pass/fail criteria for the topology not being broken by miss-connections is key for the network to provide reasonable bandwidth to running applications. The threshold for failure is > 0.
Link Stability
Name:
stabilityDescription: For each UID (Unique Identifier), the KPI checks for changes in the link down counter. A change may indicate a link recovery, suggesting there was a period with no link. The statistics are tracked per UID, and the ideal value for link down errors is 0, indicating no problematic links.
Overheated Components
Name:
operating_conditionsDescription: This KPI displays the total number of elements (ports and devices) experiencing operating condition violations. Each hardware element has a predefined normal operating temperature range, with a common default threshold set at 70°C (158°F) or higher.
Bandwidth Loss due to Congestion
Name:
bw_loss_by_congestionDescription: An Infiniband (IB) network is lossless and can therefore experience loss congestion spread. Features like congestion control aim to minimize this issue. This KPI reports the percentage of bandwidth loss due to congestion for each layer and direction, as measured by the
port-xmit-waitcounter.The reported percentage is calculated by averaging the
xmit-waitequivalent time with the time between samples across all links in the specified layer-direction group.
Fat Tree (Single Root) to Tree Conversion
Name:
tree_over_subscriptionDescription: Fat Trees were constructed by Leiserson in order to enable building a tree structure using fixed radix K and capacity switches T. Consider a regular K-1 tree (each switch has one parent and K-1 children), which have a single root switch service and after H-1 levels (K-1)^(H-1) leaf switches connecting (K-1)^H hosts each with bandwidth B. Consider the worst case traffic pattern where each leaf switch send traffic to other leaf switches that must cross the top. The connection from each leaf switch up should carry B(K-1) traffic and the capacity of that switch is bi-directional B(K-1) too. One level up the capacity and up link capacity required is B(K-1)^2, etc. But that requires exponentially growing capacity from links and switches.
For example, the below diagram is of a three level fat tree:
The Single Root Tree:
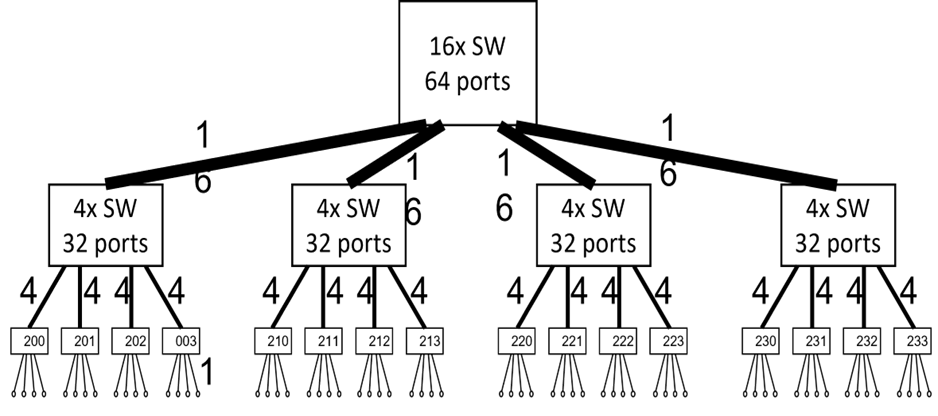
The solution to that problem was to split each single switch in the original Single Root Tree (SRT) into Multi Rooted Tree - which is a Fat Tree. In each level there are exactly same number of switches connected up and down except for the top level which carry half the number of switches - connecting only down.
The Fat Tree formulations define which switches connect to which other switches but it does not break the basic concept that a Fat Tree can be collapsed back into a simple tree by merging switches into much larger ones. A pair of leaf switches can still be classified by their distance - or the level of their common parents - just like in the original SRT.
When we want to evaluate the damage to the perfect tree structure due to link faults, it is very hard to get an exact maximum flow bandwidth without lengthy N^2 complex algorithm. However, if we examine the SRT obtained by collapsing the Fat Tree back into a tree, we can get a upper bound to the available bandwidth between different branches of the SRT.
This metric evaluates Fat Tree clusters topology and extracts their original Tree structure. Then it evaluates the over-subscription of each sub-tree. This way, the impact of the exact set of missing links can be evaluated in terms of the bandwidth taken out between sub-tress of the topology.
Top-of-rack (ToR) to ToR Max Flow (Bandwidth) Matrix
Name:
tor_to_tor_bwDescription: This KPI provides a simple metric for the impact of link failures. One such network property is the available bandwidth for pairs of ToRs. This provides a meaningful yet traffic independent metric. So no prior knowledge of the exact set of instantaneous traffic patterns is required.
It is most important to look at the TOR up-ports since on Fat Trees the number of possible paths rows exponentially when going up the topology towards the roots. So the impact of link faults is decaying exponentially with their level towards the roots.
It would have been nice if we could just count the number of missing up links on each of the TORs in the pair and claim that TOR X lost x uplinks and TOR Y lost y uplinks, the lost bandwidth is linkBW*min(x,y). But in reality the worst case lost bandwidth is linkBW*(x+y). This is an artifact of the specific links lost and the network structure.
The code we provide performs a Fat Tree specific computation of the exact available bandwidth for each TOR's pair.
The algorithm provides unique identifiers for sub-trees and consider the subtree each link of the TORs connect to. Then it sums the min number of links connected from each of the TORs to each of the subtrees.
A more straight forward approach utilizing networkx or direct implementation of Dinic's max-flow algorithm yielded much higher runtime, yielding this metric impractical to use.
We use an example to demonstrate these concepts:
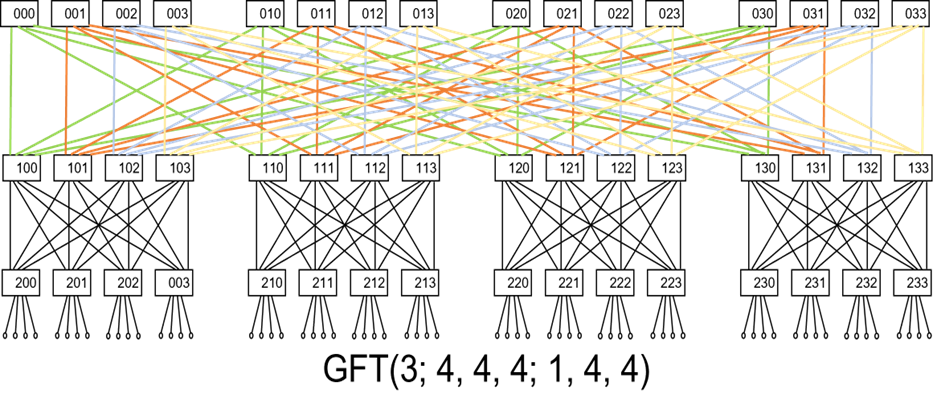
Consider the Fat Tree GFT(3;4,4,4;1,4,4) depicted in the diagram below:

We re-arrange the top row of switches (cores) such that the full-bipartites between switch levels 2 and 3 are close together:
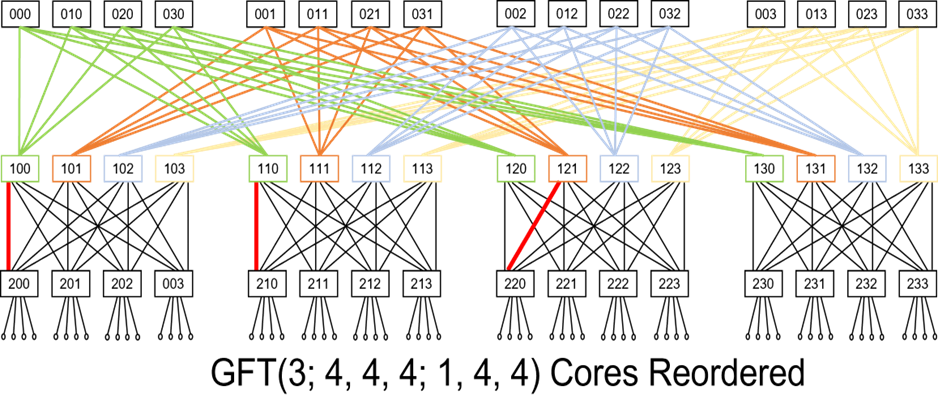
The re-ordered picture highlights that if we imagine the red links as missing links, then:
TORs 200 and 210 missing links are connected to the same bipartite and thus they only lose 1 out of the 4 paths between them.
However, TORs 200 and 220, missing links connect to 2 different L2-L3 bipartites and thus 2 different paths out of the 4 possible are lost.
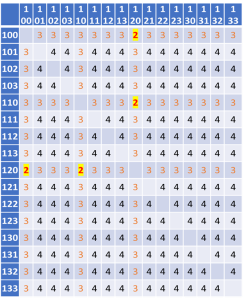
The resulting TOR to TOR max-flow matrix, providing the maximal bandwidth between each pair, in units of single link bandwidth is provided below:
The Algorithm
The following steps are conducted in order to provide that table:
DFS from top to bottom collecting the list of parents for each switch. We require all TORs be accessed so we try all top level switches until we find one that is connected to all TORs. After we are done we can ask for every TORs pair what is the level of the lowest common parent. This is required since routing will only use shortest paths, and thus go up to that level only.
Establish for each TOR and up the unique bottom-up subtree it is part of. The same sub-tree number should be used for all parents of each switch that are on the same level. Since the topology may be missing some links, it is not simple to check if there was previous allocation of such number, so first all parents are scanned, and then a consolidation step decides which levels are missing a number. If any needs to be set then another step applies the consolidated value.
For TOR switch, we sum the total number of links that connect to switches with same bottom-up tree (recognized by their assigned number). We do that for every parent level.
Now that we have that data for every TOR, we compute the TOR to TOR max-flow by first looking up the level of their common parent and then computing the the minimal number of flows they connect to each bottom-up tree they connect to.
The plugin could be deployed as a standalone application or as a UFM plugin.
Deploy the KPI as a UFM plugin
Pull/load the latest image of the plugin:
docker pull mellanox/ufm-plugin-kpi
Pull/load the latest image of the plugin:
/opt/ufm/scripts/manage_ufm_plugins.sh add -p kpi -t <TAG>
Deploy the KPI as a Standalone application
Pull/load the latest image of the plugin:
docker pull mellanox/ufm-plugin-kpi
Pull/load the latest image of the plugin:
docker run --network host -v /opt/ufm/files/conf/plugins/kpi:/config -v /opt/ufm/files/logs/plugins/kpi:/logs --rm -dit $IMAGE
The configurations can be managed through a configuration file.
Within the container, the configurations file can be found under
/config/kpi_plugin.confOn the host, the shared volume location of the /config is
/opt/ufm/files/conf/plugins/kpi/kpi_plugin.conf
Clusters Configurations
The default KPI configurations KPI include one default cluster called `unknown`, once the plugin starts, the default cluster is configured to collect the secondary telemetry endpoint http://localhost:9002/csv/metrics and the local UFM topology data.
To change the parameters of the default cluster, or to add additional clusters, please refer to the following configuration under the kpi_plugin.conf:
            ### Set name to "cluster-config-$cluster_name". Add section per each cluster
[cluster-config-unknown]

### uncomment and set 2 following options:
#host_list = host_name[1-1024],another_host_name[1-100]
### threshold to distinguish between hosts and switches (inclusive)
#host_max_ports = 4

### OR

### If hostlist format is not possible, another option is per-level regular expressions
### That is a list of regular expressions to detect nodes level in topology (0 is lowest - hosts)
### Key structure is 'level.<level number>.<per-level running index>'
#level.0.0=some-host-pattern-\d+
#level.0.1=another-host-pattern-\d+
#level.1.0=leaf-pattern-l\d+
#level.2.0=spine-pattern-s\d+
#level.3.0=core-pattern-c\d+


### If running as standalone app please uncomment and set next 3 lines
#ufm_ip=0.0.0.0
#ufm_access_token=1234567890abcdefghijklmnopqrst
#telemetry_url=http://0.0.0.0:9100


### If running as UFM plugin and UFM port has changed
#ufm_port=1234
|
Property |
Description |
Default Value |
|
|
Set of hosts in hostlist format. Used to detect the topology leafs. |
None |
|
|
The maximal number of ports in a server. Used as threshold to classify a node as server / switch. |
4 |
|
|
Regular Expression to capture topology levels. The first index (X) is the level and the following index (Y) is a running index for level X |
None |
|
|
UFM IP that used to collect the topology data |
'127.0.0.1' |
|
|
UFM port that used to collect the topology data in case the cluster is local |
'8000' |
|
|
The UFM access token that should be provided in case the cluster is collecting data from a remote UFM |
None |
|
|
UFM telemetry endpoint URL that used to collect the telemetry metrics. |
|
|
|
If True, only changed telemetry metrics are pushed to Prometheus after each pulling interval, with a fallback to push unchanged metrics if they remain static for over an hour. Otherwise, all fetched metrics will be pushed to the Prometheus after each pulling interval |
True |
KPI Configurations
The configurations are related to the KPI plugin itself. please refer to the below configuration section in order to manage the KPI generic configurations:
            [kpi-config]
### Optional Comma separated list that contains list of the disabled KPIs that we don't want to store them in Prometheus DB
### Available KPIs:
### connected_endpoints,topology_correctness,stability,operating_conditions,bw_loss_by_congestion,tree_over_subscription,tor_to_tor_bw,general,telemetry_metrics
disabled_kpis=telemetry_metrics
|
Property |
Description |
Default Value |
|
|
Optional Comma-separated list that contains the list of the disabled KPIs that we don't want to store in Prometheus DB. The available KPIs are: connected_endpoints,topology_correctness,stability,operating_conditions,bw_loss_by_congestion,tree_over_subscription,tor_to_tor_bw,general,telemetry_metrics |
telemetry_metrics |
Prometheus Configurations
The plugin includes a local Prometheus server instance that is used by default, the following parameters are used to manage the Prometheus configurations:
            [prometheus-config]
prometheus_ip=0.0.0.0
prometheus_port=9090
prometheus_db_data_retention_size=120GB
prometheus_db_data_retention_time=15d
|
Property |
Description |
Default Value |
|
|
IP of Prometheus server |
0.0.0.0 |
|
|
Port of Prometheus server |
9090 |
|
|
Data retention policy by size (used only for the local Prometheus server) |
120GB |
|
|
Data retention policy by time (used only for the local Prometheus server) |
15d |
The data storage path of the local Prometheus DB is under /opt/ufm/files/conf/plugins/kpi/prometheus_data.
Global Time Interval Configurations
The following is used by all clusters globally, each property could be overridden by adding it under the cluster’s section.
            [time-interval-config]
telemetry_interval=300
ufm_interval=60
|
Property |
Description |
Default Value |
|
|
Polling interval for the telemetry metrics data in seconds |
300 |
|
|
Polling interval for the UFM APIs in seconds |
60 |
|
|
Polling interval for the connected_endpoints KPI specifically |
60 |
Logs Configurations
The below configurations are to manage the kpi_plugin.log file
            [logs-config]
logs_level = INFO
logs_file_name = /log/kpi_plugin.log
log_file_max_size = 10485760
log_file_backup_count = 5
Grafana Dashboard Templates
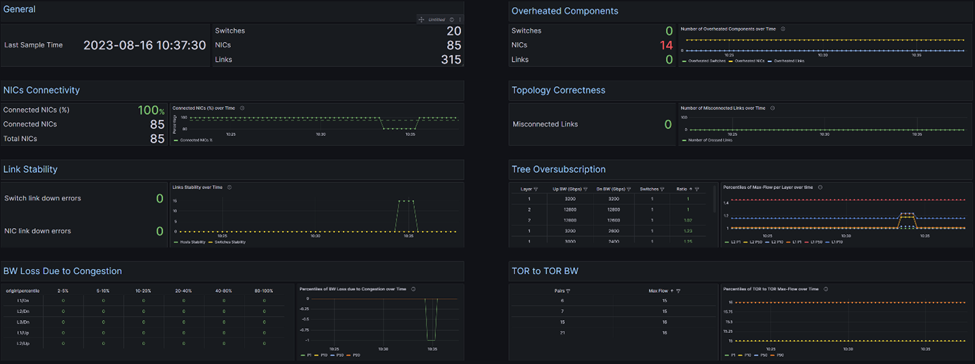
The KPI plugin provides several Grafana dashboard templates that the Grafana users can import, these dashboards display the KPIs panels and graphs. The main dashboard is a cluster view that shows the cluster’s KPIs. The dashboard should be connected to the KPI Prometheus server.
The dashboard JSON template can be found under /opt/ufm/files/conf/plugins/kpi/grafana/:
The following logs are exposed under /opt/ufm/files/logs/plugins/kpi/ in case of UFM plugin mode, and under /log inside the container in case of Standalone mode.
kpi_plugin.log- The application logs.kpi_plugin_stderr/stdout- The application service logsprometheus.log- The local Prometheus logs.
Get List of Configured Clusters
URL:
UFM Plugin: https://<IP>/ufmRest/plugin/kpi/api/cluster/__names__
Standalone: http://<IP>:8686/api/cluster/__names__
Method: GET
Response: List of cluster names strings
Get KPIs Information
URL:
UFM Plugin: https://<IP>/ufmRest/plugin/kpi/files/kpi_info
Standalone: http://<IP>:8686/files/kpi_info
Method: GET
Response: List of KPI names and HTML descriptions.
Get KPIs Values
URL:
UFM Plugin: https://<IP>/ufmRest/plugin/kpi/api/cluster/<cluster_name>
Standalone: http://<IP>:8686/api/cluster/<cluster_name>
Method: GET
Response: A list of KPIs with the relative calculates graph values to be used in the UI. Generally, 2 main components are expected: the table data (key “2d_matrix_data”) and the graph data (key “graph_data”). Each value corresponds to rules expected by the UI:
display name– KPI display name2d_matrix_data– Latest data in a table-like format. Every list item is a dict that makes a table row - corresponding to the columns of that row.data– List of dict, each dict is a column in the row. May contain:percentage– Value in percentage.value– Raw value.name– Column header
direction– For arrows icon (up / down)name– Row header
graph_data– dictionary with the following items:multi_line_graph– time series graph for one or more series.title– Graph title.x_label– X axis label.x_values– X axis values.y_labels– Y axis labels.y_values– Y axis values.
info– string with information of the graph data.
Get KPI Plugin Overview
URL:
UFM Plugin: https://<IP>/ufmRest/plugin/kpi/overview?time_window=<value> (in hours)
Standalone: http://<IP>:8686/overview?time_window=<value> (in hours)
Method: GET
Response:
            {
    "clusters_telemetry_info": [
        {
            "cluster_name": "unknown",
            "interval": 60,
            "url": "http://pjazz:9002/csv/metrics"
        }
    ],
    "prometheus_info": {
        "db_statistics": {
            "appended_samples_rate_per_sec": 11.46,
            "bytes_rate_per_sample": 9.227,
            "total_compressed_blocks_size_bytes": 272329313.0,
            "total_head_chunks_size_bytes": 1937238.0,
            "total_wal_size_bytes": 2989807.0
        },
        "url": "http://pjazz:9191"
    }
}
Where:
clusters_telemetry_info: contains a list of the configured clusters' information, each cluster has the following properties:
|
Property |
Description |
Default Value |
|
|
Cluster’s name |
One cluster with name ‘unknown’ |
|
|
Cluster’s telemetry pulling time interval |
60 |
|
|
The cluster’s URL telemetry |
prometheus_info: Contains the general Prometheus configurations (e.g. the URL) and statistics about the collected samples (for the local Prometheus mode)
|
Property |
Description |
|
|
Prometheus rate of the total appended samples per second, calculated by the following Prometheus expression: rate(prometheus_tsdb_head_samples_appended_total[{rate_window_time}h]) |
|
|
Prometheus rate of ingested bytes per sample, calculated by the following Prometheus expression: rate(prometheus_tsdb_compaction_chunk_size_bytes_sum[{rate_window_time}h]) / rate(prometheus_tsdb_compaction_chunk_samples_sum[{rate_window_time}h]) |
|
|
Total compressed blocks size in bytes that the Prometheus was stored, calculating by the following Prometheus expression: prometheus_tsdb_storage_blocks_bytes |
|
|
Total HEAD chunks blocks size in bytes that the Prometheus was stored, calculating by the following Prometheus expression: prometheus_tsdb_head_chunks_storage_size_bytes |
|
|
Total WAL size bytes, calculating by the following Prometheus expression: prometheus_tsdb_wal_storage_size_bytes |
|
|
The promethues’s URL telemetry |

