1. Customization Guide
Nsight Compute Customization Guide.
User manual on customizing NVIDIA Nsight Compute tools or integrating them with custom workflows. Information on writing section files, rules for automatic result analysis and scripting access to report files.
1.1. Introduction
The goal of NVIDIA Nsight Compute is to design a profiling tool that can be easily extended and customized by expert users. While we provide useful defaults, this allows adapting the reports to a specific use case or to design new ways to investigate collected data. All the following is data driven and does not require the tools to be recompiled.
While working with section files or rules files it is recommended to open the Metric Selection tool window from the Profile menu item. This tool window lists all sections and rules that were loaded. Rules are grouped as children of their associated section or grouped in the [Independent Rules] entry. For files that failed to load, the table shows the error message. Use the Reload button to reload rule files from disk.
1.2. Metric Sections
The Details page consists of sections that focus on a specific part of the kernel analysis each. Every section is defined by a corresponding section file that specifies the data to be collected as well as the visualization used in the UI or CLI output for this data. Simply modify a deployed section file to add or modify what is collected.
1.2.1. Section Files
The section files delivered with the tool are stored in the sections sub-folder of the NVIDIA Nsight Compute install directory. Each section is defined in a separate file with the .section file extension. At runtime, the installed stock sections (and rules) are deployed to a user-writable directory. This can be disabled with an environment variable. Section files from the deployment directory are loaded automatically at the time the UI connects to a target application or the command line profiler is launched. This way, any changes to section files become immediately available in the next profile run.
A section file is a text representation of a Google Protocol Buffer message. The full definition of all available fields of a section message is given in Section Definition. In short, each section consists of a unique Identifier (no spaces allowed), a Display Name, an optional Order value (for sorting the sections in the Details page), an optional Description providing guidance to the user, an optional header table, an optional list of metrics to be collected but not displayed, optional bodies with additional UI elements, and other elements. See ProfilerSection.proto for the exact list of available elements. A small example of a very simple section is:
Identifier: "SampleSection"
DisplayName: "Sample Section"
Description: "This sample section shows information on active warps and cycles."
Header {
  Metrics {
    Label: "Active Warps"
    Name: "smsp__active_warps_avg"
  }
  Metrics {
    Label: "Active Cycles"
    Name: "smsp__active_cycles_avg"
  }
}
On data collection, this section will cause the two PerfWorks metrics smsp__active_warps_avg and smsp__active_cycles_avg to be collected.

The section as shown on the Details page
By default, when not available, metrics specified in section files will only generate a warning during data collection, and would then show up as “N/A” in the UI or CLI. This is in contrast to metrics requested via --metrics which would cause an error when not available. How to specify metrics as required for data collection is described in Metric Options and Filters.
More advanced elements can be used in the body of a section. See the ProfilerSection.proto file for which elements are available. The following example shows how to use these in a slightly more complex example. The usage of regexes is allowed in tables and charts in the section Body only and follows the format regex: followed by the actual regex to match PerfWorks metric names.
The supported list of metrics that can be used in sections can be queried using the command line interface with the --query-metrics option. Each of these metrics can be used in any section and will be automatically collected if they appear in any enabled section. Note that even if a metric is used in multiple sections, it will only be collected once. Look at all the shipped sections to see how they are implemented.
Identifier: "SampleSection"
DisplayName: "Sample Section"
Description: "This sample section shows various metrics."
Header {
  Metrics {
    Label: "Active Warps"
    Name: "smsp__active_warps_avg"
  }
  Metrics {
    Label: "Active Cycles"
    Name: "smsp__active_cycles_avg"
  }
}
Body {
  Items {
    Table {
      Label: "Example Table"
      Rows: 2
      Columns: 1
      Metrics {
        Label: "Avg. Issued Instructions Per Scheduler"
        Name: "smsp__inst_issued_avg"
      }
      Metrics {
        Label: "Avg. Executed Instructions Per Scheduler"
        Name: "smsp__inst_executed_avg"
      }
    }
  }
  Items {
    Table {
      Label: "Metrics Table"
      Columns: 2
      Order: ColumnMajor
      Metrics {
        Name: "regex:.*__elapsed_cycles_sum"
      }
    }
  }
  Items {
    BarChart {
      Label: "Metrics Chart"
      CategoryAxis {
        Label: "Units"
      }
      ValueAxis {
        Label: "Cycles"
      }
      Metrics {
        Name: "regex:.*__elapsed_cycles_sum"
      }
    }
  }
}
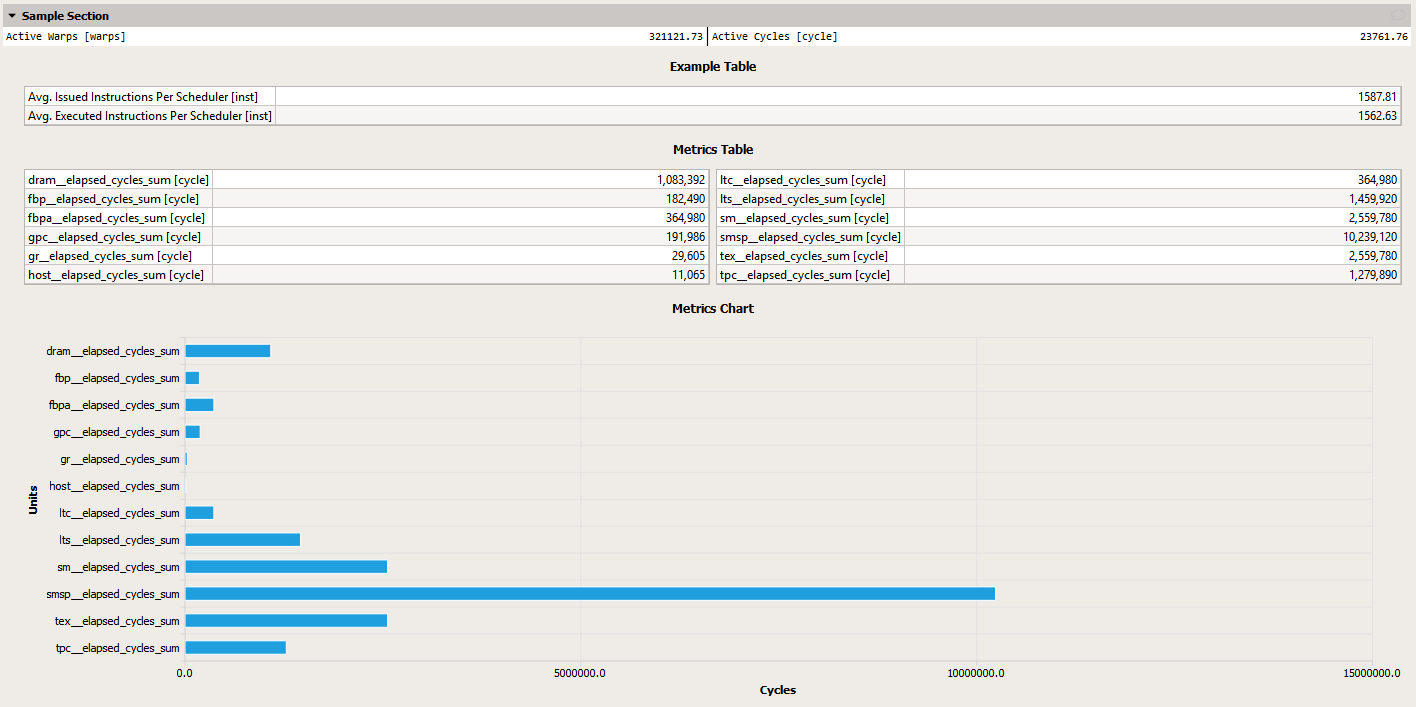
The output of this section would look similar to this screenshot in the UI
1.2.2. Section Definition
Protocol buffer definitions are in the NVIDIA Nsight Compute installation directory under extras/FileFormat. To understand section files, start with the definitions and documentation in ProfilerSection.proto.
To see the list of available PerfWorks metrics for any device or chip, use the --query-metrics option of the command line.
1.2.3. Metric Options and Filters
Sections allow the user to specify alternative options for metrics that have a different metric name on different GPU architectures. Metric options use a min-arch/max-arch range filter, replacing the base metric with the first metric option for which the current GPU architecture matches the filter. While not strictly enforced, options for a base metric are expected to share the same meaning and subsequently unit, etc., with the base metric.
In addition to its options, the base metric can be filtered by the same criteria. This is useful for metrics that are only available for certain architectures or in limited collection scopes. See ProfilerMetricOptions.proto for which filter options are available.
In the below example, the metric dram__cycles_elapsed.avg.per_second is collected on SM 7.0 and SM 7.5-8.6, but not on any in between. It uses the same metric name on these architectures.
Metrics {
    Label: "DRAM Frequency"
    Name: "dram__cycles_elapsed.avg.per_second"
    Filter {
      MaxArch: CC_70
    }
    Options {
      Name: "dram__cycles_elapsed.avg.per_second"
      Filter {
        MinArch: CC_75
        MaxArch: CC_86
      }
    }
}
In the next example, the metric in the section header is only collected for launch-based collection scopes (i.e. kernel- and application replay for CUDA kernels or CUDA Graph nodes), but not in range-based scopes.
Header {
  Metrics {
    Label: "Theoretical Occupancy"
    Name: "sm__maximum_warps_per_active_cycle_pct"
    Filter {
      CollectionFilter {
        CollectionScopes: CollectionScope_Launch
      }
    }
  }
}
Similarly, CollectionFilters can be used to set the Importance of a metric, which specifies an expectation on its availability during data collection. Required metrics, for instance, are expected to be collectable and would generate an error in case they are not available, whereas Optional metrics would only generate a warning. Here is a minimal example, illustrating the functionality:
Metrics {
  Label: "Compute (SM) Throughput"
  Name: "sm__throughput.avg.pct_of_peak_sustained_elapsed"
  Filter {
    CollectionFilter {
      Importance: Required
    }
  }
}
Filters can be applied to an entire section instead of or in addition to being set for individual metrics. If both types of filters are specified, they are combined, such that Metrics-scope filters take precedence over section-scope filters.
1.2.4. Custom Descriptions
Section files support to specify custom descriptions in many places where metrics can be used. Specifying custom descriptions should only be required when creating derived metrics or when adding new metrics through the rule system. When setting this for a metric that would otherwise have a description, the existing one is overriden by the custom value.
Metrics {
  Label: "Custom Metric"
  Name: "custom_metric"
  Description: "Metric added when the rule associated with this section file is triggered."
}
Note that the Description field is currently only supported for the section Metrics field, but not for individual Options.
1.2.5. PM Sampling Timelines
PM sampling metrics in section files should be specified in timeline fields. Timelines are items of section Body fields. Timeslines are composed of any number of MetricGroups with any number of MetricRows, each. MetricGroups can be expanded or collapsed in the timeline UI. Each MetricRow can contain any number of Metrics. If a row contains multiple metrics, their values are aggregated.
Each timeline metric should be associated with a Groups field. All metrics in the same group are collected in the same replay pass. Metrics can have optional Multiplier fields. The value of the metric is multiplied with it before being recorded in the report.
Timeline {
  MetricGroups {
    Label: "Overview"
    Expanded: true
    MetricRows {
      Metrics {
        Label: "Average Active Warps Per Cycle"
        Name: "TriageAC.tpc__warps_active_realtime.avg.per_cycle_active"
        Groups: "sampling_0"
        Multiplier: 0.5
      }
    }
    MetricRows {
      Metrics {
        Label: "Total Active Warps Per Cycle"
        Name: "TriageAC.tpc__warps_active_realtime.sum.per_cycle_active"
        Groups: "sampling_0"
      }
    }
  }

  MetricGroups {
    Label: "SM"
    Expanded: true
    MetricRows {
      Metrics {
        Label: "SM Throughput"
        Name: "TriageSCG.sm__throughput.avg.pct_of_peak_sustained_elapsed"
        Groups: "sampling_1"
      }
  }
1.2.6. Counter Domains
PM sampling metrics are composed of one or more raw counter dependencies internally. Each counter is associated with a counter domain, which describes how and where in the hardware the counter is collected. For metrics specified in section files, the automatic domain selection can be overwritten when needed to form more optimal PM sampling metric groups.
Metrics {
  Label: "Short Scoreboard"
  Name: "pmsampling:smsp__warps_issue_stalled_short_scoreboard.avg"
  Groups: "sampling_ws4"
  CtrDomains: "gpu_sm_c"
}
Note that the CtrDomains field is currently only supported for the section Metrics field, but not for individual Options.
1.2.7. Missing Sections
If new or updated section files are not used by NVIDIA Nsight Compute, it is most commonly one of two reasons:
The file is not found: Section files must have the .section extension. They must also be on the section search path. The default search path is the sections directory within the installation directory. In NVIDIA Nsight Compute CLI, the search paths can be overwritten using the --section-folder and --section-folder-recursive options. In NVIDIA Nsight Compute, the search path can be configured in the Profile options.
Syntax errors: If the file is found but has syntax errors, it will not be available for metric collection. However, error messages are reported for easier debugging. In NVIDIA Nsight Compute CLI, use the --list-sections option to get a list of error messages, if any. In NVIDIA Nsight Compute, error messages are reported in the Metric Selection tool window.
1.2.8. Derived Metrics
Derived Metrics allow you to define new metrics composed of constants or existing metrics directly in a section file. The new metrics are computed at collection time and added permanently to the profile result in the report. They can then subsequently be used for any tables, charts, rules, etc.
NVIDIA Nsight Compute currently supports the following syntax for defining derived metrics in section files:
MetricDefinitions {
  MetricDefinitions {
    Name: "derived_metric_name"
    Expression: "derived_metric_expr"
  }
  MetricDefinitions {
    ...
  }
  ...
}
The actual metric expression is defined as follows:
derived_metric_expr ::= operand operator operand
operator            ::= + | - | * | /
operand             ::= metric | constant
metric              ::= (an existing metric name)
constant            ::= double | uint64
double              ::= (double-precision number of the form "N.(M)?", e.g. "5." or "0.3109")
uint64              ::= (64-bit unsigned integer number of the form "N", e.g. "2029")
Operators are defined as follows:
For op in (+ | - | *): For each element in a metric it is applied to, the expression left-hand side op-combined with expression right-hand side.
For op in (/): For each element in a metric it is applied to, the expression left-hand side op-combined with expression right-hand side. If the right-hand side operand is of integer-type, and 0, the result is the left-hand side value.
Since metrics can contain regular values and/or instanced values, elements are combined as below. Constants are treated as metrics with only a regular value.
1. Regular values are operator-combined.
a + b

2. If both metrics have no correlation ids, the first N values are operator-combined, where N is the minimum of the number of elements in both metrics.
a1 + b1
a2 + b2
a3
a4

3. Else if both metrics have correlation ids, the sets of correlation ids from both metrics are joined and then operator-combined as applicable.
a1 + b1
a2
b3
a4 + b4
b5

4. Else if only the left-hand side metric has correlation ids, the right-hand side regular metric value is operator-combined with every element of the left-hand side metric.
a1 + b
a2 + b
a3 + b

5. Else if only the right-hand side metric has correlation ids, the right-hand side element values are operator-combined with the regular metric value of the left-hand side metric.
a + b1 + b2 + b3
In all operations, the value kind of the left-hand side operand is used. If the right-hand side operand has a different value kind, it is converted. If the left-hand side operand is a string-kind, it is returned unchanged.
Examples for derived metrics are derived__avg_thread_executed, which provides a hint on the number of threads executed on average at each instruction, and derived__uncoalesced_l2_transactions_global, which indicates the ratio of actual L2 transactions vs. ideal L2 transactions at each applicable instruction.
MetricDefinitions {
  MetricDefinitions {
    Name: "derived__avg_thread_executed"
    Expression: "thread_inst_executed_true / inst_executed"
  }
  MetricDefinitions {
    Name: "derived__uncoalesced_l2_transactions_global"
    Expression: "memory_l2_transactions_global / memory_ideal_l2_transactions_global"
  }
  MetricDefinitions {
    Name: "sm__sass_thread_inst_executed_op_ffma_pred_on_x2"
    Expression: "sm__sass_thread_inst_executed_op_ffma_pred_on.sum.peak_sustained * 2"
  }
}
1.3. Rule System
NVIDIA Nsight Compute features a Python-based rule system.
1.3.1. Writing Rules
To create a new rule, you need to create a new text file with the extension .py and place it at some location that is detectable by the tool (see Nsight Compute Integration on how to specify the search path for rules). At a minimum, the rule file must implement two functions, get_identifier and apply. See Rule File API for a description of all functions supported in rule files. See NvRules for details on the interface available in the rule’s apply function.
1.3.2. Integration
The rule system is integrated into NVIDIA Nsight Compute as part of the profile report view. When you profile a kernel, available rules will be shown in the report’s Details page. You can either select to apply all available rules at once by clicking Apply Rules at the top of the page, or apply rules individually. Once applied, the rule results will be added to the current report. By default, all rules are applied automatically.
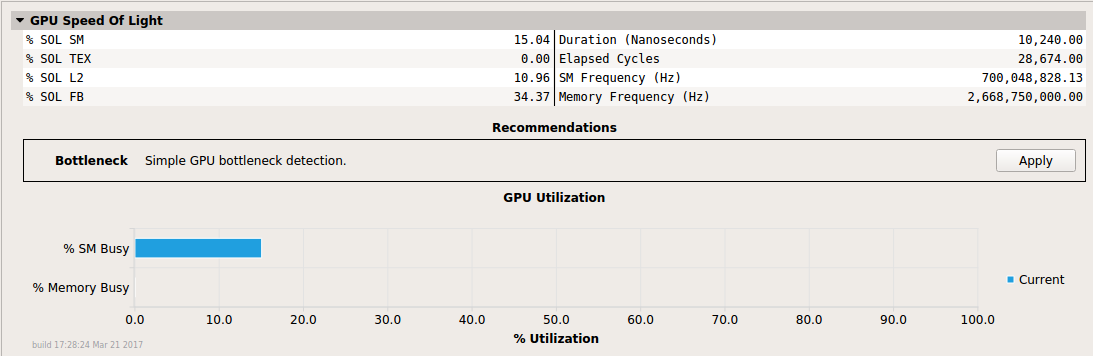
Section with a single Bottleneck rule available.
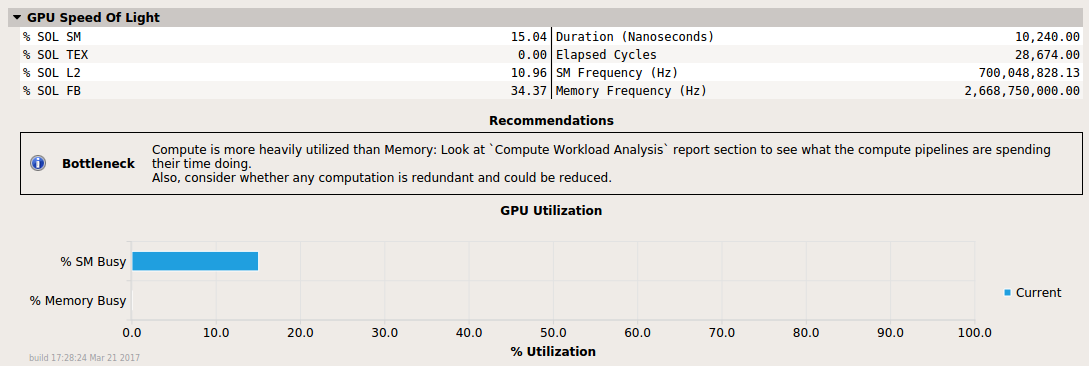
The same section with the Bottleneck rule applied. It added a single message to the report.
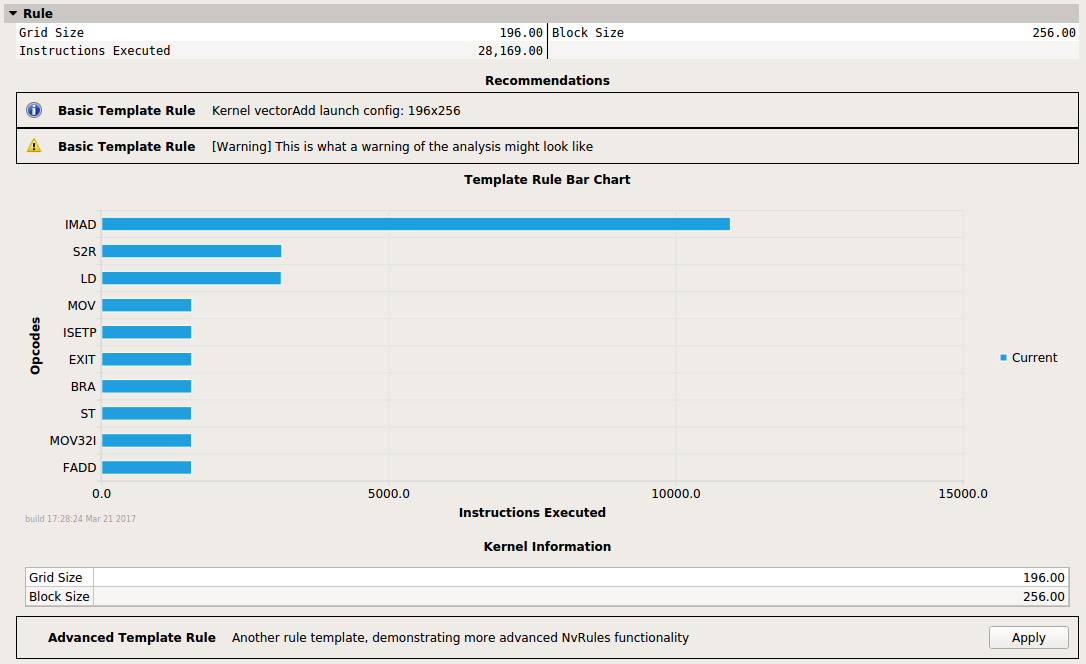
The section Rule has two associated rules, Basic Template Rule and Advanced Template Rule. The latter is not yet applied. Rules can add various UI elements, including warning and error messages as well as charts and tables.
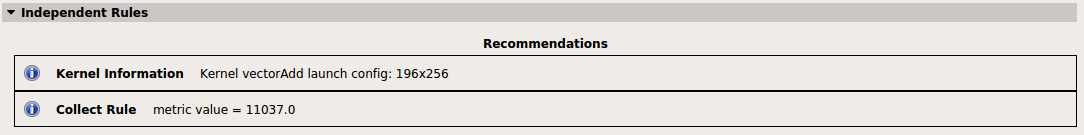
Some rules are applied independently from sections. They are shown under Independent Rules.
1.3.3. Rule System Architecture
The rule system consists of the Python interpreter, the NvRules C++ interface, the NvRules Python interface (NvRules.py) and a set of rule files. Each rule file is valid Python code that imports the NvRules.py module, adheres to certain standards defined by the Rule File API and is called from the tool.
When applying a rule, a handle to the rule Context is provided to its apply function. This context captures most of the functionality that is available to rules as part of the NvRules API. In addition, some functionality is provided directly by the NvRules module, e.g. for global error reporting. Finally, since rules are valid Python code, they can use regular libraries and language functionality that ship with Python as well.
From the rule Context, multiple further objects can be accessed, e.g. the Frontend, Ranges and Actions. It should be noted that those are only interfaces, i.e. the actual implementation can vary from tool to tool that decides to implement this functionality.
Naming of these interfaces is chosen to be as API-independent as possible, i.e. not to imply CUDA-specific semantics. However, since many compute and graphics APIs map to similar concepts, it can easily be mapped to CUDA terminology, too. A Range refers to a CUDA stream, an Action refers to a single CUDA kernel instance. Each action references several Metrics that have been collected during profiling (e.g. instructions executed) or are statically available (e.g. the launch configuration). Metrics are accessed via their names from the Action.
Each CUDA stream can contain any number of kernel (or other device activity) instances and so each Range can reference one or more Actions. However, currently only a single Action per Range will be available, as only a single CUDA kernel can be profiled at once.
1.3.4. NvRules API
The NvRules API is defined as a C/C++ style interface, which is converted to the NvRules.py Python module to be consumable by the rules. As such, C++ class interfaces are directly converted to Python classes und functions. See the NvRules API documentation for the classes and functions available in this interface.
1.3.5. Rule File API
The Rule File API is the implicit contract between the rule Python file and the tool. It defines which functions (syntactically and semantically) the Python file must provide to properly work as a rule.
Mandatory Functions
get_identifier(): Return the unique rule identifier string.apply(handle): Apply this rule to the rule context provided by handle. UseNvRules.get_context(handle)to obtain the Context interface from handle.get_name(): Return the user-consumable display name of this rule.get_description(): Return the user-consumable description of this rule.
Optional Functions
get_section_identifier(): Return the unique section identifier that maps this rule to a section. Section-mapped rules will only be available if the corresponding section was collected. They implicitly assume that the metrics requested by the section are collected when the rule is applied.evaluate(handle):Declare required metrics and rules that are necessary for this rule to be applied. Use
NvRules.require_metrics(handle, [...])to declare the list of metrics that must be collected prior to applying this rule.Use e.g.
NvRules.require_rules(handle, [...])to declare the list of other rules that must be available before applying this rule. Those are the only rules that can be safely proposed by the Controller interface.
1.3.6. IFrontend API
The Frontend provides an interface to manipulate the tool UI by adding messages, graphical elements (such as charts and tables), as well as speedup estimations, focus metrics and source markers.
The most common use case is for a rule to show at least one message, stating the result to the user,
as illustrated in extras/RuleTemplates/BasicRuleTemplate.py.
This could be as simple as “No issues have been detected,” or contain direct hints as to how the user could improve the code,
e.g., “Memory is more heavily utilized than Compute. Consider whether it is possible for the kernel to do more compute work.”
The extras/RuleTemplates directory contains a number of templates for more advanced use cases of the Frontend API,
such as adding speedup estimates and focus metrics (SpeedupWithFocusMetrics.py) or generic tables (RuleWithTable.py)
to a rule result.
The full API for the Frontend is documented in the IFrontend API documentation.
1.3.7. Rule Examples
The following example rule determines on which major GPU architecture a kernel was running.
import NvRules

def get_identifier():
  return "GpuArch"

def apply(handle):
  ctx = NvRules.get_context(handle)
  action = ctx.range_by_idx(0).action_by_idx(0)
  ccMajor = action.metric_by_name("device__attribute_compute_capability_major").as_uint64()
  ctx.frontend().message("Running on major compute capability " + str(ccMajor))
1.4. Source Counters
The Source page provides correlation of various metrics with CUDA-C, PTX and SASS source of the application, depending on availability.
Which source metrics are collected and the order in which they are displayed in this page is controlled using section files, specifically using SourceMetrics entries. Each SourceMetrics entry defines one ordered group of metrics, and can be assigned an optional Order value. This value defines the ordering among those groups in the Source page. This allows you to define a group of memory-related source counters in one and a group of instruction-related counters in another section file.
Identifier: "CustomSourceMetrics"
DisplayName: "Custom Source Metrics"
SourceMetrics {
  Order: 2
  Metrics {
    Label: "Instructions Executed"
    Name: "inst_executed"
  }
  Metrics {
    Label: "Float-value metric"
    Name: "float_value_metric"
    Description: "Custom, optional metric description"
    DisplayProperties {
      SourceView {
        DefaultVisible: false
      }
    }
  }
  Metrics {
    Label: ""
    Name: "collected_but_not_shown"
  }
}
Metrics {
  Order: 3
  Metrics {
    Label: "Uint64-value metric"
    Name: "uint64_value_metric"
}
If a Source Counter metric is given an empty label attribute in the section file, it will be collected but not shown on the page. Default visibility can also be set through the DisplayProperties field as shown in the example above. The Metrics groups has been deprecated to define metrics that should be shown on the Source page, and SourceMetrics groups should be used instead, as the former only supports metrics with uint64-type instance values.
1.5. Report File Format
This section documents the internals of the profiler report files (reports in the following) as created by NVIDIA Nsight Compute.
Note
The file format is subject to change in future releases without prior notice.
Report files can optionally be compressed using zstd compression. They will
then use the .ncu-repz extension instead of the usual .ncu-rep extension.
When this is the case, the whole format described in this section is
encapsulated into a compressed container.
1.5.1. Version 7 Format
Reports of version 7 are a combination of raw binary data and serialized Google Protocol Buffer version 2 messages (proto). All binary entries are stored as little endian. Protocol buffer definitions are in the NVIDIA Nsight Compute installation directory under extras/FileFormat.
Offset [bytes] |
Entry |
Type |
Value |
|---|---|---|---|
0 |
Magic Number |
Binary |
NVR\0 |
4 |
Integer |
Binary |
sizeof(File Header) |
8 |
File Header |
Proto |
Report version |
8 + sizeof(File Header) |
Block 0 |
Mixed |
CUDA CUBIN source, profile results, session information |
8 + sizeof(File Header) + sizeof(Block 0) |
Block 1 |
Mixed |
CUDA CUBIN source, profile results, session information |
… |
… |
… |
… |
Offset [bytes] |
Entry |
Type |
Value |
|---|---|---|---|
0 |
Integer |
Binary |
sizeof(Block Header) |
4 |
Block Header |
Proto |
Number of entries per payload type, payload size |
4 + sizeof(Block Header) |
Block Payload |
Mixed |
Payload (CUDA CUBIN sources, profile results, session information, string table) |
Offset [bytes] |
Entry |
Type |
Value |
|---|---|---|---|
0 |
Integer |
Binary |
sizeof(Payload type 1, entry 1) |
4 |
Payload type 1, entry 1 |
Proto |
|
4 + sizeof(Payload type 1, entry 1) |
Integer |
Binary |
sizeof(Payload type 1, entry 2) |
8 + sizeof(Payload type 1, entry 1) |
Payload type 1, entry 2 |
Proto |
|
… |
… |
… |
… |
… |
Integer |
Binary |
sizeof(Payload type 2, entry 1) |
… |
Payload type 2, entry 1 |
Proto |
|
… |
… |
… |
… |
- Proto files are currently deployed in a flat directory but may need to be arranged in the following directory structure during compilation for their
importdirectives to work: CpuStacktrace/CpuStacktrace.proto
Nvtx/Nvtx.proto
Nvtx/NvtxCategories.proto
Profiler/ProfilerMetricOptions.proto
Profiler/ProfilerResultsCommon.proto
Profiler/ProfilerStringTable.proto
ProfilerReport.proto
ProfilerReport/ProfilerReportCommon.proto
ProfilerSection/ProfilerSection.proto
RuleSystem/RuleResults.proto
Notices
Notices
ALL NVIDIA DESIGN SPECIFICATIONS, REFERENCE BOARDS, FILES, DRAWINGS, DIAGNOSTICS, LISTS, AND OTHER DOCUMENTS (TOGETHER AND SEPARATELY, “MATERIALS”) ARE BEING PROVIDED “AS IS.” NVIDIA MAKES NO WARRANTIES, EXPRESSED, IMPLIED, STATUTORY, OR OTHERWISE WITH RESPECT TO THE MATERIALS, AND EXPRESSLY DISCLAIMS ALL IMPLIED WARRANTIES OF NONINFRINGEMENT, MERCHANTABILITY, AND FITNESS FOR A PARTICULAR PURPOSE.
Information furnished is believed to be accurate and reliable. However, NVIDIA Corporation assumes no responsibility for the consequences of use of such information or for any infringement of patents or other rights of third parties that may result from its use. No license is granted by implication of otherwise under any patent rights of NVIDIA Corporation. Specifications mentioned in this publication are subject to change without notice. This publication supersedes and replaces all other information previously supplied. NVIDIA Corporation products are not authorized as critical components in life support devices or systems without express written approval of NVIDIA Corporation.
Trademarks
NVIDIA and the NVIDIA logo are trademarks or registered trademarks of NVIDIA Corporation in the U.S. and other countries. Other company and product names may be trademarks of the respective companies with which they are associated.