1. Analysis Tools
The NVIDIA Nsight Visual Studio Edition Analysis Tools provide the tools you need to analyze your GPU Computing application.
You can use the Analysis tools to isolate performance bottlenecks by viewing system-wide CPU+GPU events. You can also identify issues that arise in multi-threaded applications,such as race conditions and deadlock conditions.
Generate Reports on Trace Data
See activities and events across your CPU and GPU in individual reports or on a single, correlated timeline.
The tools support all major GPU Computing APIs, including:
-
CUDA C,
-
Direct3D 11,
-
OpenCL
 ,
,
-
OpenGL, and
-
Cg.
![]() NOTE: OpenCL support in NVIDIA Nsight Visual Studio Edition has been deprecated and will be removed in a future release.
NOTE: OpenCL support in NVIDIA Nsight Visual Studio Edition has been deprecated and will be removed in a future release.
You can also collect the following trace data:
-
GPU <-> Host memory transfers
-
GPU workload executions
-
CPU core, thread and process events
-
Custom user events - Mark custom events or time ranges using a C API
|
Note: |
Integrated CUDA profiling, deprecated since NVIDIA Nsight Visual Studio Edition 2019.2, has been removed from the Performance Analysis tools in NVIDIA Nsight Visual Studio Edition 2020.1 and replaced by:
|
2. The Activity Document
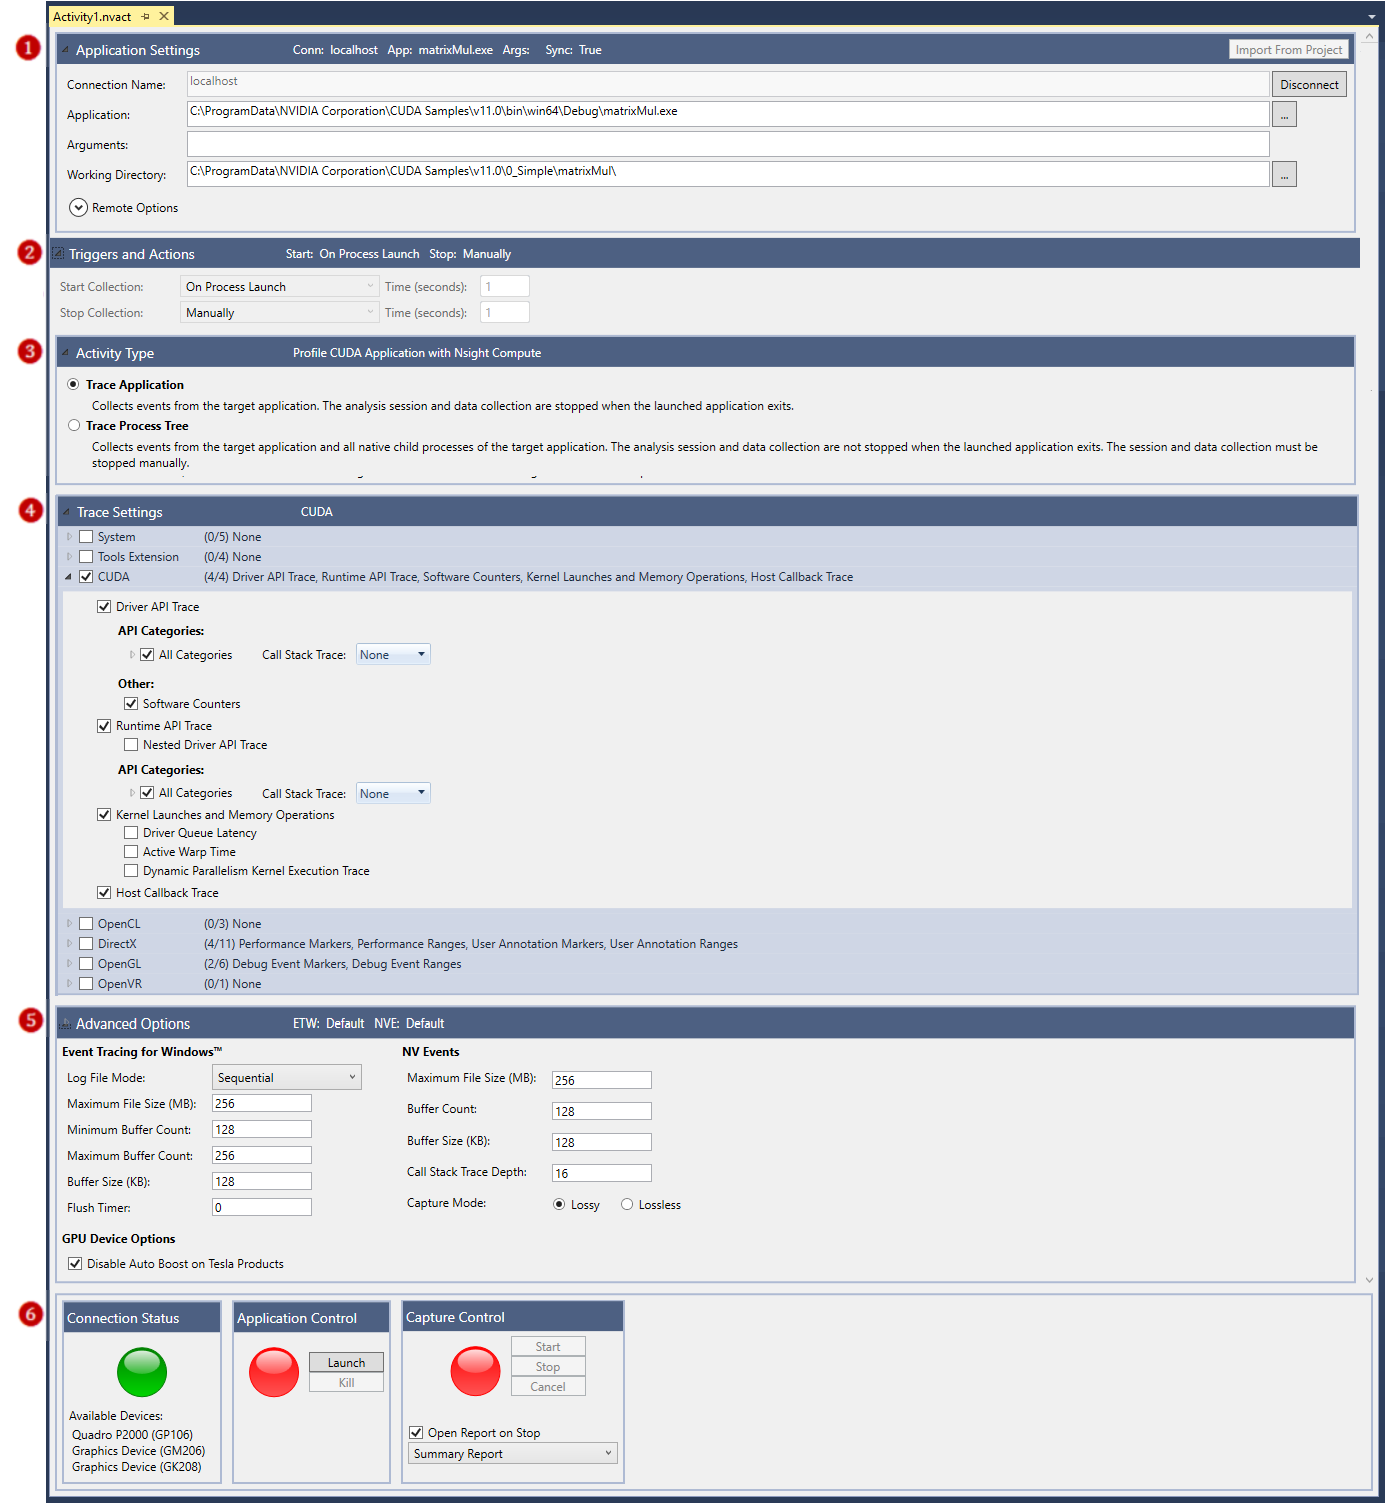
The NVIDIA Nsight Visual Studio Edition Analysis Tools provide reports on various kinds of trace data of an application. You define the kind of data that you want to collect on the Analysis Activity document. The following explains the different sections of the Activity document.
2.1. Application Settings
 Use this section of the Activity document to specify the application that you want to analyze. These settings are independent
of the project settings, but can be imported from the project (if desired) using the Import from Project button. For information
on Import from Project, specifically about Remote Options, see Synchronizing Analysis Tool Settings with the Project Settings.
Use this section of the Activity document to specify the application that you want to analyze. These settings are independent
of the project settings, but can be imported from the project (if desired) using the Import from Project button. For information
on Import from Project, specifically about Remote Options, see Synchronizing Analysis Tool Settings with the Project Settings.
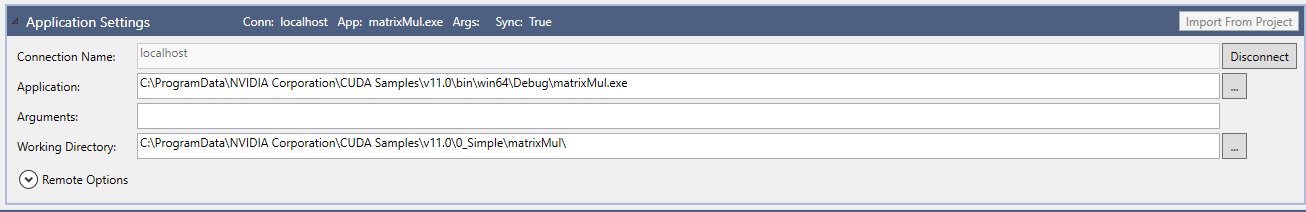
| Setting / Field | Description | ||||||
|---|---|---|---|---|---|---|---|
|
Connection Name |
The name of the machine on which the target application is to run. If you opened the Activity document while a project was open in Visual Studio, this field is automatically populated with the machine name you specified in the project's Nsight - User Settings window. |
||||||
|
Application |
The absolute path to the target application. |
||||||
|
Arguments |
Input arguments for the target application. |
||||||
|
Working Directory |
If no directory specified, the default is the directory where the target application resides. |
||||||
|
Remote Options |
The settings for Remote Options are available when the application to be analyzed is on a remote machine.
|
2.2. Triggers and Actions
 The Triggers and Actions section of the Activity document allows you to define how you want the capture session to start
and end.
The Triggers and Actions section of the Activity document allows you to define how you want the capture session to start
and end.
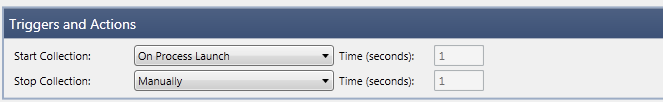
| Setting | Description |
|---|---|
|
Start Collection |
Select which event you want to trigger the start of a data capture. |
|
Stop Collection |
Select which event you want to trigger the end of a data capture. |
2.3. Activity Type
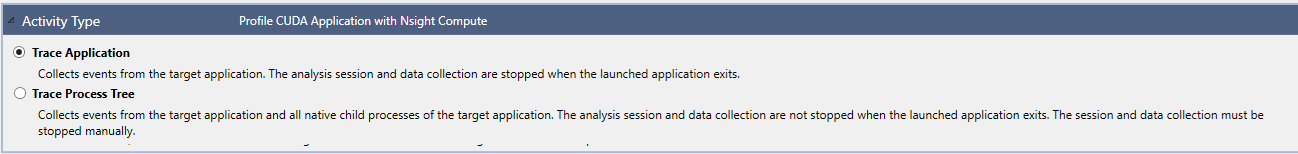
 In the Activity Type section of the Activity document, specify the kind of analysis that you want to perform.
| Setting | Description |
|---|---|
|
Trace Application |
Select Trace Application to collect trace data from a single target application. |
|
Trace Process Tree |
Select Trace Process Tree to collect trace data from a target application and all native child processes of the target application. When performing a system trace, the Analysis Tool does not stop capturing data when you kill the launched application. You must stop the capture of data manually by clicking on the Stop button under Capture Control. One of the benefits of performing a Trace Process Tree is that it allows you to capture data from programs that used a launcher application. This means that the capture could contain pertinent information about child processes that continue after the target application terminates. That is why the Analysis tool does not automatically stop a system trace when a launched application terminates, and why you must manually stop the collection of data. |
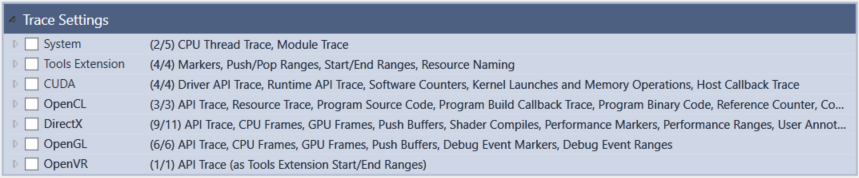
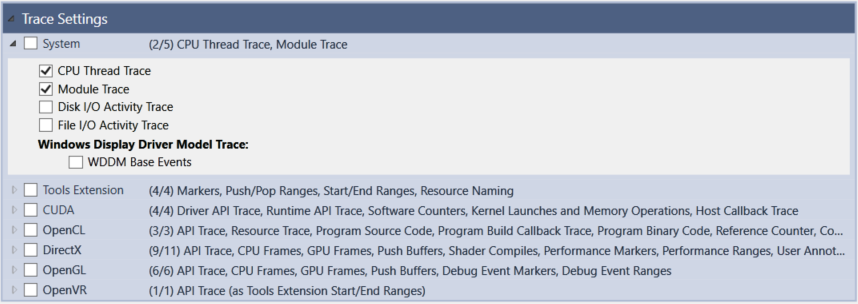
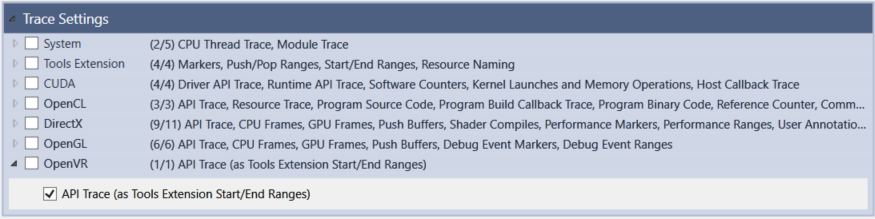
2.4. Trace Settings
 Expand the Trace Settings in order to mark the specific counters or signals on which you want to collect data.
|
Warning! |
Events in the System group use the Event Tracing for Windows (ETW) kernel provider. There are two requirements for capturing these events:
|
When you mark sub-items of a group, the checkboxes stay marked or unmarked even if you unmark the checkbox of the group.
For example, if you were to uncheck the CUDA checkbox in the following figure, the analysis tools will not collect any of the trace data in that subgroup. However, the sub-settings remain marked as you last set them.
For more details on the types of trace activities, see Analysis Trace Settings.
Note that if any problems are detected with the trace settings you've selected, a yellow warning icon will appear.
2.5. Advanced Options
 The Advanced Options section contains settings users will typically not need to adjust, but are provided to allow more flexibility. The top section
allows you to configure file and buffer sizes for two tracing frameworks: ETW and NVE.
The Advanced Options section contains settings users will typically not need to adjust, but are provided to allow more flexibility. The top section
allows you to configure file and buffer sizes for two tracing frameworks: ETW and NVE.
| Setting | Description |
|---|---|
|
Event Tracing for Windows (ETW) |
A tracing framework provided by Microsoft, ETW helps you examine system-level activity by capturing kernel and application-defined events. |
|
NV Events (NVE) |
A tracing framework provided by NVIDIA, NVE helps you examine application activity by capturing events from the graphics driver. |
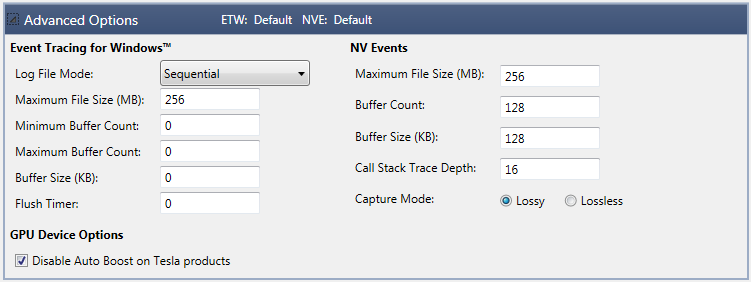
In the GPU Device Options section, you can choose to disable Auto Boost, which will cause kernels running on Tesla-based GPUs to execute at fixed speeds lower than Auto Boost levels, while ensuring that performance will be consistent across multiple runs.
The base clock speed for Tesla products ensures that any program will run within the published power limits, but many programs are not power-limited, allowing clock speed to be safely increased. Auto Boost is a feature of K40 and newer Tesla GPUs that dynamically adjusts clock speed to achieve higher performance when not power-limited. Auto Boost is enabled by default by the driver, but since dynamic clock speeds make profiling less accurate, NVIDIA Nsight VSE provides this setting to disable Auto Boost. Usage of the CUDA_AUTO_BOOST environment variable overrides this setting. Geforce and Quadro GPUs are not affected.
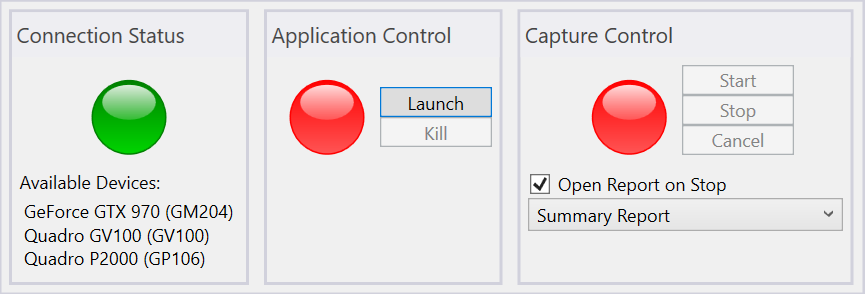
2.6. Launch and Capture Control
 Use this section of the Activity document to control starting and stopping the capture session.
| Setting | Description | ||||||||||
|---|---|---|---|---|---|---|---|---|---|---|---|
|
Connection Status |
Green indicates that the Analysis Tool has an active connection to the Nsight Monitor. Yellow indicates that the activity is trying to connect. Red indicates that there is no active connection. You must have an active connection to start a capture session. If the indicator is red, make sure the Nsight Monitor is running on the system specified in the settings at the top of the Activity document under Connection and Application Settings. Click on the Connect button to initiate a connection. |
||||||||||
|
Application Control |
Green indicates that the target application is running. Red indicates that the target application is not running. Click Launch to manually start the target application specified in the Connection and Application Settings section at the top of the Activity document. Click Kill to manually terminate the target application. If you are performing a System Trace, the Analysis Tool collects events from the target application and all native child processes of the target application. For that reason, the Analysis Tool does not stop capturing data when you kill the launched application. You must stop the capture manually by clicking on the Stop button under Capture Control. |
||||||||||
|
Capture Control |
Green indicates that the Analysis Tool is currently capturing data from the application, and red indicates that capture is currently disabled. If you set Start Collection in the Triggers and Actions section to "On Process Launch," capture will automatically begin when you launch the application. If you choose "Manually," capture will not begin until you click Start in the Capture Control. If you find that enabling capture for the entire lifetime of your application creates excessively large reports that load slowly, use the manual capture control to limit capture to the parts of your application which you most want to analyze.
|
3. Analysis Reports
How Are Reports Organized?
Launching an application from the activity document initiates a capture session. For each capture session, the analysis tool creates a directory to collect reports, named with application's name, the date, and an incrementing session number to discriminate between multiple sessions on the same day. Each time you start and stop capture during the session, a new capture subdirectory will be created in the session directory. The files in that directory comprise a capture report, and these files can opened in Visual Studio by NVIDIA Nsight VSE on any computer, so you can zip and email your capture reports for others to view. These are the types of files you will find in a capture directory:
-
*.nvreport — Represents the capture report. Drag this file into Visual Studio to view the report.
-
*.nvreportpersist — Created when a report is viewed. Saves navigation and viewing state so you can close and reopen a report, and everything will be as you left it.
-
*.nvact — A copy of the activity file that was used to create the capture. Provided so you can run another session similar to the one that produced the report.
-
*.nvevents — Log file produced by NVIDIA Nsight VSE instrumentation of the application.
-
*.etl — Log file produced by Event Tracing for Windows (ETW) instrumentation in the Windows kernel. Can also be opened by Microsoft performance tools such as Xperfview.
You can open a capture report in Visual Studio with NVIDIA Nsight VSE either by directly opening the .nvreport file, or by enabling the option it your activity to automatically open the capture report as soon as capturing ends. The report and its log files contain a vast amount of information, which NVIDIA Nsight VSE helps you navigate. The report is represented as a drop-down list of report pages, each of which focuses on a specific aspect of the capture data.
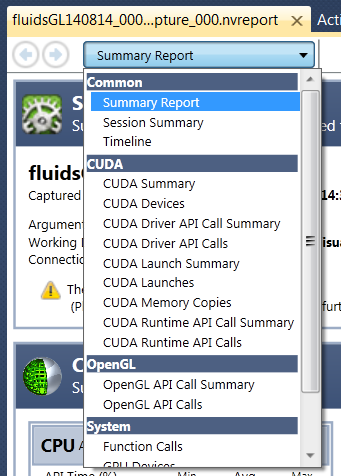
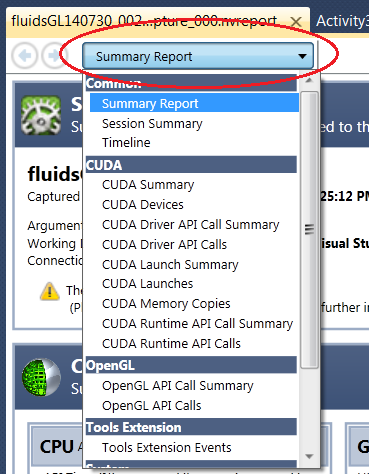
There are several ways to navigate through the report pages. You can use the drop-down menu at the top to jump to a specific report page:
Many of the report pages display data in a table. All of the pages using this format support the same rich set of features: you can show/hide columns, sort by any column, regroup the rows by common values from any column, and create filters to limit the visible data. You can export the visible data to a file, so you can load it in a spreadsheet tool or automated test system.
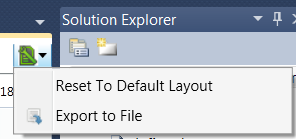
Report tables can be exported into the following formats: Excel XML, HTML, CSV, and plain text (*.txt).
Types of Report Pages
Capture reports use three types of report pages:
- Summary Page — a synopsis of the data recorded during a single capture session. For more information, see Summary Report.
- Table Pages — there are several kinds of detailed reports that show information in a table format, such as time spent in each function, number of calls to each function, etc. For more information, see Detailed Reports.
- Timeline Page — shows events captured from API instrumentation (CUDA, Direct3D, OpenCL, NVTX), Windows kernel events (CPU core usage, context switches, thread states), and GPU events (CUDA kernels, Direct3D draw
calls) visually along a timeline that spans the duration of the capture. You can quickly navigate and zoom the timeline using
the mouse or keyboard, and detailed information is provided for selected events. For more information, see Timeline Report.
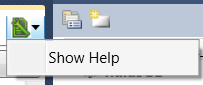
Note that when you are on the timeline page, the drop-down in the far upper right does not export to file, but instead gives you an option to display help tips in a pop-up window.
![]() NOTE: OpenCL support in NVIDIA Nsight Visual Studio Edition has been deprecated and will be removed in a future release.
NOTE: OpenCL support in NVIDIA Nsight Visual Studio Edition has been deprecated and will be removed in a future release.
4. Analysis Trace Settings
When setting up your NVIDIA Nsight VSE analysis session on the Activity Document, if you have selected either Trace Application or Trace Process Tree under the Activity Type section, you will have the following types of trace settings available for analysis.
4.1. System
The System option includes the following traces:
-
CPU Thread Trace — Enables the collection of CPU thread information.
-
Module Trace — Enables collection of module information.
-
Disk I/O Activity Trace — Enables the collection of disk I/O events.
-
File I/O Activity Trace — Enables the collection of file I/O events. Note that enabling this option can significantly increase the report file size. In case events get lost during the capture, you should consider increasing the ETW file size limit, the buffer count, or the buffer size.
-
Windows Display Driver Model (WDDM) Base Events Trace — Enables the tracing of WDDM base events: vertical syncs, context activities, GPU usage.
If you want to be able to collect call stack trace data from the other performance analysis tests, the System setting must be enabled.
|
Warning! |
Events in the System group use the Event Tracing for Windows (ETW) kernel provider. There are two requirements for capturing these events:
|
4.2. Tools Extension
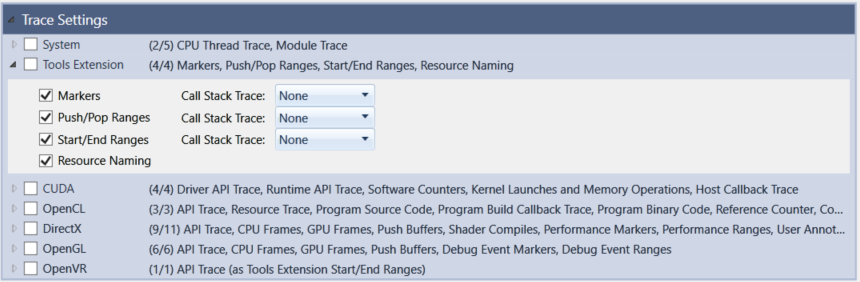
The Tools Extension option includes the following traces:
-
Markers — Enables the tracing of NVTX library marker events. The call stack trace options here are None or Always.
-
Push/Pop Ranges — Enables the tracing of NVTX library push/pop range events. The call stack trace options here are None, Always, On Push, or On Pop.
-
Start/End Ranges — Enables the tracing of NVTX library start/end range events. The call stack trace options here are None, Always, On Start, or On End.
-
Resource Naming — Enables the tracing of NVTX library resource naming events.
For more detail on the Tools Extension trace activities, see NVTX Implementation.
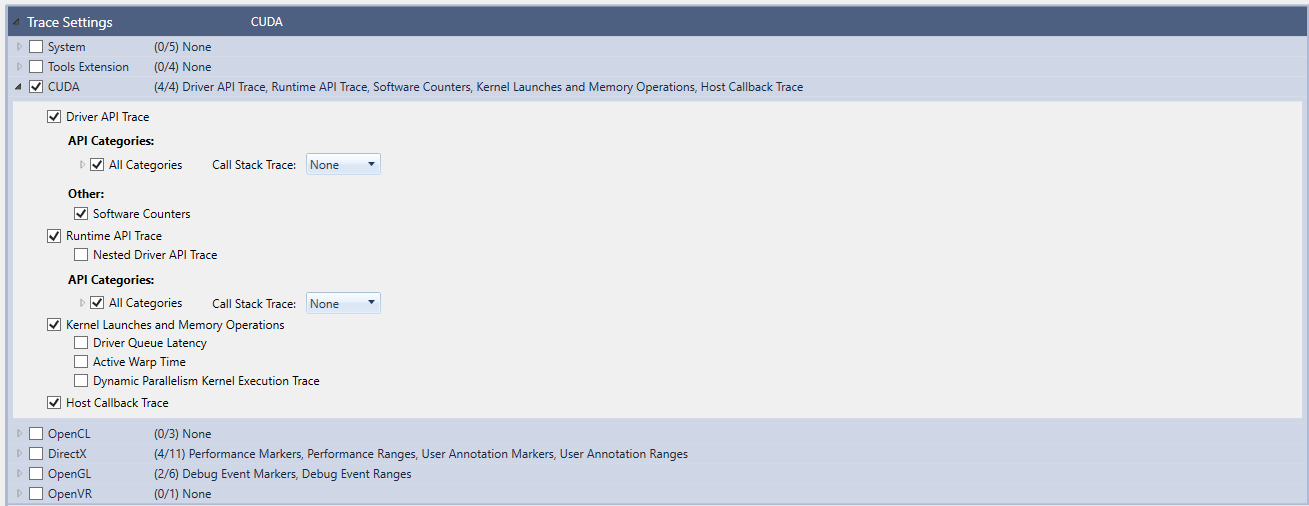
4.3. CUDA
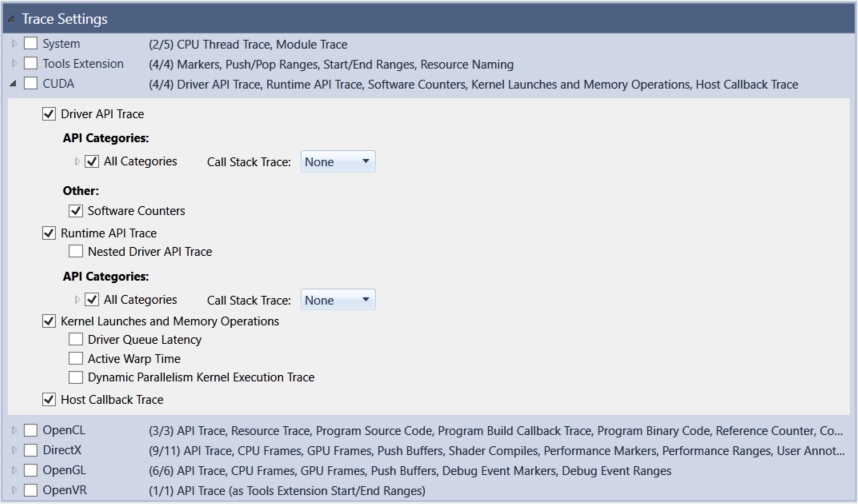
The CUDA option includes the following traces:
-
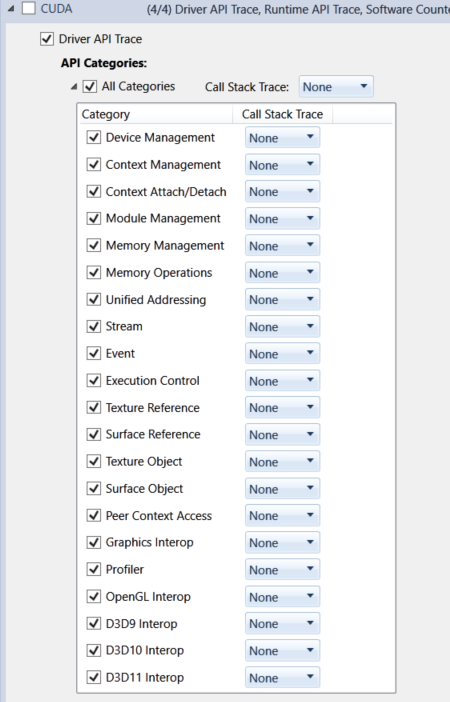
Driver API Trace — Enables tracing of CUDA driver API calls. If you select this option and the API Categories sub-option, you can click the call stack trace drop-down option and select None, Always, or On Error.
-
API Categories — You can expand the All Categories option and choose from which APIs you wish to collect data.
-
API Categories
-
Device Management
-
Context Management
-
Context Attach/Detach
-
Module Management
-
Memory Management
-
Memory Operations
-
Unified Addressing
-
Stream
-
Event
-
Execution Control
-
Texture Reference
-
Surface Reference
-
Texture Object
-
Surface Object
-
Peer Context Access
-
Graphics Interop
-
Profiler
-
OpenGL Interop
-
D3D9 Interop
-
D3D10 Interop
-
D3D11 Interop
-
-
Software Counters — Enables collection of software counter tracing.
-
-
Runtime API Trace
-
Nested Driver API Trace — Enables tracing of CUDA driver API calls made from inside the CUDA runtime layer. If you select this option and the API Categories sub-option, you can click the call stack trace drop-down option and select None, Always, or On Error.
-
API Categories — As with the CUDA Driver API Trace, you can also select the drop-down menu next to All Categories and customize which call stack trace data you wish to collect.
-
-
Kernel Launches and Memory Operations — Enables collection of kernel launches, memory copies, and memory sets.
-
Driver Queue Latency — Enables tracking of the driver workload queue and the GPU workload queue. For kernel launches and memory operations, this adds the queue time and the submit time to the report.
-
Active Warp Time — Enables tracking of the active warp time for each kernel launch. The active warp time is defined by as the sum of the execution durations for all warps of a kernel launch.
-
Dynamic Parallelism Kernel Execution Trace — Enables tracing of the execution activity for dynamic parallelism device kernel launches.
-
-
Host Callback Trace — Enables tracing of host callbacks added to CUDA streams.
4.4. OpenCL
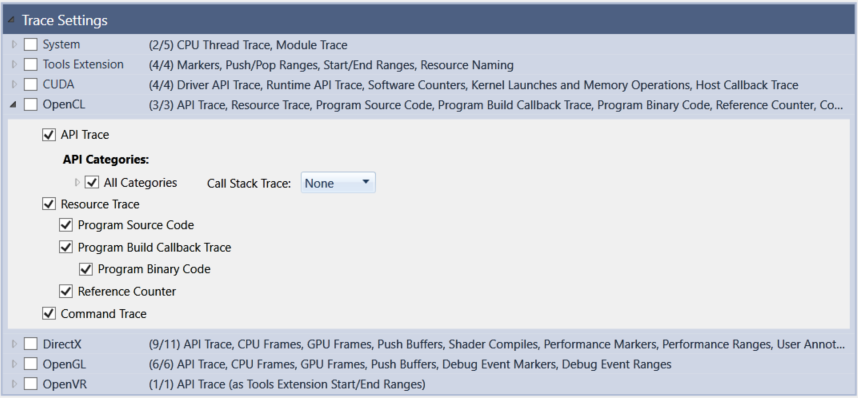
The OpenCL option includes the following traces:
-
API Trace — Enables tracing of OpenCL API calls. If you select this option and the API Categories sub-option, you can click the call stack trace drop-down option and select None, Always, or On Error.
-
API Categories — As with the CUDA Driver API Trace, you can select the drop-down menu next to API Categories and customize which call stack trace data you wish to collect.
-
-
Resource Trace — Enables tracing of OpenCL resources.
-
Program Source Code — Enables tracing of source code for OpenCL programs.
-
Program Build Callback Trace — Enables tracing of the OpenCL build program pfn_notify callback.
-
Program Binary Code — Enables tracing of binary code for OpenCL programs.
-
-
Reference Counter — Enables tracing of reference counters for OpenCL objects.
-
-
Command Trace — Enables tracing of OpenCL commands.
4.5. DirectX
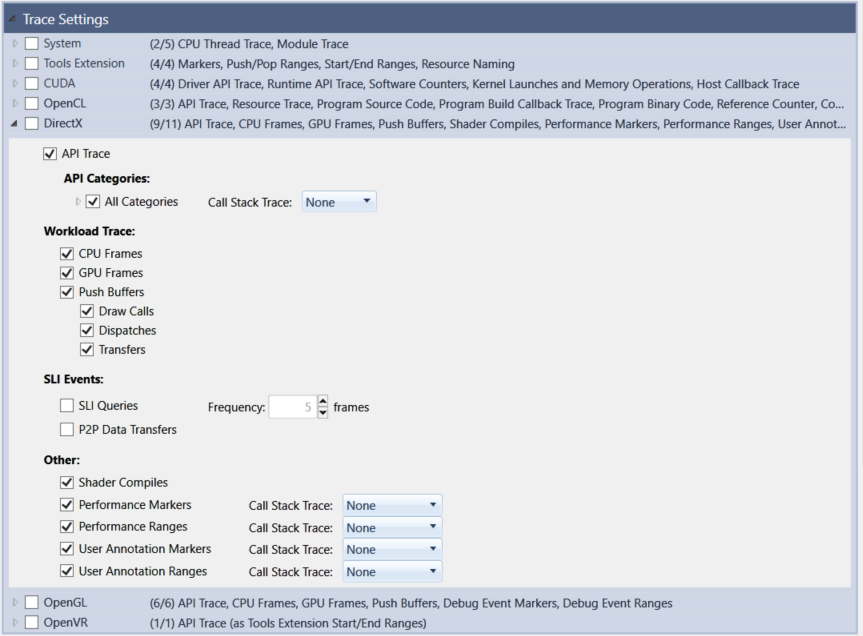
The DirectX option includes the following traces:
-
API Trace — Enables tracing of DirectX API calls. If you select this option and the API Categories sub-option, you can click the call stack trace drop-down option and select None or Always.
-
API Categories — As with the CUDA Driver API Trace, you can select the drop-down menu next to All Categories and customize which call stack trace data you wish to collect.
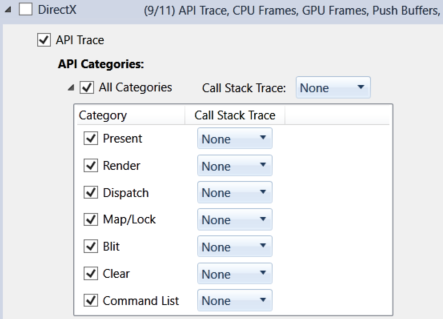
The options here include the following:
-
Present
-
Render
-
Dispatch
-
Map/Lock
-
Blit
-
Clear
-
Command List
-
-
-
Workload Trace
-
CPU Frames — Enables workload tracing of DirectX CPU frames.
-
GPU Frames — Enables workload tracing of DirectX GPU frames.
-
Push Buffers — Enables tracing of DirectX push buffers.
-
Draw Calls — Enables workload tracing of DirectX draw calls.
-
Dispatches — Enables workload tracing of DirectX dispatches.
-
Transfers — Enables workload tracing of DirectX transfers.
-
-
-
SLI Events
-
SLI Queries — Enables collection of statistics about the usage of DirectX queries.
-
P2P Data Transfers — Enables tracing of DirectX data transfers across multiple GPUs.
-
-
Other
-
Shader Compiles — Enables tracing of DirectX shader compile times.
-
Performance Markers — Enables tracing of DirectX performance markers. The call stack trace data option here can be set to None or Always.
-
Performance Ranges — Enables tracing of DirectX performance ranges.The call stack trace data option here can be set to None, Always, On Begin, or On End.
-
4.6. OpenGL
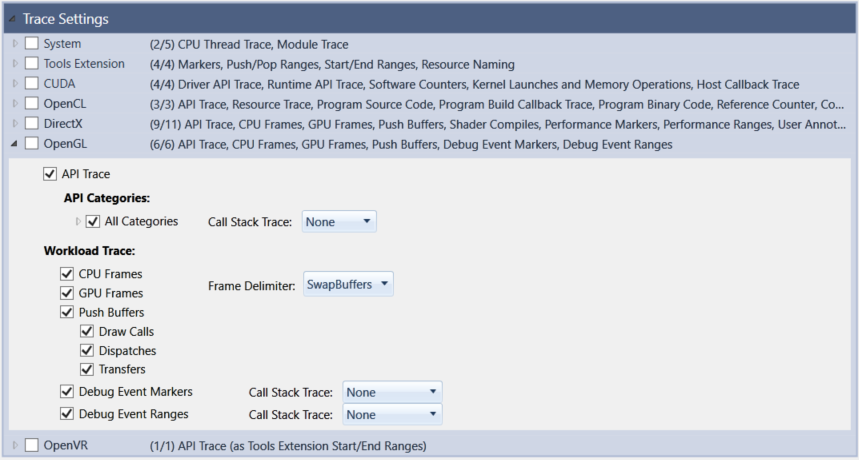
The OpenGL option includes the following traces:
-
API Trace — If you select this option and the API Categories sub-option, you can click the call stack trace drop-down option and select None or Always.
-
API Categories — As with the CUDA and DirectX Driver API Trace, you can also select the drop-down menu next to All Categories and customize which call stack trace data you wish to collect.
The options here include the following:
-
Begin
-
Clear
-
Display List
-
Errors
-
Evaluation
-
Framebuffer Objects
-
Fence
-
Get
-
Light
-
Path
-
Pixel
-
Program
-
Flush
-
Raster
-
State
-
Texture
-
Transform
-
Vertex
-
Vertex Array
-
WGL
-
-
-
Workload Trace
-
CPU Frames — Enables workload tracing of OpenGL CPU frames.
-
GPU Frames — Enables workload tracing of OpenGL GPU frames.
-
Push buffers — Enables tracing of OpenGL push buffers.
-
Draw Calls — Enables workload tracing of OpenGL draw calls.
-
Transfers — Enables workload tracing of OpenGL transfers.
-
-
5. Walkthrough: Collect and Analyze Trace Data
In the following walkthrough, we present some of the more common procedures that you might use to collect the trace data of an application. We use a sample application called Simple Streams as an example. The NVIDIA Nsight Visual Studio Edition software include this sample application.
For the purpose of this walkthrough, we are going to assume that the target application is to be run locally (the NVIDIA Nsight VSE host software running on a machine with Visual Studio, and the Nsight Monitor running on the same machine).
-
Start the Nsight Monitor.
-
On the target machine, click the Windows Start menu.
-
Select All Programs > NVIDIA Corporation > Nsight Visual Studio Edition2020.1 > Nsight Monitor.
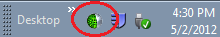
The Nsight Monitor starts. The monitor icon appears in the system tray.
-
-
Start Visual Studio.
-
Open the SimpleStreams sample.
-
In Visual Studio, from the File menu, choose Open Project.
-
Select the sample project through one of two ways:
-
Go to the Nsight menu > Help > Samples.
-
Navigate to the NVIDIA Nsight VSE installation directory and unzip the files from there.
C:\Program Files (x86)\NVIDIA Corporation\Nsight Visual Studio Edition 2020.1\Host\Samples
-
-
Click Open.
-
-
From the Build menu, choose Rebuild.
Projects that use the NVIDIA Nsight VSE tools work best when compiled with the compiler from the CUDA Toolkit located in the \CUDA Toolkit directory that the installer created. However, in general, there is no requirement that the source code of the application you are analyzing be available or compiled with a specific compiler.
The default installation directory for this version of the compiler is:
C:\Program Files (x86)\NVIDIA GPU Computing Toolkit\CUDA
The compiler is in the subdirectory that corresponds to the version of the compiler. For example:
\<version_number>\bin\nvcc.exe
-
From the Nsight menu, choose Start Performance Analysis.
An Activity configuration document opens. The default configuration of the Activity is to run a Trace Application on the target of the current project on the local machine. The Trace Application is also configured to start collecting data when the SimpleStreams process begins, and stop collecting when it ends or is killed.
-
Select the type of trace activity that you want to analyze.
-
Click the Launch button to launch the SimpleStreams application with the Trace Activity enabled.
-
Click the Kill button to stop the application and stop the capture of trace data.
When you perform a Trace Application, NVIDIA Nsight VSE collects events from the target application, and stops collecting data when the launched application exits.
When you perform a Trace Process Tree, NVIDIA Nsight VSE collects events from the target application and all native child processes of the target application. Data capture does not stop when the launched application exits. You must stop the capture manually.
-
NVIDIA Nsight VSE processes the data just captured from the SimpleStreams application, and opens an NVReport document.
-
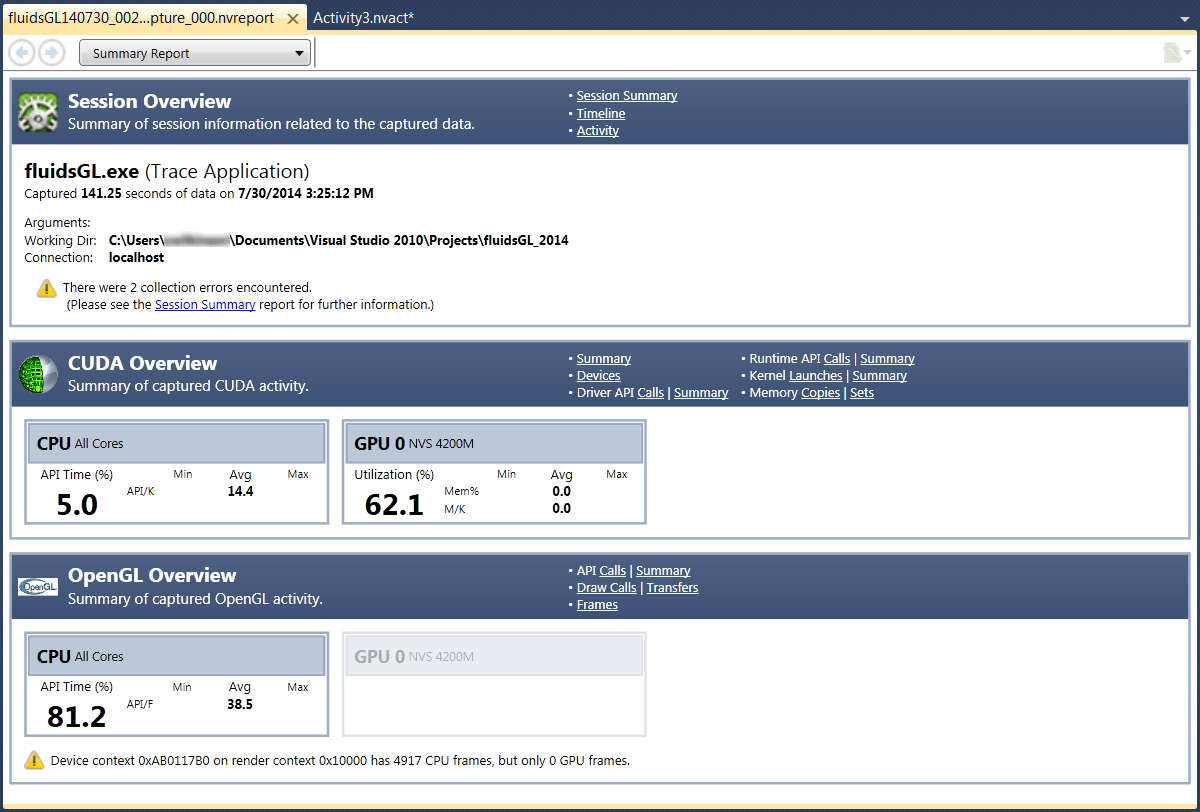
The first page in the NVReport is the Summary page. This page contains a high level summary of the captured data. For more information about the Summary Report, see The Summary Report.
-
The first portion of the report shows information about the capture (process traced, size, time, machine information, etc.).
-
The next portion shows a summary of CUDA-specific information (devices, contexts, and kernels in the system).
-
The remainder of the page shows summaries of other activity that was captured.
-
-
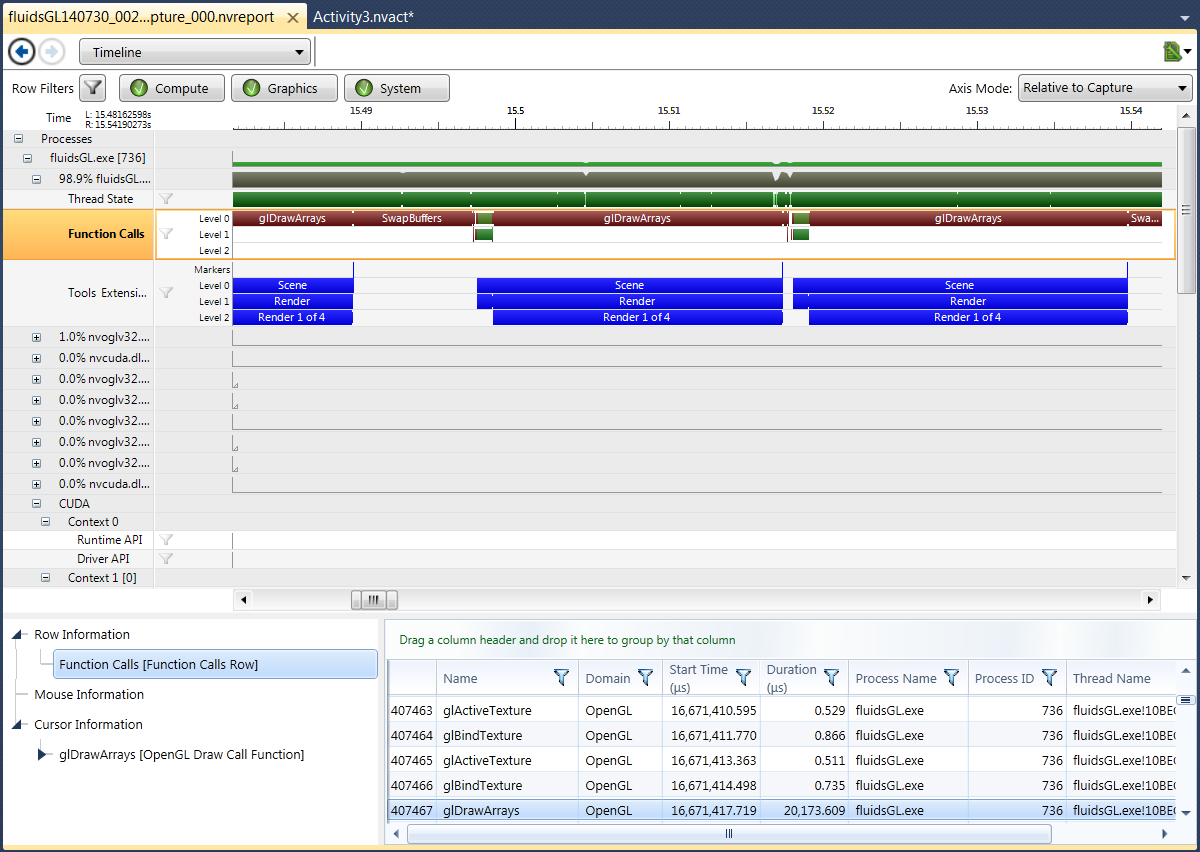
Click the drop-down menu in the navigation bar and select the Timeline Report link. The Timeline Report shows the collected trace data and events. For more information, see The Timeline Report.
-
Zoom into the timeline by pressing the CTRL key and scrolling the mouse-wheel forward. The location of the mouse anchors the center of the zoom.
-
Zoom back out by pressing the CTRL key and scrolling the mouse-wheel backward.
-
To select a specific range of the timeline to zoom, press the Shift key, then left-click and drag the mouse. Start from an event in Context 1, Stream 0 and drag to an event in same row.
-
At this zoomed-in level, it is easier to see specific CUDA API calls, memory transfers, and kernel executions.
-
Examine just the cuLaunch calls in Context 1 Stream 0 by filtering all other API calls out of the current row.
-
Click on the Filter icon on the Driver API row.
-
Set the filter to Name : Contains : cuLaunch : Include.
API calls in this stream which do not contain the string cuLaunch are no longer visible.
-
-
Examine the memory row. Notice that in the first set of API calls, kernel executions of init_array and memory copies happen serially. There is no overlap in time between them. This is because API calls executed on a single CUDA stream execute serially.
NVIDIA GPUs can perform a memory copy and execute a kernel simultaneously. The timeline shows how concurrent kernels and memory copies overlap in time.
The Timeline Report is particularly useful to find and diagnose other situations where memory transfers and kernel computation could be performed in parallel.
Notices
Notice
NVIDIA® Nsight™ Application Development Environment for Heterogeneous Platforms, Visual Studio Edition 2020.1 User GuideSend Feedback
THE INFORMATION IN THIS GUIDE AND ALL OTHER INFORMATION CONTAINED IN NVIDIA DOCUMENTATION REFERENCED IN THIS GUIDE IS PROVIDED “AS IS.” NVIDIA MAKES NO WARRANTIES, EXPRESSED, IMPLIED, STATUTORY, OR OTHERWISE WITH RESPECT TO THE INFORMATION FOR THE PRODUCT, AND EXPRESSLY DISCLAIMS ALL IMPLIED WARRANTIES OF NONINFRINGEMENT, MERCHANTABILITY, AND FITNESS FOR A PARTICULAR PURPOSE. Notwithstanding any damages that customer might incur for any reason whatsoever, NVIDIA’s aggregate and cumulative liability towards customer for the product described in this guide shall be limited in accordance with the NVIDIA terms and conditions of sale for the product.
THE NVIDIA PRODUCT DESCRIBED IN THIS GUIDE IS NOT FAULT TOLERANT AND IS NOT DESIGNED, MANUFACTURED OR INTENDED FOR USE IN CONNECTION WITH THE DESIGN, CONSTRUCTION, MAINTENANCE, AND/OR OPERATION OF ANY SYSTEM WHERE THE USE OR A FAILURE OF SUCH SYSTEM COULD RESULT IN A SITUATION THAT THREATENS THE SAFETY OF HUMAN LIFE OR SEVERE PHYSICAL HARM OR PROPERTY DAMAGE (INCLUDING, FOR EXAMPLE, USE IN CONNECTION WITH ANY NUCLEAR, AVIONICS, LIFE SUPPORT OR OTHER LIFE CRITICAL APPLICATION). NVIDIA EXPRESSLY DISCLAIMS ANY EXPRESS OR IMPLIED WARRANTY OF FITNESS FOR SUCH HIGH RISK USES. NVIDIA SHALL NOT BE LIABLE TO CUSTOMER OR ANY THIRD PARTY, IN WHOLE OR IN PART, FOR ANY CLAIMS OR DAMAGES ARISING FROM SUCH HIGH RISK USES.
NVIDIA makes no representation or warranty that the product described in this guide will be suitable for any specified use without further testing or modification. Testing of all parameters of each product is not necessarily performed by NVIDIA. It is customer’s sole responsibility to ensure the product is suitable and fit for the application planned by customer and to do the necessary testing for the application in order to avoid a default of the application or the product. Weaknesses in customer’s product designs may affect the quality and reliability of the NVIDIA product and may result in additional or different conditions and/or requirements beyond those contained in this guide. NVIDIA does not accept any liability related to any default, damage, costs or problem which may be based on or attributable to: (i) the use of the NVIDIA product in any manner that is contrary to this guide, or (ii) customer product designs.
Other than the right for customer to use the information in this guide with the product, no other license, either expressed or implied, is hereby granted by NVIDIA under this guide. Reproduction of information in this guide is permissible only if reproduction is approved by NVIDIA in writing, is reproduced without alteration, and is accompanied by all associated conditions, limitations, and notices.
Trademarks
NVIDIA, the NVIDIA logo, and cuBLAS, CUDA, CUDA-GDB, CUDA-MEMCHECK, cuDNN, cuFFT, cuSPARSE, DIGITS, DGX, DGX-1, DGX Station, NVIDIA DRIVE, NVIDIA DRIVE AGX, NVIDIA DRIVE Software, NVIDIA DRIVE OS, NVIDIA Developer Zone (aka "DevZone"), GRID, Jetson, NVIDIA Jetson Nano, NVIDIA Jetson AGX Xavier, NVIDIA Jetson TX2, NVIDIA Jetson TX2i, NVIDIA Jetson TX1, NVIDIA Jetson TK1, Kepler, NGX, NVIDIA GPU Cloud, Maxwell, Multimedia API, NCCL, NVIDIA Nsight Compute, NVIDIA Nsight Eclipse Edition, NVIDIA Nsight Graphics, NVIDIA Nsight Integration, NVIDIA Nsight Systems, NVIDIA Nsight Visual Studio Edition, NVLink, nvprof, Pascal, NVIDIA SDK Manager, Tegra, TensorRT, Tesla, Visual Profiler, VisionWorks and Volta are trademarks and/or registered trademarks of NVIDIA Corporation in the United States and other countries. Other company and product names may be trademarks of the respective companies with which they are associated.