Advanced Topics
Advanced topics for working with the NVIDIA Nsight VSE CUDA Debugger.
In this section, learn more about advanced CUDA topics, such as PTX and SASS assembly debugging, how to use the CUDA Memory Checker, and restrictions when debugging OptiX applications.
PTX and SASS Assembly Debugging
PTX is a low-level parallel-thread execution virtual machine and instruction set architecture (ISA). PTX exposes the GPU as a parallel computing device.
In addition, PTX provides a stable programming model and instruction set for general purpose parallel programming, and is designed to be efficient on NVIDIA GPUs. High-level language compilers for languages such as CUDA and C/C++ generate PTX instructions, which are optimized for and translated to native target-architecture instructions.
SASS is the low-level assembly language that compiles to binary microcode, which executes natively on NVIDIA GPU hardware.
As of NVIDIA Nsight Visual Studio Edition 6.0, PTX and SASS assembly debugging is now available. To utilize this feature, use the following tutorial.
Note
The CUDA Debugger has a number of restrictions when debugging OptiX Applications.
See Restrictions When Debugging OptiX Applications and CUDA Debugger > Disasm
To Enable PTX/SASS Assembly Debugging
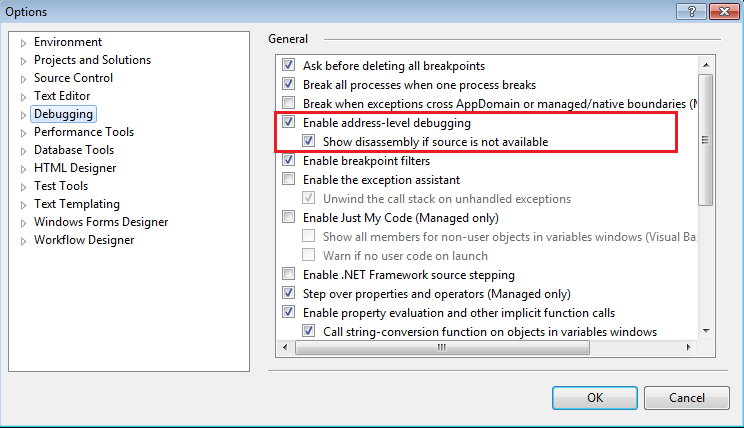
In Visual Studio, go to Tools > Options > Debugging.
Select both Enable Address Level Debugging, as well as the sub-option, Show disassembly if source is not available.
Note
Currently, this only works with CUDA applications that have debug symbolics (i.e., that are built with
-G). PTX disassembly views will be blank if the application is not built with debug symbolics (-G).In addition, this displays only one CUDA function for the current stopped kernel. The user cannot scroll to other CUDA kernels in the module.
Once the CUDA Debugger is stopped, you can open the Visual Studio Disassembly document through one of the following methods:
The Visual Studio source view’s Go to Disassembly command.
The call stack’s Go to Disassembly command.
The breakpoint view’s Go to Disassembly command.
Using the Visual Studio menu Debug > Windows > Disassembly.
Note
This can only work when stopped in a CUDA kernel via a breakpoint. There is no static or offline disassembly in the Visual Studio disassembly view.
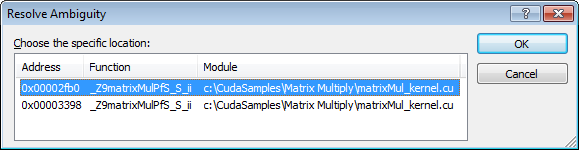
When going to disassembly, there may be multiple associated addresses. In this case, Visual Studio will pop up a dialog asking you to choose which address you want to view.
The Visual Studio options that are supported in the disassembly document window include the following:
Show Source Code;
Show Code Bytes;
Show Line Numbers;
Show Toolbar;
Show Address.
Note
Note that the Show Symbols option is currently not supported.
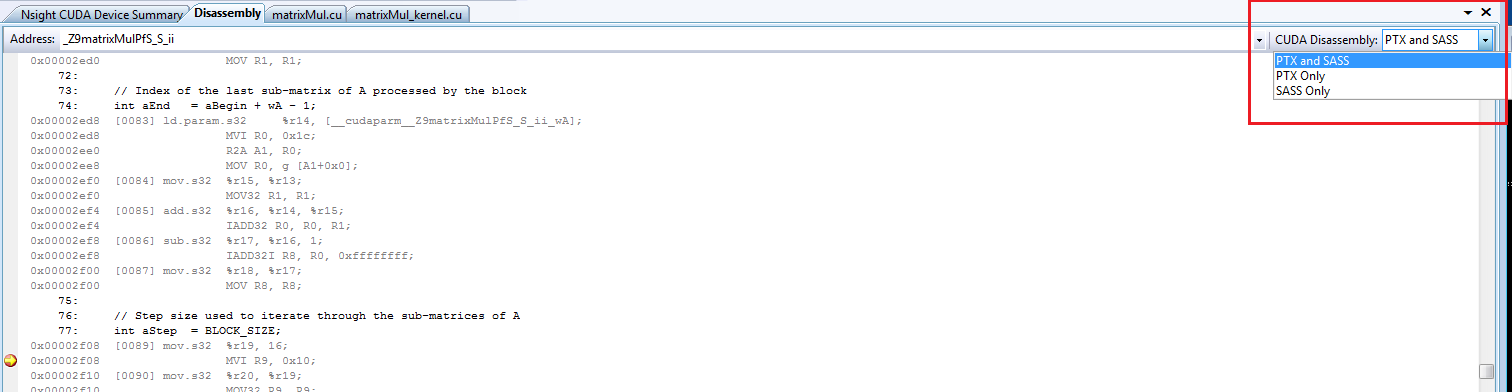
You can choose to view the CUDA disassembly as PTX, SASS, or a PTX and SASS combination. This is located in the top-right of the Visual Studio Disassembly view, and controls which disassembly is shown.
Note
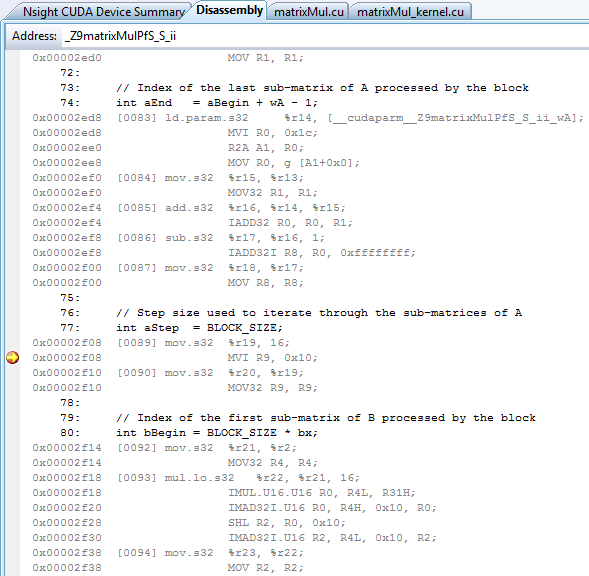
The number in brackets [0090] in the Visual Studio Disassembly View is the PTX line number.
Address Breakpoints
With the CUDA Debugger PTX and SASS assembly debugging feature, address breakpoints are supported. Standard Visual Studio controls for adding and removing breakpoints can be seen in the breakpoint column of the disassembly.
A few items to note with address breakpoints:
Visual Studio disables address breakpoints after each debug session.
These breakpoints may use any of the advanced breakpoint conditionals.
Some instructions are not able to be patched (i.e., breakpoints cannot be set on them). When this happens, the breakpoint will be moved to the previous patchable breakpoint instruction.
The address of a source breakpoint can be seen in the Address column of the Visual Studio breakpoint’s view.
The address breakpoints are always set at a SASS address.
Run Control
When using run control with the CUDA Debugger PTX and SASS assembly debugging, stepping in / out / over all work normally as expected. This follows the Visual Studio Source, Statement, and Instruction control. Stepping in the last line of a kernel will continue the program.
When stepping instructions (which is the default for disassembly) and SASS is showing, the CUDA Debugger will always step at the SASS level.
PTX > Steps only PTX instructions.
SASS > Steps only SASS instructions.
PTX + SASS > Also steps SASS instructions.
Note
Note that there is no control for stepping PTX when SASS is showing.
Additional information on PTX can be found in the CUDA documentation:
NVIDIA GPU Computing Toolkit installation path\CUDA\<version number>\doc\
Registers View
The Visual Studio Debugger > Windows > Registers can be configured to display CPU, SASS, and PTX registers by right-mouse clicking on the view and selecting the desired set of registers.
SASS — shows GPU registers.
PTX — shows PTX registers, assuming the application is built with debug symbolics.
PTX loc — shows in-scope GPU PTX registers, assuming the application is built with debug symbolics.
Note
The Debugger also provides a formatted, customizable registers view via Nsight > Windows > GPU Registers.
For more information, see the CUDA Debugger registers view, and how to evaluate the value of an expression.
Restrictions When Debugging OptiX Applications
Overview
When using the OptiX SDK to develop applications, certain framework libraries are considered proprietary and have debugging and profiling tool restrictions. For many NVIDIA tools, call stacks that involve these libraries are completely restricted. Certain NVIDIA tools provide some visibility into user code using the framework libraries. These include:
Nsight Visual Studio Edition’s CUDA Debugger
Nsight Compute Profiler
cuda-gdb debugger
Restrictions for NVIDIA Nsight Visual Studio Edition
General
By default, OptiX applications are built with -lineinfo, which optimizes SASS, typically for profiling. The -lineinfo option does not match exactly to the source, so stepping behavior is not what you get with -G, typically for debugging. Optimized SASS makes source stepping and source breakpoint setting haphazard at best. As such, it is recommended that you set breakpoints and step in SASS disassembly as much as possible.
Call stack and GPU state information may be restricted to user code. OptiX Library portions of the call stack will be labeled as [NVIDIA Internal], and state information for these portions of the stack will be restricted.
Breakpoints
Breakpoints may only be set in unrestricted OptiX module code and user code. More specifically:
Function Breakpoints
Function breakpoints in user code work the same as in other CUDA applications.
Function breakpoints in restricted OptiX internal code will not resolve. For example, if you use
.*the debugger will only resolve breakpoints in user and unrestricted OptiX functions.
Source Breakpoints
OptiX code is typically optimized. This can result in source breakpoints being resolved to multiple locations. Correspondingly, the breakpoint’s view may show multiple child instances for a given breakpoint. As such, it is recommended that you set breakpoints and step in SASS disassembly as much as possible.
SASS Breakpoints
For the most part, SASS breakpoints work as expected, aside from one exception: Visual Studio saves SASS breakpoints with an absolute address, so the address may be different between sessions. (They are not Function + offset, which would relocate correctly.)
PTX Breakpoints
PTX breakpoints work the same as in other CUDA applications.
Break on Activity
Break on Launch
Launch function internal breakpoints cannot be set in restricted OptiX internal code. Therefore, the Break on Launch functionality cannot be used to break on Optix callbacks to user code.
Disasm
Restrictions:
The Disassembly view will not show restricted OptiX module code.
Stepping into restricted OptiX code will not be permitted.
No restricted functions or their file names will be displayed when scrolling or otherwise changing the view’s disassembly location.
The following only applies to unrestricted OptiX framework library code and user code, with the above exceptions:
SASS may be displayed and stepped normally.
PTX, if present, may be displayed and stepped normally.
OptiX unrestricted code may be shown as
/generated/generated.A dialog may appear the first time the debugger is looking for the OptiX
/generated/generatedfile. Canceling the dialog will ensure it does not display anymore.Corresponding file names will also be shown.
Call Stack
Shows [NVIDIA Internal] for restricted OptiX functions.
Multiple restricted functions may be collapsed into one [NVIDIA internal] frame.
[NVIDIA Internal] frames have no source or disasm, and other restricted state information.
User code below and between [NVIDIA Internal] frames may be viewed and inspected normally, except some registers may be incorrect.
Note that this is not possible with cuda-gdb.
User code above the topmost [NVIDIA internal] frame may be viewed and inspected normally.
Modules
Restricted modules will be displayed as:
[CUDA]<module handle>
User and unrestricted modules are displayed the same as in other CUDA applications.
Run Control
Disassembly stepping behaves the same as other CUDA applications.
OptiX code is typically optimized. This can result in erratic source stepping. As such, it is recommended that you set breakpoints and step in SASS disassembly as much as possible.
Autos
Automatic variable state is unsupported when the call stack involves [NVIDIA Internal] frames.
Locals
Local variable state view only shows the launch information when the call stack involves [NVIDIA Internal] frames.
Watch
Watch variables do not show up when the call stack involves [NVIDIA Internal] frames.
PTX registers (e.g., %r279 or %r515) will not resolve due to missing device debug info (
-G) and will display the following message:Unable to evaluate the expression.
Memory
Memory view has the same behavior as in other CUDA applications.
GPU Registers (Visual Studio and GPU Registers View)
The Registers view has the same behavior as in other CUDA applications above the topmost [NVIDIA Internal] call stack frame, but register values are not reliable below.
Restrictions:
PTX registers do not display due to missing device debug info (
-G).
Warp Info
The Warp Info view has the same behavior as in other CUDA applications.
Lane Info
The Lane Info view has the same behavior as in other CUDA applications.
Symbolics
By default, OptiX framework modules do not have symbolics.
API Trace
API Trace information that involve restricted OptiX library functions are completely restricted.
Notices
Notice
ALL NVIDIA DESIGN SPECIFICATIONS, REFERENCE BOARDS, FILES, DRAWINGS, DIAGNOSTICS, LISTS, AND OTHER DOCUMENTS (TOGETHER AND SEPARATELY, “MATERIALS”) ARE BEING PROVIDED “AS IS.” NVIDIA MAKES NO WARRANTIES, EXPRESSED, IMPLIED, STATUTORY, OR OTHERWISE WITH RESPECT TO THE MATERIALS, AND EXPRESSLY DISCLAIMS ALL IMPLIED WARRANTIES OF NONINFRINGEMENT, MERCHANTABILITY, AND FITNESS FOR A PARTICULAR PURPOSE.
Information furnished is believed to be accurate and reliable. However, NVIDIA Corporation assumes no responsibility for the consequences of use of such information or for any infringement of patents or other rights of third parties that may result from its use. No license is granted by implication of otherwise under any patent rights of NVIDIA Corporation. Specifications mentioned in this publication are subject to change without notice. This publication supersedes and replaces all other information previously supplied. NVIDIA Corporation products are not authorized as critical components in life support devices or systems without express written approval of NVIDIA Corporation.
Trademarks
NVIDIA and the NVIDIA logo are trademarks or registered trademarks of NVIDIA Corporation in the U.S. and other countries. Other company and product names may be trademarks of the respective companies with which they are associated.