Inspect State
Inspect State
In this section, learn more about how to use various state inspection features of the CUDA Debugger, such as specifying the debugger context, viewing memory and variables, using the CUDA Info View, and using the CUDA Warp Watch.
Which Thread Has Focus?
Consider how threads grab focus in the CUDA Debugger. For example, the debugger can change focus to another thread without notifying you. If the focus thread is not at a breakpoint and a different thread hits a breakpoint, the CUDA Debugger changes the current focus thread.
For example, if stopped in block (0,0,0) and thread (0,0,0) and a breakpoint hits in block (1,0,0) thread (0,0,0), the debugger will switch to the new thread. The debugger does not switch the focus thread when stepping, since the other threads are frozen.
How To: View Memory
The NVIDIA Nsight™ VSE CUDA Debugger supports the Visual Studio Memory window for examining the contents of memory on a GPU. The CUDA Debugger supports viewing shared, local, and global memory on the current state of CUDA within the process that is being debugged.
While the Debugger also supports memory viewing while CPU debugging, this section only discusses GPU memory. To view GPU memory while at a CPU breakpoint or exception, you must change the thread focus to a CUDA Thread. If no GPU thread is running, the Source window will show Code not running.
You can view values in GPU memory only when running a CUDA application, with the target application halted at a breakpoint in CUDA source code. Keep the following in mind:
Shared Memory:
Is accessible by any thread of the block from which it was created.
Has the lifetime of the block.
Local Memory:
Is only accessible by the thread.
Has the lifetime of the thread.
Global Memory:
Is accessible from either the host or the device.
Has the lifetime of the application.
View the Contents of GPU Memory
To View the Contents of Global Memory
From the Debug menu, choose Windows > Memory.
Select one of the Memory windows. The Memory window opens or grabs focus if already opened.
In the Address field of the Memory window, type the GPU memory address you want to see.
Type either the hexadecimal value or the name of a valid pointer that is in the current lexical scope.
Press the Enter key. The Memory window shows the contents of memory beginning with the specified address.
Note
Tip: Right-click on the Memory window to change the way memory contents are displayed, including displaying memory contents as floating-point numbers.
From the Debug menu, choose Windows > Memory.
Select one of the Memory windows. The Memory window opens or grabs focus if already opened.
In the Address field of the Memory window, type the GPU memory address for the shared memory location to display.
Make sure to cast the pointer to a pointer in Shared memory by using the following syntax:
(__shared__ float*)p
Right-click on the Memory window to see display options.
Note
The following examples show the syntax used to cast a pointer/address to a different memory space.
Shared:
(__shared__ int*)0x00Local:
(__local__ int*)0Global:
(__device__ int*)0x2001b000
NOTE: You cannot change the value in GPU memory by editing the value in the Memory window.
View Variables in Locals Window in Memory
Start the CUDA Debugger.
From the Nsight menu in Visual Studio, choose
Start CUDA Debugging
For information on choosing the correct debugger for your system configuration see the System Requirements page.
Alternatively, these debugging sessions may be started by:
Right-click on the project in Solution Explorer and select the Debug submenu.
Click on the associated icon in the Nsight CUDA Debug toolbar.
Pause execution or allow the application to run to a breakpoint, or set a breakpoint if none enabled.
From the Debug menu, choose Windows > Memory > Memory Window 1.
The Memory window opens.
Click and drag a variable from the Locals window onto the Memory window.
The Memory window displays the values at the addresses that correspond to the variable (or pointer).
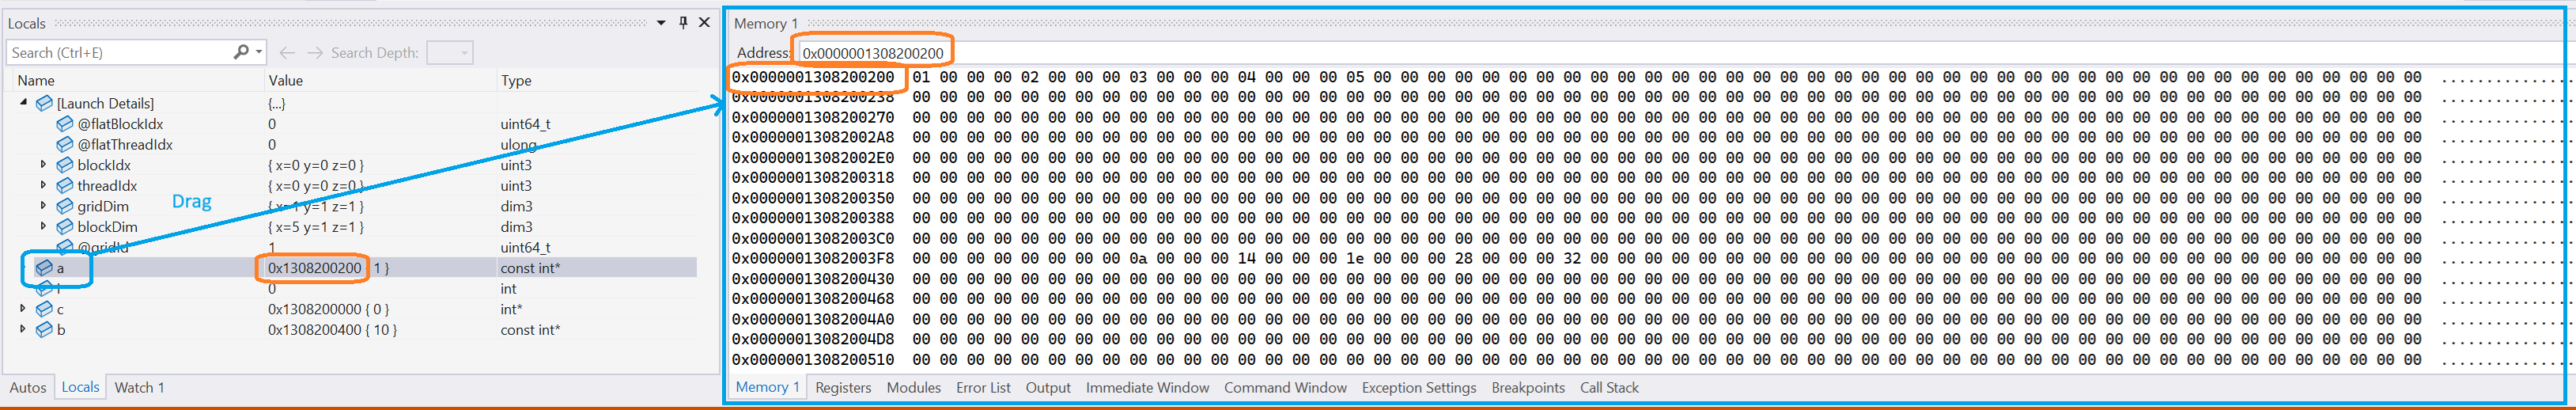
Alternately, you can type the name of the variable into the Address field of the Memory window.
When viewing memory in
__local__,__const__or__shared__make sure the Visual Studio Memory view is set to Re-evaluate automatically. This will ensure that the memory shown is for the correct memory space. Without this, the display can change to an address which defaults to global memory.
NOTE: You cannot change the value in GPU memory by editing the value in the Locals window.
View Variables in Watch Window in Memory
Start the CUDA Debugger.
From the Nsight menu in Visual Studio, choose
Start CUDA Debugging
For information on choosing the correct debugger for your system configuration see the System Requirements page.
Alternatively, these debugging sessions may be started by:
Right-click on the project in Solution Explorer and select the Debug submenu.
Click on the associated icon in the Nsight CUDA Debug toolbar.
Pause execution or allow the application to run to a breakpoint (or set a breakpoint if none are enabled).
From the Debug menu, choose Windows > Watch.
Select one of the Watch windows. The Watch window opens or grabs focus if already opened.
Click and drag a variable from the Watch window onto the Memory window. The memory window displays the values at the addresses that correspond to the variable (or pointer).
How To: View Variables
NVIDIA Nsight™ VSE supports the standard Visual Studio Locals window for examining the value of local variables in CUDA source code, and the Watch window for interactively evaluating expressions.
The information in the Locals window and Watch window are available in the CUDA Debugger only when:
A CUDA-based application is running, and
Application execution is halted while executing CUDA source code.
When not restricted by a private/internal library. As an example, see OptiX restrictions, especially as they apply to viewing variables.
View the Value of a Local Variable
Start a debugging session.
In Visual Studio, open a CUDA-based project.
Define at least one breakpoint.
From the Nsight menu, choose
Start CUDA Debugging
For information on choosing the correct debugger for your system configuration see the System Requirements page.
Alternatively, these debugging sessions may be started by:
Right-click on the project in Solution Explorer and select the Debug submenu.
Click on the associated icon in the Nsight CUDA Debug toolbar.
Your applications starts and the CUDA Debugger launches, stopping at the first breakpoint encountered.
Pause execution or allow the application to run to a breakpoint, or set a breakpoint if none enabled.
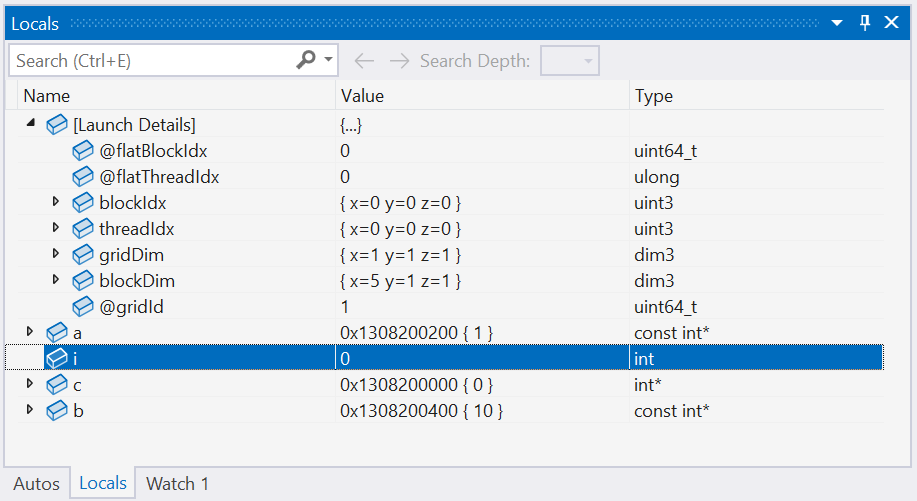
From the Debug menu, choose Windows > Locals. The Locals window opens.
The Locals window shows the list of variables, their assigned values, and type in the current lexical scope.
Note
The block and thread indices are exposed in the blockDim and the threadIdx variables.
Note
Variables that have not yet been initialized show triple question marks as their value: ???
Evaluate the Value of an Expression
From the Debug menu, choose Windows > Watch > Watch1 to open or focus the Watch window.
Left-click on the expression portion of the window.
Type any valid expression recognized by the debugger. The expression can contain any variable valid at the current execution location.
Press the Enter key.
The CUDA Debugger evaluates the expression displayed in the Name column, and places the result in the Value column.
If the expression refers to a variable that is not valid at the current execution location, the expression value displays an error message.
If the expression is a variable, you can edit the value in this column to change the contents of the variable. You cannot edit the value of const variables. The right column of the Watch window shows the value to which the expression evaluates.
Note
The CUDA Debugger supports a significant percentage of C++ expression syntax, including:
Bitwise and Logical Operators:
&, |, ^, &&, ||, <<, >>Arithmetic Operators:
+, -, *, /Pointer Arithmetic: For example:
p+4,p[4]Casting:
(int *)p, (float4*)p, (__shared float4*)p
Note
To use a register in the variable Watch Window or in a conditional breakpoint, specify the register a capital R, and the decimal (not hex) register number. For example: R9 or R10.
You may also preface with a $ to differentiate from variables with equivalent names. For example: $R9 or$R10.
You may also hover over a register in the disassembly view to get a tool tip providing the register value.
See also the CUDA Debugger registers view, and the Visual Studio debugger registers view.
Configure Formatting of Expressions
From the Nsight menu, choose Nsight Options.
Select the Debugger group in the left pane of the Nsight Options window.
Mark the options that you want to enable.
State Inspection Views
NVIDIA Nsight Visual Studio Edition 5.5, and later, brings developers unprecedented application development capabilities, combining native Visual Studio CPU and CUDA GPU debugging within the same debugging session. This new debugging architecture extends Nsight’s capabilities to the latest NVidia GPUs, while providing a seamless, homogeneous debugging experience on GPU kernels and native CPU code.
The CUDA Debugger provides a number of independent tool windows to inspect the target application’s state.
Note
Some Legacy CUDA Debugger features, older GPUs, drivers, and OSs may not be supported. Please refer to the system requirements to determine if the latest version fits your needs.
To View the CUDA Information Tool Windows:
Launch the CUDA Debugger.
Open a CUDA-based project.
From the Nsight menu, select Start CUDA Debugging. Or you can use one of the following alternate methods:
Right-click on the project in Solution Explorer and choose Debug > Start CUDA Debugging
Nsight CUDA Debugging toolbar > Start CUDA Debugging
The CUDA Debugger starts and launches the target application.
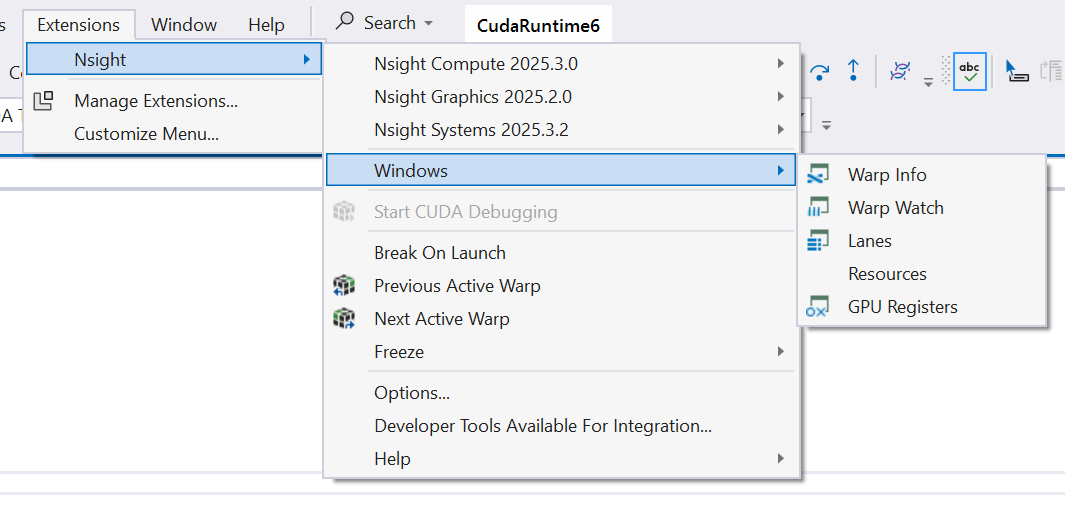
From the Nsight menu, choose Windows to select a supported tool that will allow you to inspect the state of the target application (Warp Info, Lanes, Warp Watch, Resources, or GPU Registers).
General Features of the CUDA Tool Windows
Filtering Results
There are two modes that can be used to create filters:
JavaScript Mode — Create JavaScript expressions using the exact name of the column, including spaces, in the format
$("Column Name"). Typing'$'will produce a list that can be used to select a pre-formatted column name.$('Grid ID') == 2 || $('BP Hit Mask') == 1$('Active Mask') == 80000000$('Active Mask') != "FFFFFFFF" && $('Status') == "Breakpoint")$('Status').match(/breakpoint/i)(function (a, b) { return a.toLowerCase() == b.toLowerCase(); })($("Status"), "breakpoint")RegEx Mode — Create regular expressions to match the (case insensitive) text of the desired row’s cells
^8: filters for rows that have cells with strings beginning with'8'point: filters for rows that have cells with strings containing'point'
Focus
To update the current CUDA thread focus in the Warp Info and Lanes pages, you can use any of the following methods:
Next Warp or Previous Warp commands
These commands are available either from the Nsight menu in Visual Studio, or from the Nsight toolbar.
Using Set Focus in the Warp page
This is available by double-clicking on the thread (lane of a warp).
Using Set Focus in the Lanes page
This is available by double-clicking on the thread (lane of a warp).
CUDA Debugger Tool Windows
There are several pages within this tool window that allow you to view different aspects of your CUDA application that is being debugged.
The CUDA Information tool window pages include the following:
Warp Info
The Warp Info page displays all active warps on the GPU. Each row represents one warp, and the Threads column displays information about all lanes (sub-columns) for each of the warps (rows) in the view. A lane is a single thread in one warp. The Threads column gives per-lane details about any warp exceptions; the current state is shown in the Threads column.
Focus
The current focus is denoted by a yellow arrow in the Threads column.
Thread focus can be manually changed using one of the methods outlined in the Focus section.
Focus changes affect the position of the yellow arrow with respect to Warp row and Thread column thread. Other columns are unaffected by focus changes.
Changing the Warp or Lane focus, will also update other views (i.e., Locals, Watch, Callstack, …).
The user can switch to either active or inactive lanes; however, the focus cannot be changed to Not Launched lanes.
The user can freeze specific warps within the warps page itself. This set of frozen warps is managed separately from the global freeze control. Freezing warps 1, 2, and 3, and then toggling the global freeze state will leave those warps frozen. (See How To: Use the Global Freeze Page for more details.)
Note
Frozen warp rows are not disabled and there is no Frozen column. This indicator will be added in a future version.

The color legend for the Threads column is as follows:
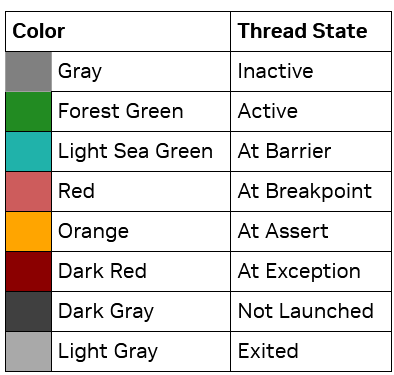
For more information on the Warps page, see the Example Scenarios of the CUDA Warp Watch section.
Warp Watch
The Warp Watch page displays information about the current state of watched variables in all warps.
For more information, see the Warp Watch documentation.
Lanes
The Lanes page displays information about all lanes in the current focus warp. A lane is a single thread in one warp.
The current state of the lane is shown as a barrier in the Status column.
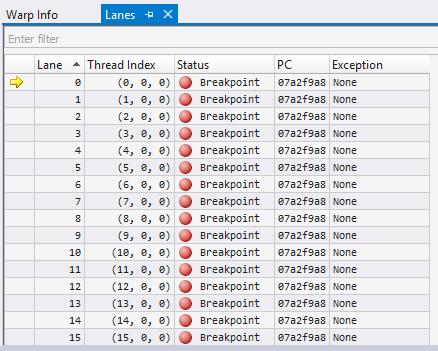
Focus
The current focus is denoted by a yellow arrow in the first column.
Thread focus, and therefore lane focus, can be manually changed using one of the methods outlined in the Focus section.
Focus changes affect the row position of the yellow.
Changing the Warp or Lane focus, will also update other views (i.e., Locals, Watch, Callstack, …).
The user can switch to either active or inactive lanes; however, the focus cannot be changed to Not Launched lanes.
Resources
The Resources view shows the different aspects of the CUDA application that is being debugged.
Using the drop-down on the top, different views can be selected, where each view is specific to one kind of resource (context, stream, kernel, …). The Filter edit allows you to create filter expressions using the column headers of the currently selected resource.
The resource table shows all information for each resource instance. Resources are dynamically added and are available at both runtime and while the target application is suspended. When a resource is destroyed, it is removed from its table.
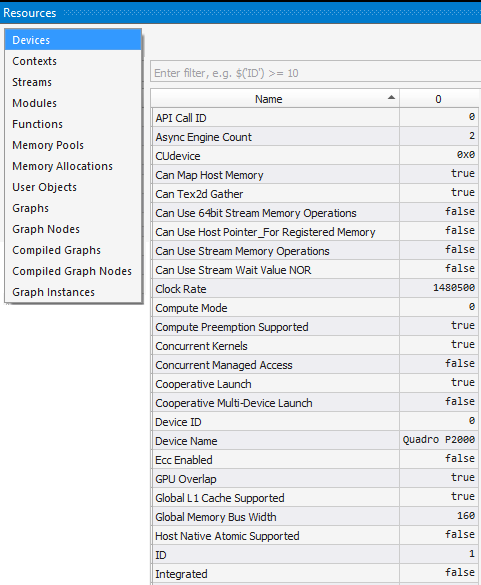
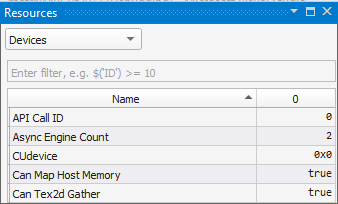
Devices
The Devices setting shows information about the GPU being debugged.
The 1st column represents the ‘Name’ of a device attribute.
The following columns represent the device index after CUDA_VISIBLE_DEVICE device remapping. Device 0 is shown here.
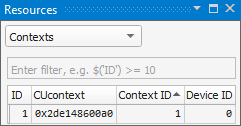
Contexts
The Context setting shows information about all contexts on all GPUs in the process that is currently being debugged. Information on this page is always available, even when the process has not been stopped.
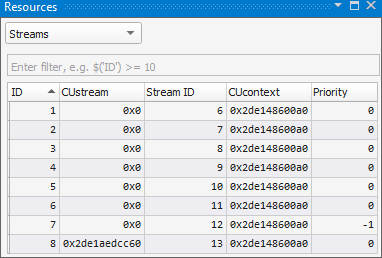
Streams
The Streams setting shows information about concurrent kernel streams, their IDs and priorities.
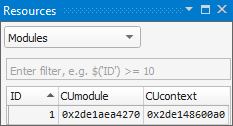
Modules
The Modules setting displays information about all modules in all contexts. The information shown here matches the modules that are seen in the Visual Studio Modules view. Information on this page is always available, even when the process has not been stopped.
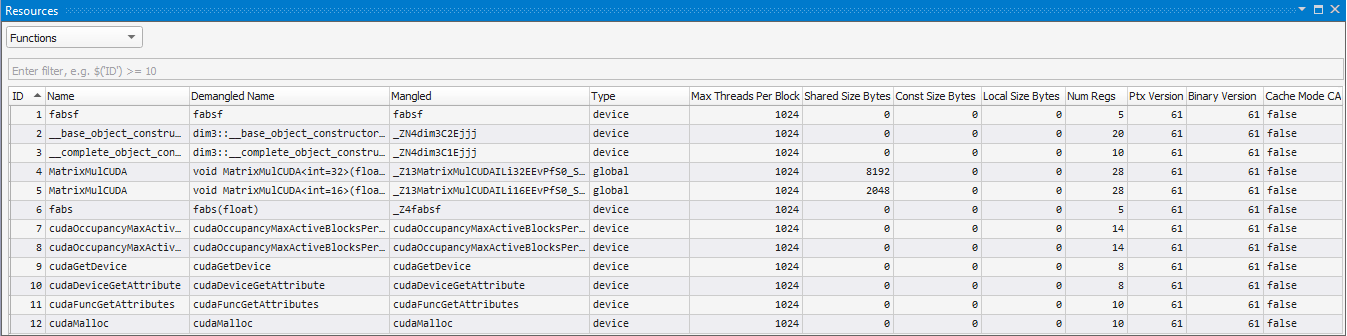
Functions
The Functions setting shows information about all functions in all loaded modules. Information on this page is always available, even when the process has not been stopped.
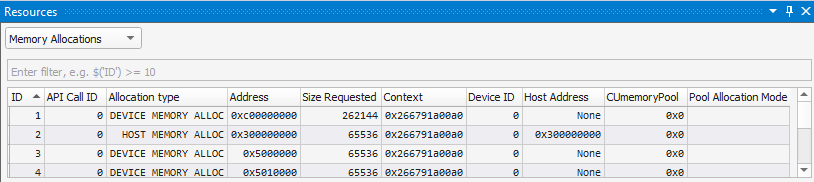
Memory Allocations
This page shows information for all CUDA global memory allocations, in all CUcontexts in the application. This page automatically updates when suspended in a kernel.
Like other pages, the results can be filtered. For example:
$('Context') == 0x23e4c4400a0
$('Allocation type') == "HOST MEMORY ALLOC"  &&  $('Size Requested') > 100
A few columns to note on this page include the following:
Allocation Type — Device or Host.
Device is used when the user includes any device side allocation call (e.g.
cudaMalloc).Host is used for any memory allocated from the host mapped on the device (e.g.,
cudaHostAlloc,cudaHostRegister, or other CUDA API calls).Address — The device side address. For an allocation where the type is “Host,” this device side address may be retrieved from the
Host Addressaddress viacudaHostGetDevicePointer.The
Host Addressis as follows:For Device allocations, this is
None.For Host allocations, this will have the address returned from the
cudaHostAlloc,cudaHostRegister, or other host mapping function.
Context — The context that contains this memory allocation.
CUmemoryPool — Address of the memory pool for this allocation. 0x0 if not using a pool.
Pool Allocation Mode — cudaMemPoolAttr.enumerator used when allocating from a pool
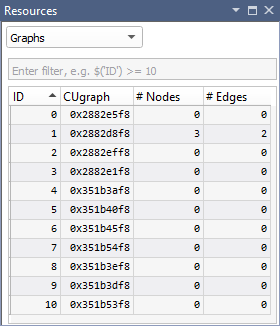
Graphs
The Graphs setting shows CUDA Graph launch information.
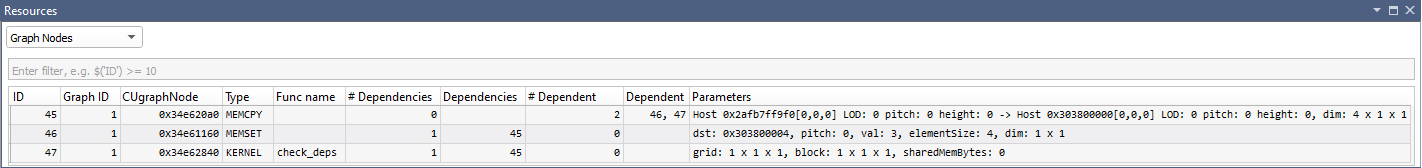
Graph Nodes
The Graph Nodes setting shows Graph Node information for each CUDA Graph launch.
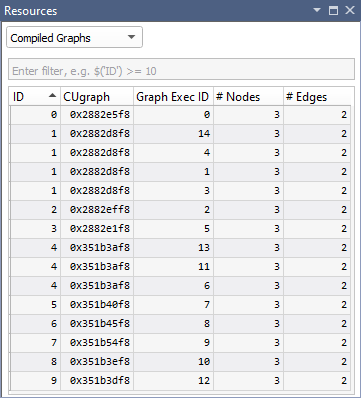
Compiled Graphs
The Compiled Graphs setting shows information on compiled CUDA Graphs launches.
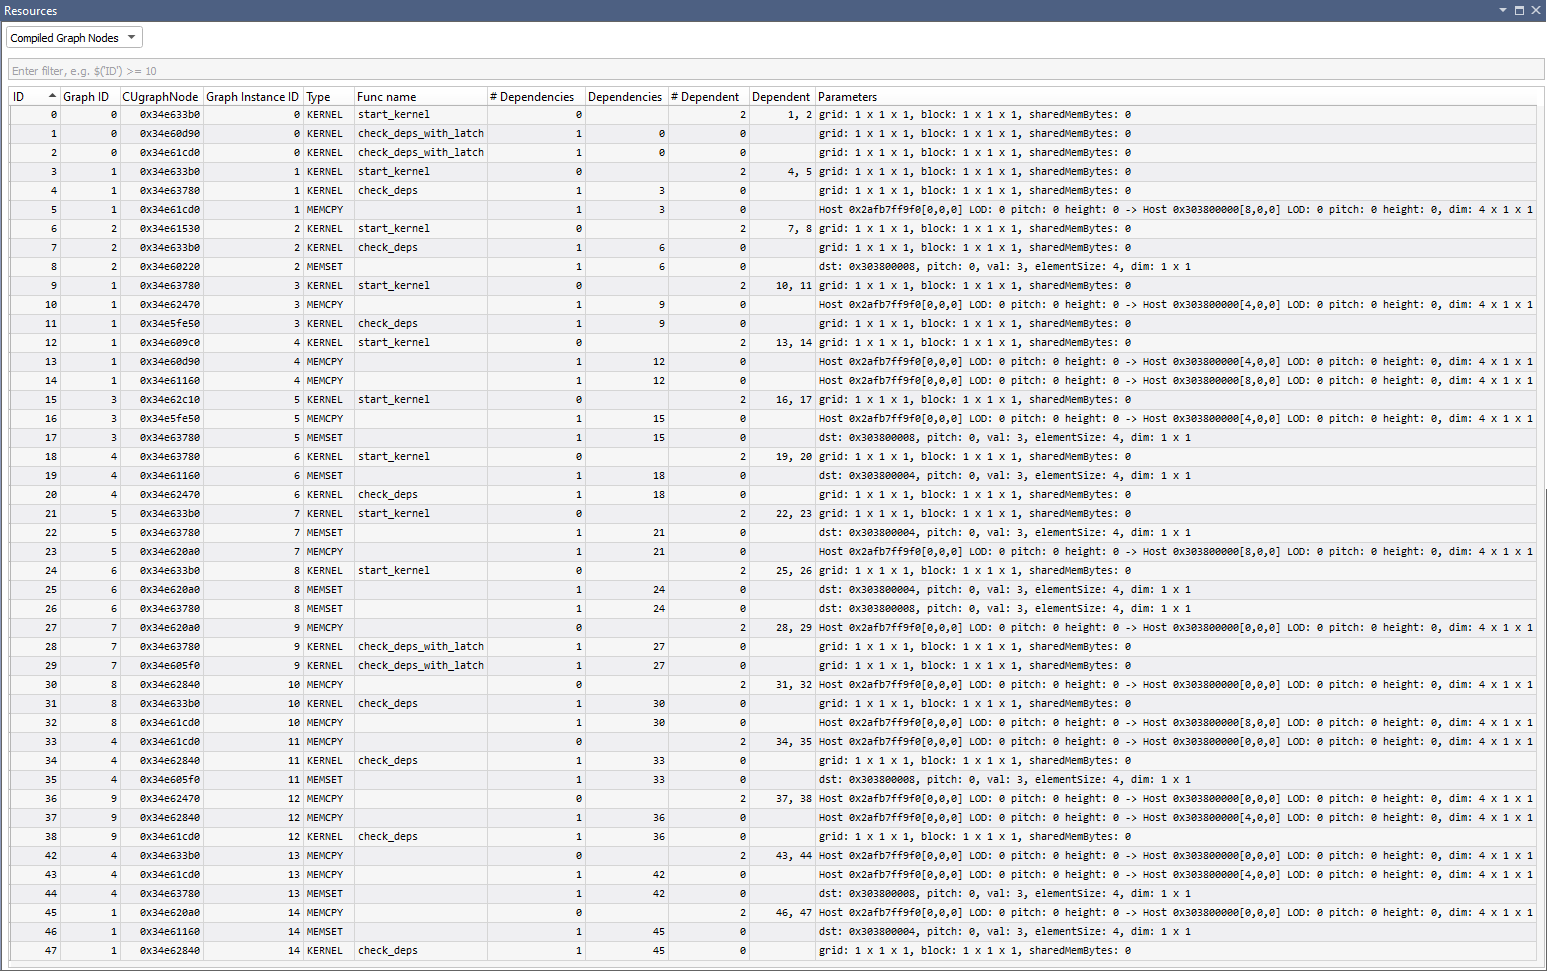
Compiled Graph Nodes
The Compiled Graphs Nodes setting shows Graph Node information for each Compiled CUDA Graph launch.
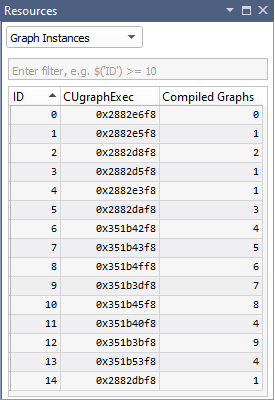
Graph Instances
The Graph Instances setting shows information on each CUDA Graph instance.
Registers
The Registers view shows the current state of the GPU registers. If a value has been changed since the last execution break, the register and its value will appear red.
This view is broken into 5 sections:
SASS — This section shows the shader assembly code registers.
Predicate — These registers show the current predication state for the current thread.
PTX — Shows PTX registers.
PTX loc — Shows in-scope GPU PTX registers.
You can right-click on the Registers view to configure the view, or to copy the contents to the clipboard.
Note
To use a SASS register in the variable Watch Window or in a conditional breakpoint, specify the register a capital R, and the decimal (not hex) register number. For example: R9 or R10.
You may also preface with a $ to differentiate SASS registers from variables with equivalent names. For example: $R9 or$R10.
You may also hover over a SASS register in the disassembly view to get a tool tip providing the register value.
Note
PTX registers and variables may be used in the Watch Window, by prefixing the register or variable with % symbols. For example: %R17. Currently, you cannot use PTX registers for conditional breakpoints.
Note that sometimes PTX registers may span SASS register pairs, as indicated by the following format:
<PTX register double> = <SASS register>,SASS register>)
for example
%rd3 = R6,R7
If the application is not built with the nvcc flag to generate symbolics information for CUDA kernels, (–G), the PTX registers will be blank.|
Note
If debugging on a Turing (compute capability 7.5) or later GPU, you will also be able to Hide/Show ‘Uniform’ and ‘Uniform Predicate’ registers.
Note: To use a Uniform or ‘Uniform Predicate’ register in the variable Watch Window or in a conditional breakpoint, specify the register a capital UR or UP, and the decimal (not hex) register number. For example: UP9 or UR10.
You may also preface with a $ to differentiate Uniform registers from variables with equivalent names. For example: $UP9 or $UR10.
For more information, see the Visual Studio debugger registers view.
CUDA Warp Watch
Visual Studio’s local and global variable tool windows only support viewing a variable in a single thread at a time. The NVIDIA Nsight™ VSE CUDA Debugger uses the current focus thread and stack frame to evaluate these expressions.
To Use the CUDA Debugger Warp Watch Feature:
Begin debugging your project in Visual Studio.
In Visual Studio, open a CUDA-based project.
Define at least one breakpoint.
From the Nsight menu, choose Start CUDA Debugging.
Alternately, this debugging session may be started by:
Right-click on the project in Solution Explorer and select the Debug submenu.
Click on the associated icon in the Nsight CUDA Debug toolbar.
Your application starts, and the CUDA Debugger launches.
Pause execution, allow the application to run to a breakpoint, or set a breakpoint if none were enabled.
From the Nsight menu, choose Windows > Warp Watch.
After selecting, you will be presented with a Warp Watch window, in which users can add their own expressions to watch.
Expressions will be evaluated when the CUDA Debugger stops in a kernel by hitting a breakpoint or exception.
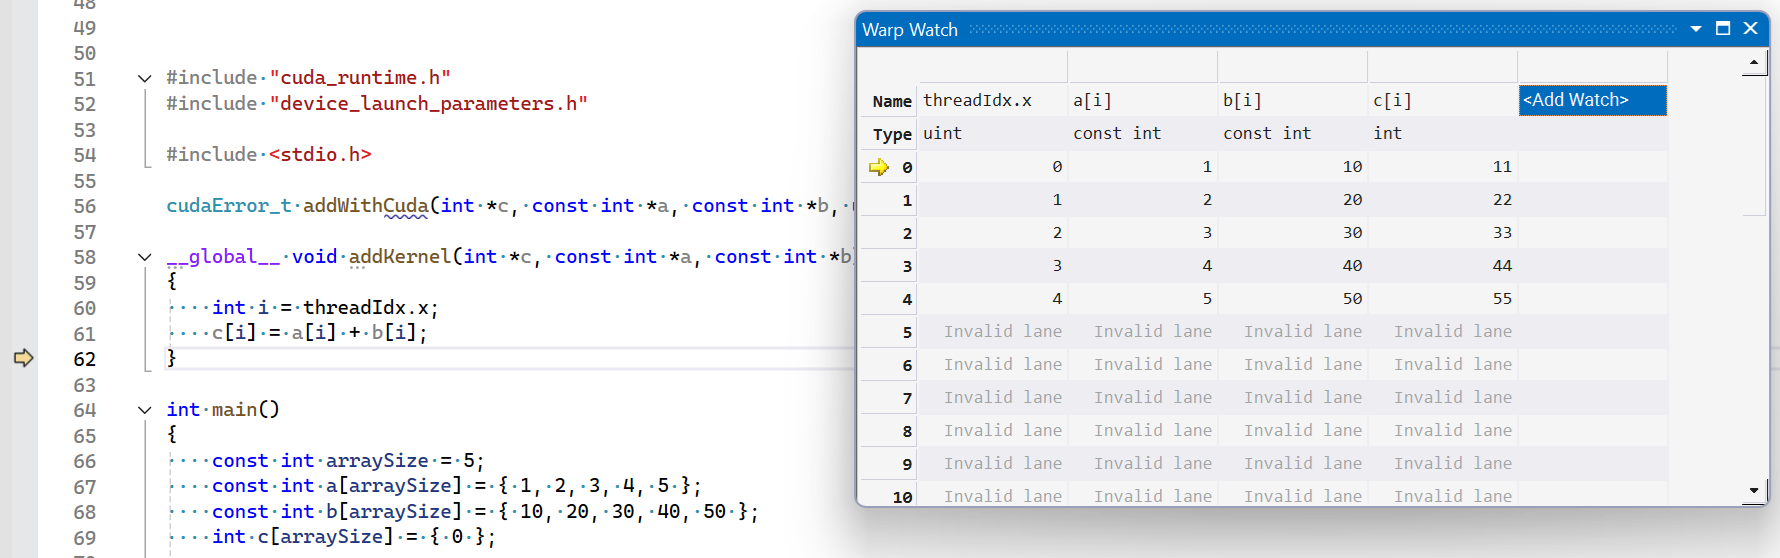
The expressions can be edited from the Warp Watch context menu, by double-clicking on the column header, or by pressing F2.
The CUDA focus can be changed via one of the following methods:
The Warp Info View
The Next / Previous warp commands
A suspend event
The view updates when the current CUDA focus changes, and always shows the warp that contains the current focus thread.
GPU Core Dump Files
NVIDIA Nsight™ VSE supports debugging CUDA GPU core dumps. To use this feature, there are 3 requirements:
The system environment variable
CUDA_ENABLE_COREDUMP_ON_EXCEPTION=1needs to be set.Generate GPU debug information needs to be enabled in the CUDA Project Properties, and the application needs to be compiled with
-Gin the command line arguments.The GPU CUDA Debugger supports the GPU architecture on which the core dump was generated but is limited to Pascal and later GPUs.
If running on WSL, the registry key
>HKEY_LOCAL_MACHINE\SOFTWARE\NVIDIA Corporation\GPUDebugger\EnableInterfacemust be set to(DWORD) 1.
The GPU core dump will be generated as a *.nvcudmp file in the current directory. In Visual Studio, the current directory is set via the project setting: Project Properties > Debugging > Working Directory. Using $(OutDir) will specify the application exectuable directory. Note that the application could also change the working directory. If you are not using NSIGHT_CUDA_DEBUGGER=1 to make a process CUDA-attachable, you can specify a different location and name of the .nvcudmp file using the CUDA_COREDUMP_FILE environment variable, optionally using these format specifiers: %p (PID) ; %h (hostname) ; %t (timestamp).
You can open this generated file (or a core dump file that was previously generated) in Visual Studio, either from the File > Open menu, or by dragging and dropping it into Visual Studio.
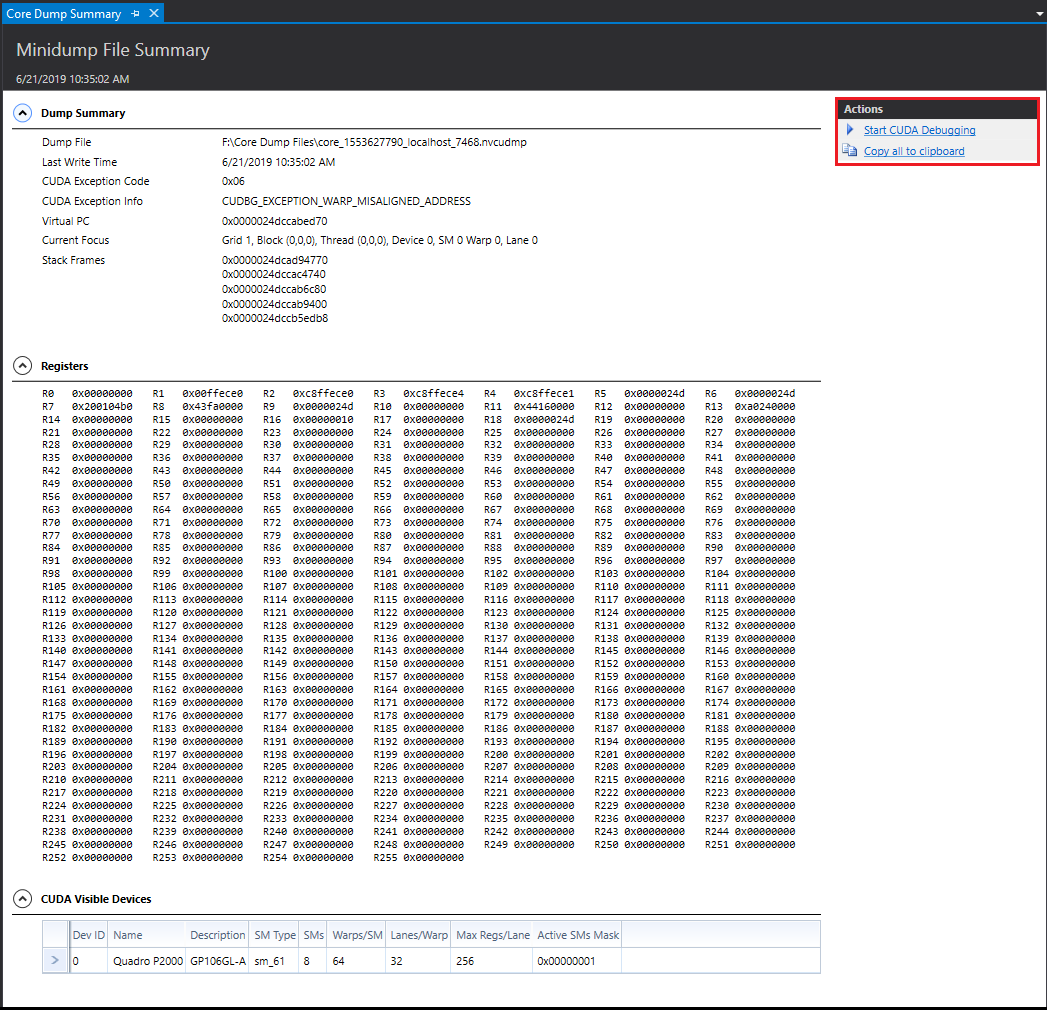
This shows you a read-only view of raw information in three collapsible sections: a dump summary, registers, and visible CUDA devices.
Note
At this time, NVIDIA Nsight™ VSE only supports GPU core dumps; any generated CPU core dump information will be ignored.
From this summary view, you can launch the CUDA Debugger for core dump files generated on Pascal or later GPUs. This will allow you to view CUDA debugging information, which can provide more diagnostic details, such as:
The exception that caused a fatal error.
A list of devices and their info, such as ID, Name, Description, SM, Number of SMs, Number of Warps, Number of Lanes.
The address of the PC.
A list of registers and their values.
Which device, grid, block, warp, and thread the exception hit.
Notices
Notice
ALL NVIDIA DESIGN SPECIFICATIONS, REFERENCE BOARDS, FILES, DRAWINGS, DIAGNOSTICS, LISTS, AND OTHER DOCUMENTS (TOGETHER AND SEPARATELY, “MATERIALS”) ARE BEING PROVIDED “AS IS.” NVIDIA MAKES NO WARRANTIES, EXPRESSED, IMPLIED, STATUTORY, OR OTHERWISE WITH RESPECT TO THE MATERIALS, AND EXPRESSLY DISCLAIMS ALL IMPLIED WARRANTIES OF NONINFRINGEMENT, MERCHANTABILITY, AND FITNESS FOR A PARTICULAR PURPOSE.
Information furnished is believed to be accurate and reliable. However, NVIDIA Corporation assumes no responsibility for the consequences of use of such information or for any infringement of patents or other rights of third parties that may result from its use. No license is granted by implication of otherwise under any patent rights of NVIDIA Corporation. Specifications mentioned in this publication are subject to change without notice. This publication supersedes and replaces all other information previously supplied. NVIDIA Corporation products are not authorized as critical components in life support devices or systems without express written approval of NVIDIA Corporation.
Trademarks
NVIDIA and the NVIDIA logo are trademarks or registered trademarks of NVIDIA Corporation in the U.S. and other countries. Other company and product names may be trademarks of the respective companies with which they are associated.