

Architecture of AIPerf
AIPerf is a modular benchmarking tool for measuring AI inference performance. It generates load against inference endpoints, collects detailed performance metrics, and provides comprehensive analysis of throughput, latency, and resource utilization.
Architecture Overview
AIPerf is designed as a modular, extensible benchmarking framework that separates concerns across three architectural planes. The system scales horizontally as more workers are added while maintaining centralized orchestration.
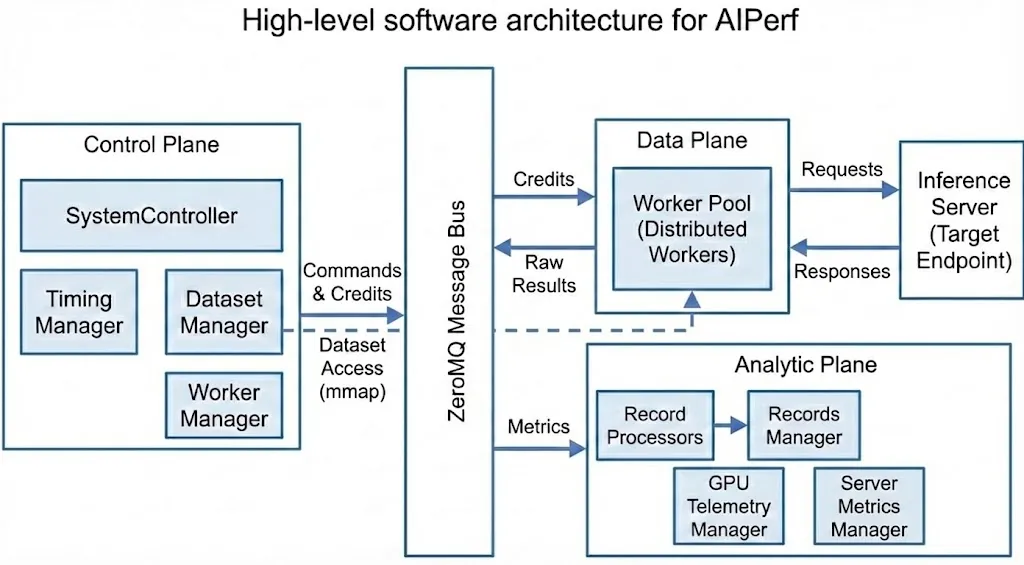
Three-Plane Architecture
Request Lifecycle
- Initialization: Dataset Manager loads data, Timing Manager prepares schedule
- Warmup (optional): Workers send warmup requests to prime JIT, caches, and connection pools. Results are discarded.
- Profiling: Workers receive credits, access data, send requests to inference server
- Collection: Workers capture response timing and content
- Processing: Record Processors compute metrics in parallel
- Aggregation: Records Manager collects and exports results
Core Components
System Controller
The System Controller is the central orchestrator that manages the lifecycle and coordination of all major modules involved in a benchmarking run.
Key Responsibilities:
- Registering and initializing core components
- Orchestrating the start, execution, and shutdown of benchmarking tasks
- Handling configuration, resource allocation, and inter-module communication
- Monitoring the overall progress and health of the benchmarking process
- Managing error handling, cleanup, and graceful termination of all modules
Result-producing services register their result domains with the System Controller. Shutdown begins only after profiling has started and every registered domain has either completed or been evicted after a confirmed service failure. This lifecycle gate prevents an empty startup barrier from being mistaken for completed results.
When services run as local processes, workers are not required services: they are
spawned on demand after the core services register, and losing one while others
can still start is a degraded run rather than a failed one. A worker that fails
during start-up reports the failure to the System Controller before exiting. One
that dies without reporting (killed by a signal, or crashing before its comms are
up) is caught by polling its process until it registers, and counts as failed with
its exit code after about two seconds, which leaves room for a report. Once
no spawned worker can still start, the controller cancels the run and surfaces the
workers’ own error, since nothing will ever send a request, instead of waiting out
the credit router’s registration timeout (AIPERF_SERVICE_START_TIMEOUT).
Kubernetes result publication is a fail-closed filesystem transaction. Before
a controller starts benchmark work, and again immediately before export, it
durably removes any stale ready marker and atomically installs a processing
marker. After every required artifact is flushed and exported, it atomically
installs and fsyncs the ready marker before clearing the processing marker. Only
then does it publish ResultsExportedMessage and notify the operator. A crash
or restarted export before that commit leaves top-level artifacts hidden from
the results sidecar. Kubernetes sweep aggregation uses
the same durable ready-marker commit after plotting and scratch-artifact pruning
finish, so the operator never harvests a partially published aggregate tree.
Dataset Manager
The Dataset Manager handles all aspects of input data management during benchmarking runs.
Key Responsibilities:
- Loading datasets from various sources (JSONL, CSV, synthetic generators, trace replay formats)
- Parsing and validating input data to ensure it matches the expected format
- Writing dataset to memory-mapped files, enabling workers to access data directly without message passing
- Supporting custom dataset types, such as MoonCake traces, for advanced benchmarking scenarios
- Managing the lifecycle of datasets, including initialization, iteration, and cleanup
Timing Manager
The Timing Manager controls and coordinates the timing of requests during benchmarking runs through a credit-based system.
Key Responsibilities:
- Scheduling when each request should be sent based on the selected timing mode (fixed schedule, request-rate, or user-centric rate)
- Managing precise timing to accurately reproduce real-world or synthetic load patterns
- Supporting advanced timing scenarios, such as replaying traces with specific inter-arrival times or simulating bursty traffic
- Ensuring that requests are dispatched to workers at the correct intervals for reliable measurement
Worker Manager
The Worker Manager orchestrates and manages the pool of worker processes that execute benchmarking tasks.
Key Responsibilities:
- Coordinating with the system controller to spawn and shut down workers that send requests to the inference server
- Monitoring worker status, progress, and resource usage
- Handling worker lifecycle events, such as startup, shutdown, and error recovery
- Managing worker pool size based on benchmarking requirements
Workers
Workers are the processes that send HTTP requests to the inference server and measure response times.
Key Responsibilities:
- Send HTTP requests to inference servers and measure response timing
- Wait for timing credits before sending requests (enables precise load control)
- Track conversation state for multi-turn interactions
- Report timing measurements to Record Processors for analysis
Scalability:
- Run multiple workers (e.g., 10, 50, 100+) to support different workload patterns
- No coordination between workers
- Adding more workers increases load capacity and request rates
Record Processor
The Record Processor processes and interprets the responses received from the inference server during benchmarking.
Key Responsibilities:
- Parsing raw inference results to extract relevant metrics (latency, output tokens, correctness)
- Handling different response formats from various model endpoints (OpenAI, vLLM, Triton, custom APIs)
- Validating and normalizing results to ensure consistency across benchmarking runs
- Computing metrics derived from individual requests (TTFT, ITL, Request Latency, Request Throughput etc.)
- Supporting error detection and handling for malformed or unexpected responses
- Scales horizontally to handle high-volume metric computation
Records Manager
The Records Manager handles the collection, organization, and storage of benchmarking records and results.
Key Responsibilities:
- Aggregating data from the records processors (inference results, timing information, metrics)
- Storing records in memory and/or exporting them to files (CSV, JSON, Parquet) for later analysis
- Providing interfaces for querying, filtering, and summarizing benchmarking results
- Supporting the generation of reports and artifacts for performance evaluation
- Managing the final export of aggregated performance summaries and per-request details
ProfileResults.completed counts requests processed for the result’s phase
(successful plus failed), independently of how many metric summaries accumulators
or analyzers produce. Profiling counts exclude warmup requests, and cancelled
summaries count the requests processed so far.
Record-Type Channels
The Records Manager does not hard-wire one handler per producer. Instead, every typed record carries a record_type class attribute and is fanned out through a metadata-driven routing table: each accumulator and stream exporter declares the record types it consumes via record_types in plugins.yaml, and _dispatch_record routes each record by getattr(record, "record_type") to all registered handlers. This makes each record type a dedicated channel.
Accuracy benchmarking and GPU telemetry use dedicated Records Manager channels. Server metrics use the same plugin metadata to select local consumers, but raw Prometheus snapshots remain inside Server Metrics Manager:
Two-stage record processing. The RecordProcessorService runs two roles per parsed response (mirroring the accumulator/stream-exporter split on the consumer side): producers (record_processor category) parse and emit one finished typed record on a declared record_type channel — MetricRecordProcessor → MetricRecordsData (metric_records), AccuracyRecordProcessor → AccuracyRecordsData (accuracy) — and observers (record_observer category, e.g. the raw-record and outputs-json writers) receive a RecordObserverContext (the parsed record + all producer outputs keyed by record_type) and act without emitting a channel record. Each producer’s output carries its own serialized record_type discriminator, so the service ships one generic RecordsMessage per request — {metadata, records: list[RecordData], error} — and the RecordsManager dispatches each record to its channel handlers by record.record_type (no per-type message classes, no type-sniffing). The metric record is the canonical per-request record that drives the phase-completion lockstep, keyed off the message metadata.
The AccuracyRecordProcessor grades each parsed response against ground truth and returns an AccuracyRecordsData (session_num, conversation_id, x_request_id, worker_id, benchmark_phase, timestamp_ns, task, grader_name, passed, unparsed, confidence, expected, actual, explanation, model_output, model_thinking). The Records Manager fans each accuracy record out to the AccuracyAccumulator (rolls records into an AccuracySummary of overall + per-task pass/unparsed rates) and the AccuracyJSONLWriter (streams the full per-response grading detail to accuracy_export.jsonl, one JSON object per graded response).
At end of the profiling phase, RecordsManager._publish_accuracy_results(phase) exports the phase-scoped AccuracySummary and publishes a ProcessAccuracyResultMessage. The SystemController receives it and stores the summary — gated in shutdown like the telemetry and server-metrics results. At export time, SystemController._inject_accuracy_results_into_records converts that summary back into legacy accuracy.* MetricResults (via AccuracySummary.to_metric_results()) and appends them to ProfileResults.records. The AccuracyConsoleExporter and AccuracyDataExporter — like the main perf CSV/JSON exporters — then read those injected accuracy.* records. This inject bridge is what keeps the exported files (accuracy_results.csv, profile_export_aiperf.{csv,json}) byte-identical to the pre-refactor output. The dedicated per-response accuracy_export.jsonl is produced independently by the AccuracyJSONLWriter and is unaffected by this bridge.
GPU Telemetry Manager
The GPU Telemetry Manager collects GPU metrics during benchmarking runs via pluggable collectors.
Key Responsibilities:
- Collecting GPU metrics (power, utilization, memory, temperature, errors) via pluggable collector backends:
- DCGM: Scrapes DCGM Exporter HTTP endpoints (Prometheus format) — NVIDIA GPUs; exposes
nvidia_power_usageandnvidia_energy_consumption - PyNVML: Queries NVIDIA GPUs directly via the pynvml Python library (no external endpoint required) — exposes
nvidia_power_usage - amdsmi: Queries AMD GPUs via the amdsmi Python library — exposes
amd_powerandamd_energy_consumption
- DCGM: Scrapes DCGM Exporter HTTP endpoints (Prometheus format) — NVIDIA GPUs; exposes
- Auto-discovering DCGM endpoints
- Supporting custom endpoints via
--gpu-telemetryflag - Exporting GPU telemetry alongside benchmark results
Final GPU samples travel on the telemetry PUSH socket while the completion command travels on the control channel — separate transports entirely, so the command response alone is not an ingest barrier. The GPU Telemetry Manager closes record admission and sends a sequenced terminal marker on the telemetry PUSH socket. The Records Manager waits until every sequence through that marker has finished dispatch before summarizing or finalizing stream exporters. A missing marker or sequence fails result finalization closed instead of publishing a partial JSONL file.
GPU Power Efficiency Analysis
At the end of each profiling phase, EnergyEfficiencyAnalyzer — an analyzer plugin — joins GPU telemetry energy/power data with inference token and throughput totals to produce the GPU power-efficiency metric family.
EnergyEfficiencyAnalyzer.analyze() is called by the SummaryContext at summarize time. It calls GPUTelemetryAccumulator.available_platforms() to discover which vendors reported data, then fans out per vendor: querying windowed energy and power totals, computing the 12 derived metrics (total power, total energy, tokens/joule, energy/token, energy/request, energy/user, energy-delay product, performance/watt, output TPS/watt, goodput/watt, average power), and returning them as injected MetricResult objects. Each vendor’s metrics render in their own console section (GPU_POWER_EFFICIENCY_NVIDIA, GPU_POWER_EFFICIENCY_AMD); a section is omitted entirely when no GPU of that vendor reported.

See docs/dev/patterns.md — Externally-Injected Derived Metric Pattern for the metric class contract and instructions for adding a new vendor.
Server Metrics Manager
The Server Metrics Manager collects metrics from Prometheus-compatible endpoints during benchmarking runs.
Key Responsibilities:
- Collecting metrics from Prometheus-compatible endpoints (inference server application metrics, system metrics, custom metrics)
- Auto-discovering metrics endpoints from configured inference server URLs (
--url) - Discovering eligible inference-server pods through the Kubernetes API, scoped to the benchmark namespace unless another namespace is explicitly configured
- Supporting custom Prometheus endpoints via
--server-metricsflag - Parsing any metrics exposed in Prometheus format (gauges, counters, histograms)
- Owning raw server-metric accumulation and JSONL writes locally; only bounded realtime summaries and the final aggregate cross the message bus
- Typical metrics collected: inference server KV cache usage, request counts, latencies, batch sizes, model-specific metrics, and server resource metrics
- Auto-detecting non-Prometheus endpoints (e.g. TRT-LLM serves an iteration-stats JSON array at
/metricsby default), probing<base>/prometheus/metricsonce as a fallback, and disabling collection for that endpoint after a single warning if neither path yields parseable Prometheus data — see Server Metrics Compatibility & auto-disable - Exporting server metrics alongside benchmark results
How AIPerf Works
Credit System & Request Timing
The Timing Manager uses a credit-based flow control system to control when requests are sent. This enables accurate load pattern reproduction and prevents server overload.
How Credits Work:
- Each credit grants permission to send one request
- The Timing Manager issues credits according to the configured timing mode:
- Fixed schedule mode: Replays conversation traces at precise timestamps from dataset metadata
- Request-rate mode: Issues credits at a specific rate with configurable arrival patterns (constant, Poisson, gamma, concurrency burst)
- User-centric rate mode: Each session acts as a separate user with calculated gaps between turns
Flow Control Benefits:
- Prevents overwhelming the inference server
- Enables precise reproduction of load patterns
- Provides natural backpressure when the server slows down
- Allows accurate measurement without artificial delays
Credit Distribution:
- Credits are dispatched to workers via a ROUTER/DEALER pattern (the Timing Manager’s sticky ROUTER to each worker’s DEALER)
- Router selects workers based on sticky sessions (multi-turn conversations) or least-loaded worker selection
- If a registered worker that owns in-flight credits or sticky sessions is lost during an active benchmark, the Timing Manager cancels the phase and records a terminal failure rather than migrating or truncating worker-local state.
- Credit returns travel back on a dedicated PUSH/PULL fan-in channel: each worker PUSHes its
CreditReturn/FirstTokento the Timing Manager’s single PULL, separating the high-volume return path from credit dispatch - The return channel carries no ZMQ envelope identity, so the returning worker id travels inside the message
- No coordination required between workers
- Scales to large numbers of workers without bottlenecks
- Efficient message routing minimizes overhead
Data Flow & Messaging
This section describes the end-to-end message flow during a benchmark run, showing how data moves between components through the ZMQ message bus.
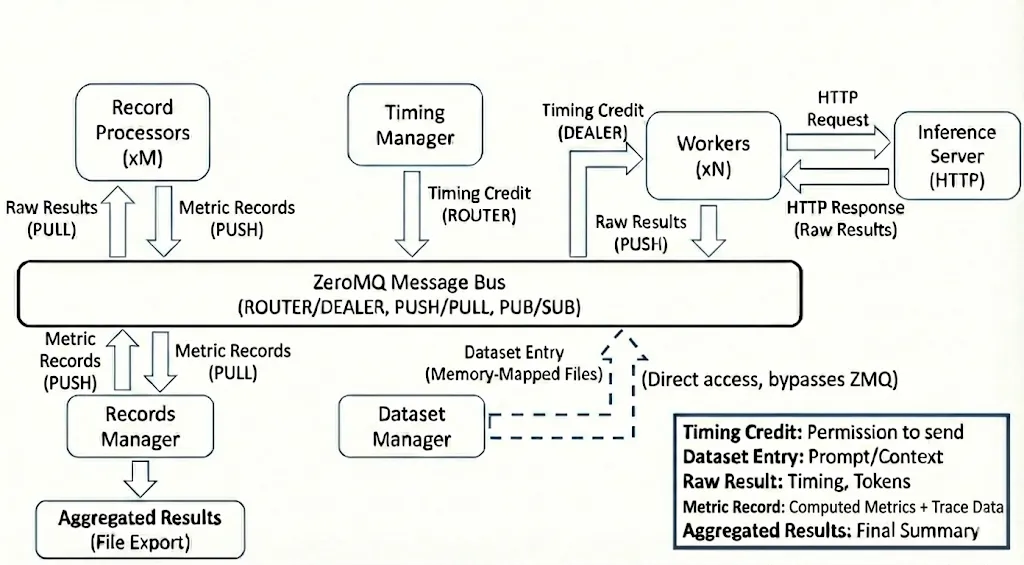
Key Data Structures:
- Timing Credit: Grants permission to send one request
- Dataset Entry: Prompt and conversation context
- Raw Result: Request timing, tokens, response text
- Metric Record: Per-request computed metrics plus trace data
- Aggregated Results: Final performance summary and per-request details
Message Flow:
- Credit Router dispatches credits to workers via ROUTER/DEALER pattern
- Workers access dataset entries via memory-mapped files
- Workers send requests to Inference Server (external HTTP)
- Workers return completed credits to the Timing Manager over a dedicated PUSH/PULL fan-in channel
- Workers push raw results to Record Processors
- Record Processors push metric records to Records Manager
- Records Manager aggregates and exports final results
Communication Architecture
AIPerf services communicate internally via a ZeroMQ (ZMQ) message bus, designed for low-latency, high-throughput message passing between components.
Why ZMQ?
AIPerf uses ZMQ to maintain measurement accuracy by decoupling orchestration logic from execution:
- Low-overhead messaging: Credits are routed directly to workers
- Asynchronous by design: No blocking calls between services, ensuring workers spend maximum time on I/O and timing
- Efficient transport: ZMQ is designed for low-overhead inter-process communication
- Scalability: Supports many local worker processes and distributed Kubernetes execution through the registered
kubernetesservice-manager plugin
Communication Patterns
AIPerf runs two distinct planes over ZMQ: a pub/sub event bus for data and telemetry, and a DEALER/ROUTER control channel for orchestration.
Event bus (ZMQ proxies). Services publish strongly-typed messages to topics and subscribe to the message types they care about. This carries every message type except commands: records, telemetry, progress, results, status broadcasts. Alongside it are the dedicated streaming channels:
- ROUTER/DEALER for credit dispatch to workers
- PUSH/PULL fan-in for credit returns from workers back to the Timing Manager
- Request/Reply for synchronous operations
For low event-loop overhead, the streaming credit sockets (the dispatch DEALER/ROUTER and the return PUSH/PULL) are driven directly off the raw ZMQ file descriptor with an edge-triggered, non-blocking batch drain rather than per-message await wrappers.
Control channel. Commands, service registration, heartbeats, and lifecycle
status do not ride the event bus. Each component service opens a DEALER to
CommAddress.CONTROL using its service ID as the ZMQ identity; the System
Controller binds the single ROUTER. Payloads are msgspec tagged-union structs
from aiperf.common.control_structs rather than Pydantic Message subclasses.
Because the ROUTER is the only path between two non-controller services, a
command aimed at a peer is relayed by a controller-side handler rather than sent
directly — this is how PROFILE_COMPLETE and PROFILE_CANCEL reach their
sibling services.
Addressing is symmetric in both directions:
- Controller to service: identified by the DEALER identity. A one-shot request awaits a response; a fan-out sends to an explicit list of service IDs. There is no untargeted command broadcast.
- Service to controller:
send_command_to_controller()on the same socket.
Each command carries a correlation id and is answered exactly once, with an ack,
a result, an error, or an explicit “no handler” response. See
docs/dev/patterns.md § “Control Channel Command Pattern”.
Registration is deliberately the second readiness proof a service gives: it runs after the event-bus connection probe succeeds, so a registered service has demonstrated both planes are live.
Heartbeats are sent on both planes, on purpose. Every service emits a
Heartbeat struct on the control channel and a HeartbeatMessage on the event
bus each interval. These are not duplicates and neither may be removed as one:
The bus heartbeat is intentionally not gated on registration — the credit router’s liveness clock is independent of the controller’s registration handshake — while the control-channel heartbeat is, so that services do not provoke “unknown service” warnings before they have registered.
State Management
Stateless design for scalability:
- Workers: No shared state between workers; each maintains only local conversation context for multi-turn requests
- Services: All service state is ephemeral and can be reconstructed from configuration
- Coordination: Credit distribution happens through the message bus; dataset access via memory-mapped files
- Results: Only aggregated results are persistent (exported to files)
Design Principles
AIPerf is built on three core principles:
- Separation of Concerns: Control plane orchestrates, workers execute, record processors compute metrics
- Scalability: Horizontal scaling for workers and processors with credit-based flow control
- Extensibility: Plugin system for datasets, endpoints, transports, and metrics
Deployment Modes
AIPerf supports two deployment models:
- Multiprocess Mode: Each service runs as a separate process on a single node (default for single-node deployments)
- Kubernetes Mode: Control-plane services run as sibling containers in the controller pod, while workers and record processors run in external pods managed by JobSet.
Configuration Envelope
The top-level AIPerfConfig YAML accepts several optional sibling keys alongside the core benchmark: block — sweep:, multi_run:, variables:, random_seed:, and plot:. Each owns a single concern and is loaded by its own Pydantic model.
The plot: envelope describes which plots are rendered after the run. It accepts two forms: a bare-string path reference (e.g. plot: ./plots/baseline.yaml, resolved relative to the AIPerf YAML’s directory) or an inline mapping mirroring src/aiperf/plot/default_plot_config.yaml 1:1. When plot: is set it replaces the ~/.aiperf/plot_config.yaml fallback (the envelope is the spec) and presence implies artifacts.auto_plot=True unless the user explicitly sets it to false. The auto-plot callback materializes the resolved envelope to <artifact_dir>/.aiperf-plot-config.yaml so aiperf plot <dir> later reproduces the same plots without the original YAML. See src/aiperf/config/plot.py for the Pydantic models.
External Dependencies
AIPerf integrates with external systems:
- Inference Server: The target system being benchmarked (vLLM, Dynamo, SGLang, etc.)
- DCGM Exporter: Optional GPU telemetry source (exposes GPU metrics in Prometheus format). Alternative: PyNVML queries GPUs directly without an external endpoint.
- Prometheus-compatible endpoints: Optional server/application metrics source for Server Metrics Manager (inference servers like vLLM expose metrics in Prometheus format at their /metrics endpoint)
Telemetry Plane
The Telemetry Plane provides real-time streaming of benchmark metrics to OpenTelemetry collectors and MLflow tracking servers. It operates as a sidecar to the Analytic Plane, consuming processed results without affecting the core benchmarking pipeline.
OTelMetricsResultsProcessor Registration
OTelMetricsResultsProcessor is a results processor registered with RecordsManager. When --otel-url is set (with --stream controlling which domains are active), the processor is instantiated and added to the Records Manager’s processor chain. It receives every MetricRecordsData and CreditPhaseStats event that flows through the analytic plane, acting as the entry point into the telemetry pipeline.
The processor does not emit metrics directly. Instead, it delegates to strategy objects that decide whether a given result type is relevant and how to transform it into telemetry events.
multiprocessing.Queue and Fanout Process
Telemetry export runs in a dedicated child process (Fanout_Process) to isolate the benchmarking hot path from network I/O to collectors and tracking servers. Communication between the main process and the fanout process uses a bounded multiprocessing.Queue.
Back-pressure policy: When the queue is full, the oldest event is dropped and the put is retried once. A _fanout_dropped_events counter tracks discards so operators can detect saturation without impacting benchmark accuracy.
The fanout process drains the queue with a configurable poll_timeout_sec, batches events through the OTel SDK periodic reader for OTLP export, and optionally forwards metrics to MLflow when --mlflow-tracking-uri is set.
Strategy-Protocol Dispatch via —stream
The --stream flag activates strategy-based dispatch inside OTelMetricsResultsProcessor. Each strategy implements a two-method protocol:
supports(result)— returnsTrueif the strategy handles this result type.process(result)— transforms the result into one or more telemetry events pushed to the queue.
Two built-in strategies ship with the system:
Strategies are evaluated in registration order; the first whose supports returns True wins.
Deferred MLflow Path in ExporterManager
Post-run artifact upload follows a deferred export path. MLflowDataExporter is registered as a deferred exporter in ExporterManager so it runs after all local exporters (JSON, CSV, Parquet) have written their files. This guarantees that every artifact is available on disk before the upload begins.
The deferred path handles run identity, metric logging, and artifact upload in a single pass:
Data Flow: Record Telemetry
The following diagram shows how per-request metrics flow from workers through the analytic plane into the telemetry pipeline:
Data Flow: Timing Telemetry
Credit-phase timing events follow a similar path but use counters and up-down counters rather than histograms: