DCGM-Exporter#
Introduction#
DCGM-Exporter is a tool based on the
Go APIs to NVIDIA DCGM that allows users to gather
GPU metrics and understand workload behavior or monitor GPUs in clusters. dcgm-exporter is
written in Go and exposes GPU metrics at an HTTP endpoint (/metrics) for monitoring solutions
such as Prometheus.
For information on the profiling metrics available from DCGM, refer to this section in the documentation.
Getting Started#
dcgm-exporter can be run as a standalone container or deployed as a daemonset on GPU nodes in a Kubernetes cluster.
Since dcgm-exporter starts nv-hostengine as an embedded process (for collecting metrics), appropriate configuration options should be used if dcgm-exporter is run on systems (such as NVIDIA DGX) that have DCGM (or rather nv-hostengine) running.
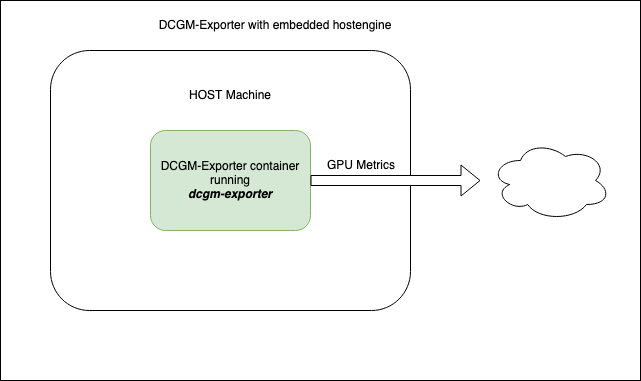
Running dcgm-exporter#
The dcgm-exporter container can be run using a container engine such as Docker. In this mode, dcgm-exporter starts nv-hostengine as an embedded process and starts publishing metrics:
$ DCGM_EXPORTER_VERSION=2.1.4-2.3.1 && \
docker run -d --rm \
   --gpus all \
   --net host \
   --cap-add SYS_ADMIN \
   nvcr.io/nvidia/k8s/dcgm-exporter:${DCGM_EXPORTER_VERSION}-ubuntu20.04 \
   -f /etc/dcgm-exporter/dcp-metrics-included.csv
Retrieve the metrics:
$ curl localhost:9400/metrics
# HELP DCGM_FI_DEV_SM_CLOCK SM clock frequency (in MHz).
# TYPE DCGM_FI_DEV_SM_CLOCK gauge
# HELP DCGM_FI_DEV_MEM_CLOCK Memory clock frequency (in MHz).
# TYPE DCGM_FI_DEV_MEM_CLOCK gauge
# HELP DCGM_FI_DEV_MEMORY_TEMP Memory temperature (in C).
# TYPE DCGM_FI_DEV_MEMORY_TEMP gauge
...
DCGM_FI_DEV_SM_CLOCK{gpu="0", UUID="GPU-604ac76c-d9cf-fef3-62e9-d92044ab6e52"} 139
DCGM_FI_DEV_MEM_CLOCK{gpu="0", UUID="GPU-604ac76c-d9cf-fef3-62e9-d92044ab6e52"} 405
DCGM_FI_DEV_MEMORY_TEMP{gpu="0", UUID="GPU-604ac76c-d9cf-fef3-62e9-d92044ab6e52"} 9223372036854775794
...
DCGM-Exporter Customization#
DCGM-Exporter has various options for adjusting its default behavior. Each option supports both a command-line flag and environment variable.
Environment Variable |
Command-Line Flag |
Value |
|---|---|---|
|
|
File Path |
Path to file containing DCGM fields to collect. Default: “/etc/dcgm-exporter/default-counters.csv” |
||
|
|
Address |
Address of listening http server. Default: “:9400” |
||
|
|
Interval |
Interval of time at which point metrics are collected. Unit is milliseconds. Default:30000 |
||
|
|
Boolean |
Enable kubernetes mapping metrics to kubernetes pods. Default: false |
||
|
|
Namespace:Name |
ConfigMap namespace and name containing DCGM fields to collect. Default: “none” |
||
|
|
Host:Port |
Connect to remote hostengine at Host:Port. Default: NA (dcgm-exporter will started in embedded mode) |
||
|
|
Device String (see following note) |
Specify which devices to monitor. Default: all GPU instances in MIG mode, all GPUs if MIG disabled. |
||
Note
Device String Syntax: [f] | [g[:id1[,-id2]]] | [i[:id1[,-id2]]]
If an id list is used, then devices with matching IDs must exist on the system. For example:
f= Monitor all GPUs if MIG is disabled, or all GPU instances if MIG is enabledg= Monitor all GPUsi= Monitor all GPU instancesg:0,1= monitor GPUs 0 and 1i:0,2-4= monitor GPU instances 0, 2, 3, and 4.
Warning
-icannot be specified unless MIG mode is enabled.Any time indices are specified, those indices must exist on the system.
In MIG mode, only
foriwith a range can be specified. GPUs are not assigned to pods and therefore reporting must occur at the GPU instance level. (default:f)
Connecting to an existing DCGM agent#
In this scenario, system images include DCGM and have nv-hostengine running already. Examples include the DGX systems that bundles drivers, DCGM, etc. in the system image. To avoid any compatibility issues, it is recommended to have dcgm-exporter connect to the existing nv-hostengine daemon to gather/publish GPU telemetry data.
Warning
The dcgm-exporter container image includes a DCGM client library (libdcgm.so) to communicate with
nv-hostengine. In this deployment scenario we have dcgm-exporter (or rather libdcgm.so) connect
to an existing nv-hostengine running on the host. The DCGM client library uses an internal protocol to exchange
information with nv-hostengine. To avoid any potential incompatibilities between the container image’s DCGM client library
and the host’s nv-hostengine, it is strongly recommended to use a version of DCGM on which dcgm-exporter is based is
greater than or equal to (but not less than) the version of DCGM running on the host. This can be easily determined by
comparing the version tags of the dcgm-exporter image and by running nv-hostengine --version on the host.
In this scenario, we use the -r option to connect to an existing nv-hostengine process:
$ DCGM_EXPORTER_VERSION=2.1.4-2.3.1 &&
docker run -d --rm \
   --gpus all \
   --net host \
   --cap-add SYS_ADMIN \
   nvcr.io/nvidia/k8s/dcgm-exporter:${DCGM_EXPORTER_VERSION}-ubuntu20.04 \
   -r localhost:5555 -f /etc/dcgm-exporter/dcp-metrics-included.csv
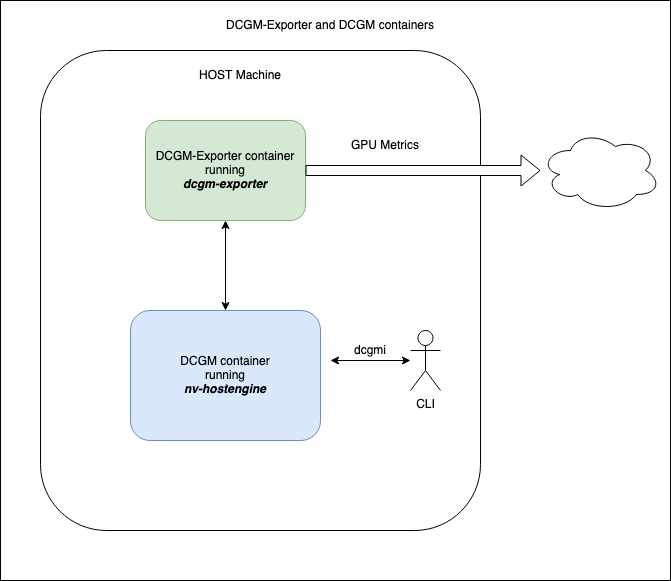
Connecting to a DCGM standalone container#
In this scenario the DCGM nv-hostengine runs in a separate container on the same host making its client port available to DCGM-Exporter as well as dcgmi client commands.
Warning
Similar to the warning when connecting to an existing DCGM agent, the dcgm-exporter container image includes a
DCGM client library (libdcgm.so) to communicate with nv-hostengine running in a separate container.
The DCGM client library in use by DCGM-Exporter uses an internal protocol to exchange information with nv-hostengine.
To avoid any potential incompatibilities between the container image’s DCGM client library
and the standalone DCGM container’s nv-hostengine, it is strongly recommended to ensure the version of DCGM on which
dcgm-exporter is based is greater than or equal to (but not less than) the version of DCGM running in the standalone
container. This can be easily determined by comparing the version tags of the dcgm-exporter and dcgm standalone image.
First, start the standalone DCGM container with the nv-hostengine port available to external applications:
$DCGM_VERSION=2.2.9 &&
docker run -d --rm \
   --gpus all \
   --cap-add SYS_ADMIN \
   -p 5555:5555 \
   nvidia/dcgm:${DCGM_VERSION}-ubuntu20.04
Second, start the dcgm-exporter container with r option to connect to an existing nv-hostengine port:
$DCGM_EXPORTER_VERSION=2.2.9-2.5.0 &&
docker run -d --rm \
   --gpus all \
   --net host \
   --cap-add SYS_ADMIN \
   nvcr.io/nvidia/k8s/dcgm-exporter:${DCGM_EXPORTER_VERSION}-ubuntu20.04 \
   -r localhost:5555 -f /etc/dcgm-exporter/dcp-metrics-included.csv
In this scenario dcgmi commands run on the host will also connect to the nv-hostengine running in the standalone DCGM container:
dcgmi discovery -l
1 GPU found (Active).
+--------+----------------------------------------------------------------------+
| GPU ID | Device Information                                                   |
+--------+----------------------------------------------------------------------+
| 0      | Name: Quadro RTX 6000                                                |
|        | PCI Bus ID: 00000000:65:00.0                                         |
|        | Device UUID: GPU-2f6576bf-3c29-1fbb-068d-e74c4a97f0c5                |
+--------+----------------------------------------------------------------------+
Multi-Instance GPU (MIG) Support#
The new Multi-Instance GPU (MIG) feature allows the GPUs based on the NVIDIA Ampere architecture to be securely partitioned into up to seven separate GPU Instances for CUDA applications, providing multiple users with separate GPU resources for optimal GPU utilization.
For more information on MIG, refer to the MIG User Guide.
Note
Support for MIG in dcgm-exporter was added starting with 2.4.0-rc.2. Replace the container image with this tag in the
command line examples above: 2.1.8-2.4.0-rc.2-ubuntu20.04. If you are connecting to an existing DCGM on the host system,
ensure that you upgrade to at least 2.1.8 on the host system.
dcgm-exporter publishes metrics for both the entire GPU as well as individual MIG devices (or GPU instances) as can be seen in the output below:
DCGM_FI_DEV_SM_CLOCK{gpu="0",UUID="GPU-34319582-d595-d1c7-d1d2-179bcfa61660",device="nvidia0",Hostname="ub20-a100-k8s"} 1215
DCGM_FI_DEV_MEM_CLOCK{gpu="0",UUID="GPU-34319582-d595-d1c7-d1d2-179bcfa61660",device="nvidia0",Hostname="ub20-a100-k8s"} 1215
DCGM_FI_DEV_MEMORY_TEMP{gpu="0",UUID="GPU-34319582-d595-d1c7-d1d2-179bcfa61660",device="nvidia0",Hostname="ub20-a100-k8s"} 69
DCGM_FI_DEV_GPU_TEMP{gpu="0",UUID="GPU-34319582-d595-d1c7-d1d2-179bcfa61660",device="nvidia0",Hostname="ub20-a100-k8s"} 61
DCGM_FI_DEV_POWER_USAGE{gpu="0",UUID="GPU-34319582-d595-d1c7-d1d2-179bcfa61660",device="nvidia0",Hostname="ub20-a100-k8s"} 409.692000
DCGM_FI_DEV_TOTAL_ENERGY_CONSUMPTION{gpu="0",UUID="GPU-34319582-d595-d1c7-d1d2-179bcfa61660",device="nvidia0",Hostname="ub20-a100-k8s"} 319159391
DCGM_FI_DEV_PCIE_REPLAY_COUNTER{gpu="0",UUID="GPU-34319582-d595-d1c7-d1d2-179bcfa61660",device="nvidia0",Hostname="ub20-a100-k8s"} 0
DCGM_FI_DEV_XID_ERRORS{gpu="0",UUID="GPU-34319582-d595-d1c7-d1d2-179bcfa61660",device="nvidia0",Hostname="ub20-a100-k8s"} 0
DCGM_FI_DEV_FB_FREE{gpu="0",UUID="GPU-34319582-d595-d1c7-d1d2-179bcfa61660",device="nvidia0",Hostname="ub20-a100-k8s"} 35690
DCGM_FI_DEV_FB_USED{gpu="0",UUID="GPU-34319582-d595-d1c7-d1d2-179bcfa61660",device="nvidia0",Hostname="ub20-a100-k8s"} 4845
DCGM_FI_DEV_NVLINK_BANDWIDTH_TOTAL{gpu="0",UUID="GPU-34319582-d595-d1c7-d1d2-179bcfa61660",device="nvidia0",Hostname="ub20-a100-k8s"} 0
DCGM_FI_DEV_VGPU_LICENSE_STATUS{gpu="0",UUID="GPU-34319582-d595-d1c7-d1d2-179bcfa61660",device="nvidia0",Hostname="ub20-a100-k8s"} 0
DCGM_FI_PROF_GR_ENGINE_ACTIVE{gpu="0",UUID="GPU-34319582-d595-d1c7-d1d2-179bcfa61660",device="nvidia0",Hostname="ub20-a100-k8s"} 0.995630
DCGM_FI_PROF_PIPE_TENSOR_ACTIVE{gpu="0",UUID="GPU-34319582-d595-d1c7-d1d2-179bcfa61660",device="nvidia0",Hostname="ub20-a100-k8s"} 0.929260
DCGM_FI_PROF_DRAM_ACTIVE{gpu="0",UUID="GPU-34319582-d595-d1c7-d1d2-179bcfa61660",device="nvidia0",Hostname="ub20-a100-k8s"} 0.690789
DCGM_FI_PROF_PCIE_TX_BYTES{gpu="0",UUID="GPU-34319582-d595-d1c7-d1d2-179bcfa61660",device="nvidia0",Hostname="ub20-a100-k8s"} 33011804
DCGM_FI_PROF_PCIE_RX_BYTES{gpu="0",UUID="GPU-34319582-d595-d1c7-d1d2-179bcfa61660",device="nvidia0",Hostname="ub20-a100-k8s"} 97863601

DCGM_FI_DEV_XID_ERRORS{gpu="0",UUID="GPU-34319582-d595-d1c7-d1d2-179bcfa61660",device="nvidia0",GPU_I_PROFILE="1g.5gb",GPU_I_ID="13",Hostname="ub20-a100-k8s"} 0
DCGM_FI_PROF_GR_ENGINE_ACTIVE{gpu="0",UUID="GPU-34319582-d595-d1c7-d1d2-179bcfa61660",device="nvidia0",GPU_I_PROFILE="1g.5gb",GPU_I_ID="13",Hostname="ub20-a100-k8s"} 0.995687
DCGM_FI_PROF_PIPE_TENSOR_ACTIVE{gpu="0",UUID="GPU-34319582-d595-d1c7-d1d2-179bcfa61660",device="nvidia0",GPU_I_PROFILE="1g.5gb",GPU_I_ID="13",Hostname="ub20-a100-k8s"} 0.930433
DCGM_FI_PROF_DRAM_ACTIVE{gpu="0",UUID="GPU-34319582-d595-d1c7-d1d2-179bcfa61660",device="nvidia0",GPU_I_PROFILE="1g.5gb",GPU_I_ID="13",Hostname="ub20-a100-k8s"} 0.800339
For more information on the profiling metrics and how to interpret the metrics, refer to the profiling metrics section of the DCGM user guide.
Integrating GPU Telemetry into Kubernetes#
Understanding GPU usage provides important insights for IT administrators managing a data center. Trends in GPU metrics correlate with workload behavior and make it possible to optimize resource allocation, diagnose anomalies, and increase overall data center efficiency. As GPUs become more mainstream in Kubernetes environments, users would like to get access to GPU metrics to monitor GPU resources, just like they do today for CPUs.
The purpose of this document is to enumerate an end-to-end (e2e) workflow for setting up and using DCGM within a Kubernetes environment.
For simplicity, the base environment being used in this guide is Ubuntu 18.04 LTS and a native installation of the NVIDIA drivers on the GPU enabled nodes (i.e. neither the NVIDIA GPU Operator nor containerized drivers are used in this document).
NVIDIA Drivers#
This section provides a summary of the steps for installing the driver using the apt package manager on Ubuntu LTS.
Note
For complete instructions on setting up NVIDIA drivers, visit the quickstart guide at https://docs.nvidia.com/datacenter/tesla/tesla-installation-notes/index.html. The guide covers a number of pre-installation requirements and steps on supported Linux distributions for a successful install of the driver.
Install the kernel headers and development packages for the currently running kernel:
$ sudo apt-get install linux-headers-$(uname -r)
Setup the CUDA network repository and ensure packages on the CUDA network repository have priority over the Canonical repository:
$ distribution=$(. /etc/os-release;echo $ID$VERSION_ID | sed -e 's/\.//g') \
   && wget https://developer.download.nvidia.com/compute/cuda/repos/$distribution/x86_64/cuda-$distribution.pin \
   && sudo mv cuda-$distribution.pin /etc/apt/preferences.d/cuda-repository-pin-600
Install the CUDA repository GPG key:
$ sudo apt-key adv --fetch-keys https://developer.download.nvidia.com/compute/cuda/repos/$distribution/x86_64/7fa2af80.pub \
   && echo "deb http://developer.download.nvidia.com/compute/cuda/repos/$distribution/x86_64 /" | sudo tee /etc/apt/sources.list.d/cuda.list
Update the apt repository cache and install the driver using the cuda-drivers meta-package. Use the --no-install-recommends option for a lean driver install
without any dependencies on X packages. This is particularly useful for headless installations on cloud instances:
$ sudo apt-get update \
   && sudo apt-get -y install cuda-drivers
Install Docker#
Use the official Docker script to install the latest release of Docker:
$ curl https://get.docker.com | sh
$ sudo systemctl --now enable docker
Install NVIDIA Container Toolkit (previously nvidia-docker2)#
To run GPU accelerated containers in Docker, NVIDIA Container Toolkit for Docker is required.
Setup the stable repository and the GPG key:
$ distribution=$(. /etc/os-release;echo $ID$VERSION_ID) \
   && curl -s -L https://nvidia.github.io/nvidia-docker/gpgkey | sudo apt-key add - \
   && curl -s -L https://nvidia.github.io/nvidia-docker/$distribution/nvidia-docker.list | sudo tee /etc/apt/sources.list.d/nvidia-docker.list
Install the NVIDIA runtime packages (and their dependencies) after updating the package listing:
$ sudo apt-get update \
   && sudo apt-get install -y nvidia-docker2
Since Kubernetes does not support the --gpus option with Docker yet, the nvidia runtime should be setup as the
default container runtime for Docker on the GPU node. This can be done by adding the default-runtime line into the Docker daemon
config file, which is usually located on the system at /etc/docker/daemon.json:
{
   "default-runtime": "nvidia",
   "runtimes": {
        "nvidia": {
            "path": "/usr/bin/nvidia-container-runtime",
            "runtimeArgs": []
      }
   }
}
Restart the Docker daemon to complete the installation after setting the default runtime:
$ sudo systemctl restart docker
At this point, a working setup can be tested by running a base CUDA container:
$ sudo docker run --rm --gpus all nvidia/cuda:11.0-base nvidia-smi
You should observe an output as shown below:
+-----------------------------------------------------------------------------+
| NVIDIA-SMI 450.51.06    Driver Version: 450.51.06    CUDA Version: 11.0     |
|-------------------------------+----------------------+----------------------+
| GPU  Name        Persistence-M| Bus-Id        Disp.A | Volatile Uncorr. ECC |
| Fan  Temp  Perf  Pwr:Usage/Cap|         Memory-Usage | GPU-Util  Compute M. |
|                               |                      |               MIG M. |
|===============================+======================+======================|
|   0  Tesla T4            On   | 00000000:00:1E.0 Off |                    0 |
| N/A   34C    P8     9W /  70W |      0MiB / 15109MiB |      0%      Default |
|                               |                      |                  N/A |
+-------------------------------+----------------------+----------------------+

+-----------------------------------------------------------------------------+
| Processes:                                                                  |
|  GPU   GI   CI        PID   Type   Process name                  GPU Memory |
|        ID   ID                                                   Usage      |
|=============================================================================|
|  No running processes found                                                 |
+-----------------------------------------------------------------------------+
Install Kubernetes#
Refer to install-k8s for getting started with setting up a Kubernetes cluster.
Install NVIDIA Device Plugin#
To use GPUs in Kubernetes, the NVIDIA Device Plugin is required. The NVIDIA Device Plugin is a daemonset that automatically enumerates the number of GPUs on each node of the cluster and allows pods to be run on GPUs.
The preferred method to deploy the device plugin is as a daemonset using helm. First, install Helm:
$ curl -fsSL -o get_helm.sh https://raw.githubusercontent.com/helm/helm/master/scripts/get-helm-3 \
   && chmod 700 get_helm.sh \
   && ./get_helm.sh
Add the nvidia-device-plugin helm repository:
$ helm repo add nvdp https://nvidia.github.io/k8s-device-plugin \
   && helm repo update
Deploy the device plugin:
$ helm install --generate-name nvdp/nvidia-device-plugin
For more user configurable options while deploying the daemonset, refer to the documentation
At this point, all the pods should be deployed:
$ kubectl get pods -A
NAMESPACE     NAME                                       READY   STATUS      RESTARTS   AGE
kube-system   calico-kube-controllers-5fbfc9dfb6-2ttkk   1/1     Running     3          9d
kube-system   calico-node-5vfcb                          1/1     Running     3          9d
kube-system   coredns-66bff467f8-jzblc                   1/1     Running     4          9d
kube-system   coredns-66bff467f8-l85sz                   1/1     Running     3          9d
kube-system   etcd-ip-172-31-81-185                      1/1     Running     4          9d
kube-system   kube-apiserver-ip-172-31-81-185            1/1     Running     3          9d
kube-system   kube-controller-manager-ip-172-31-81-185   1/1     Running     3          9d
kube-system   kube-proxy-86vlr                           1/1     Running     3          9d
kube-system   kube-scheduler-ip-172-31-81-185            1/1     Running     4          9d
kube-system   nvidia-device-plugin-1595448322-42vgf      1/1     Running     2          9d
To test whether CUDA jobs can be deployed, run a sample CUDA vectorAdd application:
The pod spec is shown for reference below, which requests 1 GPU:
apiVersion: v1
kind: Pod
metadata:
  name: gpu-operator-test
spec:
  restartPolicy: OnFailure
  containers:
  - name: cuda-vector-add
    image: "nvidia/samples:vectoradd-cuda10.2"
    resources:
      limits:
         nvidia.com/gpu: 1
Save this podspec as gpu-pod.yaml. Now, deploy the application:
$ kubectl apply -f gpu-pod.yaml
Check the logs to ensure the app completed successfully:
$ kubectl get pods gpu-operator-test
NAME                READY   STATUS      RESTARTS   AGE
gpu-operator-test   0/1     Completed   0          9d
And check the logs of the gpu-operator-test pod:
$ kubectl logs gpu-operator-test
[Vector addition of 50000 elements]
Copy input data from the host memory to the CUDA device
CUDA kernel launch with 196 blocks of 256 threads
Copy output data from the CUDA device to the host memory
Test PASSED
Done
GPU Telemetry#
Monitoring stacks usually consist of a collector, a time-series database to store metrics and a visualization layer. A popular open-source stack is Prometheus used along with Grafana as the visualization tool to create rich dashboards. Prometheus also includes an Alertmanager, to create and manage alerts. Prometheus is deployed along with kube-state-metrics and node_exporter to expose cluster-level metrics for Kubernetes API objects and node-level metrics such as CPU utilization.
An architecture of Prometheus is shown in the figure below:

To gather GPU telemetry in Kubernetes, its recommended to use dcgm-exporter. dcgm-exporter, based on DCGM exposes
GPU metrics for Prometheus and can be visualized using Grafana. dcgm-exporter is architected to take advantage of
KubeletPodResources API and exposes GPU metrics in a format that can be
scraped by Prometheus. A ServiceMonitor is also included to expose endpoints.
The rest of this section walks through setting up Prometheus, dcgm-exporter, and grafana.
Now you can see the Prometheus and Grafana pods:
$ kubectl get pods -A
NAMESPACE     NAME                                                              READY   STATUS      RESTARTS   AGE
kube-system   calico-kube-controllers-8f59968d4-g28x8                           1/1     Running     1          23m
kube-system   calico-node-zfnfk                                                 1/1     Running     1          23m
kube-system   coredns-f9fd979d6-p7djj                                           1/1     Running     1          23m
kube-system   coredns-f9fd979d6-qhhgq                                           1/1     Running     1          23m
kube-system   etcd-ip-172-31-92-253                                             1/1     Running     1          23m
kube-system   kube-apiserver-ip-172-31-92-253                                   1/1     Running     2          23m
kube-system   kube-controller-manager-ip-172-31-92-253                          1/1     Running     1          23m
kube-system   kube-proxy-mh528                                                  1/1     Running     1          23m
kube-system   kube-scheduler-ip-172-31-92-253                                   1/1     Running     1          23m
kube-system   nvidia-device-plugin-1603211071-7hlk6                             1/1     Running     0          15m
prometheus    alertmanager-kube-prometheus-stack-1603-alertmanager-0            2/2     Running     0          13m
prometheus    kube-prometheus-stack-1603-operator-6b95bcdc79-wmbkn              2/2     Running     0          13m
prometheus    kube-prometheus-stack-1603211794-grafana-67ff56c449-tlmxc         2/2     Running     0          13m
prometheus    kube-prometheus-stack-1603211794-kube-state-metrics-877df67c49f   1/1     Running     0          13m
prometheus    kube-prometheus-stack-1603211794-prometheus-node-exporter-b5fl9   1/1     Running     0          13m
prometheus    prometheus-kube-prometheus-stack-1603-prometheus-0                3/3     Running     1          13m
Now, we will deploy dcgm-exporter to gather GPU telemetry. First, lets setup the Helm repo:
$ helm repo add gpu-helm-charts \
   https://nvidia.github.io/dcgm-exporter/helm-charts
And then update the Helm repo:
$ helm repo update
DCGM-Exporter Helm Chart Customization
The DCGM-Exporter helm package includes several customization options for various use cases.
- arguments
Customize the command-line parameters passed to dcgm-exporter on startup.
Example: Set the metric collection interval to 1000 milliseconds.
arguments["-c", "1000"]
- extraConfigMapVolumes
Attach ConfigMap volume containing the metrics to the be watched.
Example: Attach the ‘exporter-metrics-config-map’ volume to the pod.
extraConfigMapVolumes:
- name: exporter-metrics-volume
  configMap:
    name: exporter-metrics-config-map
- extraEnv
Customize environment variables, including and especially the DCGM-Exporter variables.
Example: Collect the metrics specified in the ConfigMap `exporter-metrics-volume`.
extraEnv:
- name: DCGM_EXPORTER_CONFIGMAP_DATA
  value: "default:exporter-metrics-volume"
Install the dcgm-exporter chart:
$ helm install \
   --generate-name \
   gpu-helm-charts/dcgm-exporter
Now, you can observe the dcgm-exporter pod:
$ kubectl get pods -A
NAMESPACE     NAME                                                              READY   STATUS      RESTARTS   AGE
default       dcgm-exporter-2-1603213075-w27mx                                  1/1     Running     0          2m18s
kube-system   calico-kube-controllers-8f59968d4-g28x8                           1/1     Running     1          43m
kube-system   calico-node-zfnfk                                                 1/1     Running     1          43m
kube-system   coredns-f9fd979d6-p7djj                                           1/1     Running     1          43m
kube-system   coredns-f9fd979d6-qhhgq                                           1/1     Running     1          43m
kube-system   etcd-ip-172-31-92-253                                             1/1     Running     1          43m
kube-system   kube-apiserver-ip-172-31-92-253                                   1/1     Running     2          43m
kube-system   kube-controller-manager-ip-172-31-92-253                          1/1     Running     1          43m
kube-system   kube-proxy-mh528                                                  1/1     Running     1          43m
kube-system   kube-scheduler-ip-172-31-92-253                                   1/1     Running     1          43m
kube-system   nvidia-device-plugin-1603211071-7hlk6                             1/1     Running     0          35m
prometheus    alertmanager-kube-prometheus-stack-1603-alertmanager-0            2/2     Running     0          33m
prometheus    kube-prometheus-stack-1603-operator-6b95bcdc79-wmbkn              2/2     Running     0          33m
prometheus    kube-prometheus-stack-1603211794-grafana-67ff56c449-tlmxc         2/2     Running     0          33m
prometheus    kube-prometheus-stack-1603211794-kube-state-metrics-877df67c49f   1/1     Running     0          33m
prometheus    kube-prometheus-stack-1603211794-prometheus-node-exporter-b5fl9   1/1     Running     0          33m
prometheus    prometheus-kube-prometheus-stack-1603-prometheus-0                3/3     Running     1          33m
You can view the services setup as part of the operator and dcgm-exporter:
$ kubectl get svc -A
NAMESPACE     NAME                                                        TYPE        CLUSTER-IP      EXTERNAL-IP   PORT(S)                        AGE
default       dcgm-exporter-2-1603213075                                  ClusterIP   10.104.40.255   <none>        9400/TCP                       7m44s
default       kubernetes                                                  ClusterIP   10.96.0.1       <none>        443/TCP                        49m
kube-system   kube-dns                                                    ClusterIP   10.96.0.10      <none>        53/UDP,53/TCP,9153/TCP         48m
kube-system   kube-prometheus-stack-1603-coredns                          ClusterIP   None            <none>        9153/TCP                       28m
kube-system   kube-prometheus-stack-1603-kube-controller-manager          ClusterIP   None            <none>        10252/TCP                      28m
kube-system   kube-prometheus-stack-1603-kube-etcd                        ClusterIP   None            <none>        2379/TCP                       28m
kube-system   kube-prometheus-stack-1603-kube-proxy                       ClusterIP   None            <none>        10249/TCP                      28m
kube-system   kube-prometheus-stack-1603-kube-scheduler                   ClusterIP   None            <none>        10251/TCP                      28m
kube-system   kube-prometheus-stack-1603-kubelet                          ClusterIP   None            <none>        10250/TCP,10255/TCP,4194/TCP   28m
prometheus    alertmanager-operated                                       ClusterIP   None            <none>        9093/TCP,9094/TCP,9094/UDP     28m
prometheus    kube-prometheus-stack-1603-alertmanager                     ClusterIP   10.100.20.237   <none>        9093/TCP                       28m
prometheus    kube-prometheus-stack-1603-operator                         ClusterIP   10.111.1.27     <none>        8080/TCP,443/TCP               28m
prometheus    kube-prometheus-stack-1603-prometheus                       NodePort    10.99.188.46    <none>        9090:30090/TCP                 28m
prometheus    kube-prometheus-stack-1603211794-grafana                    ClusterIP   10.109.219.60   <none>        80/TCP                         28m
prometheus    kube-prometheus-stack-1603211794-kube-state-metrics         ClusterIP   10.103.250.41   <none>        8080/TCP                       28m
prometheus    kube-prometheus-stack-1603211794-prometheus-node-exporter   ClusterIP   10.108.225.36   <none>        9100/TCP                       28m
prometheus    prometheus-operated                                         ClusterIP   None            <none>        9090/TCP                       28m
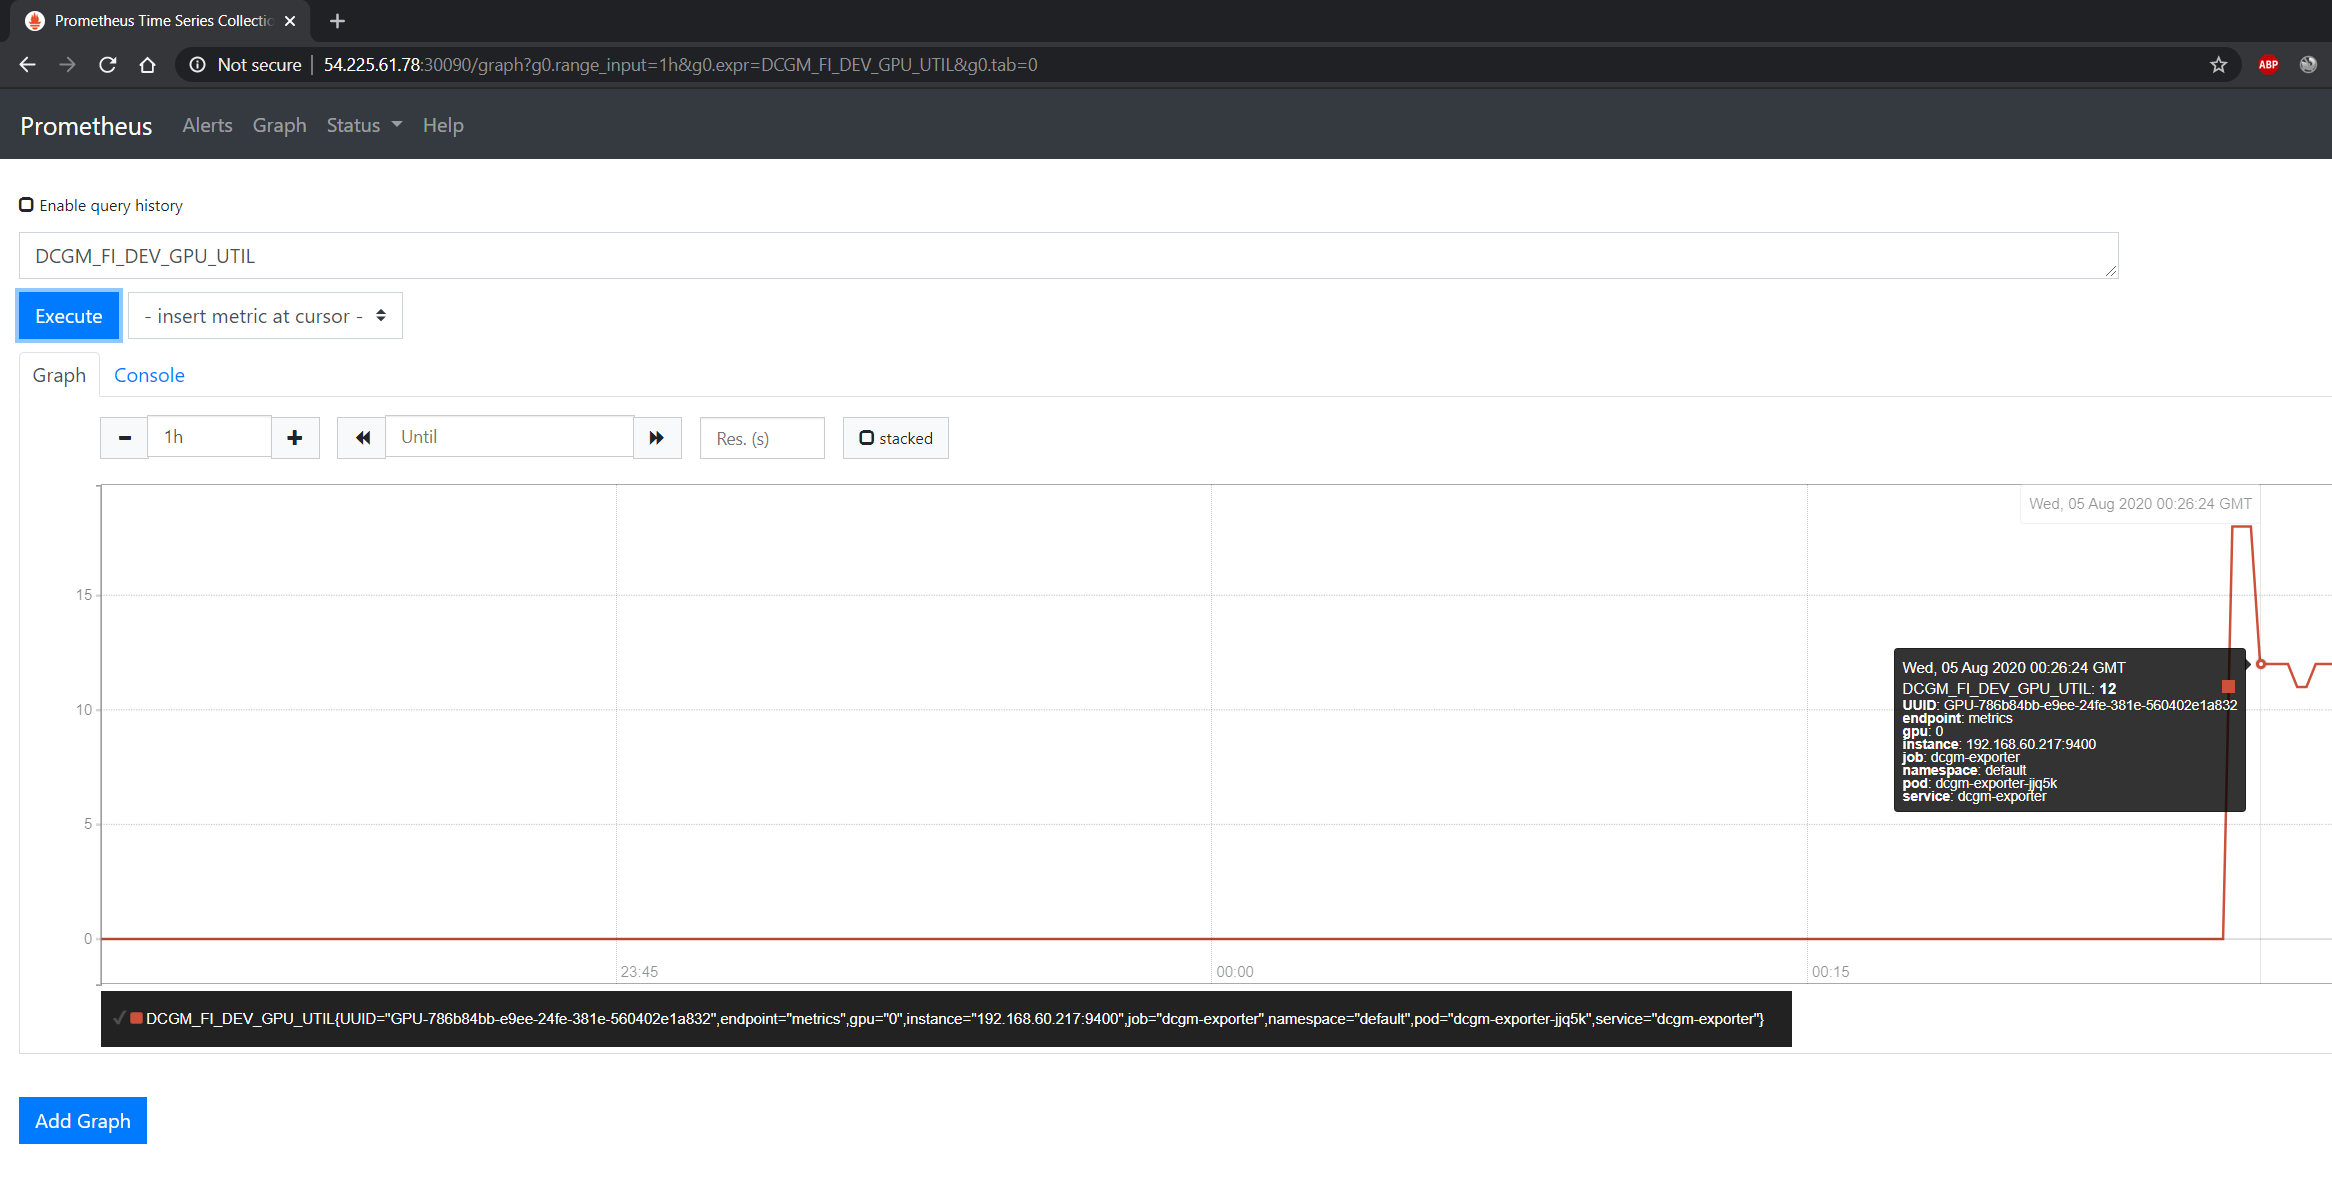
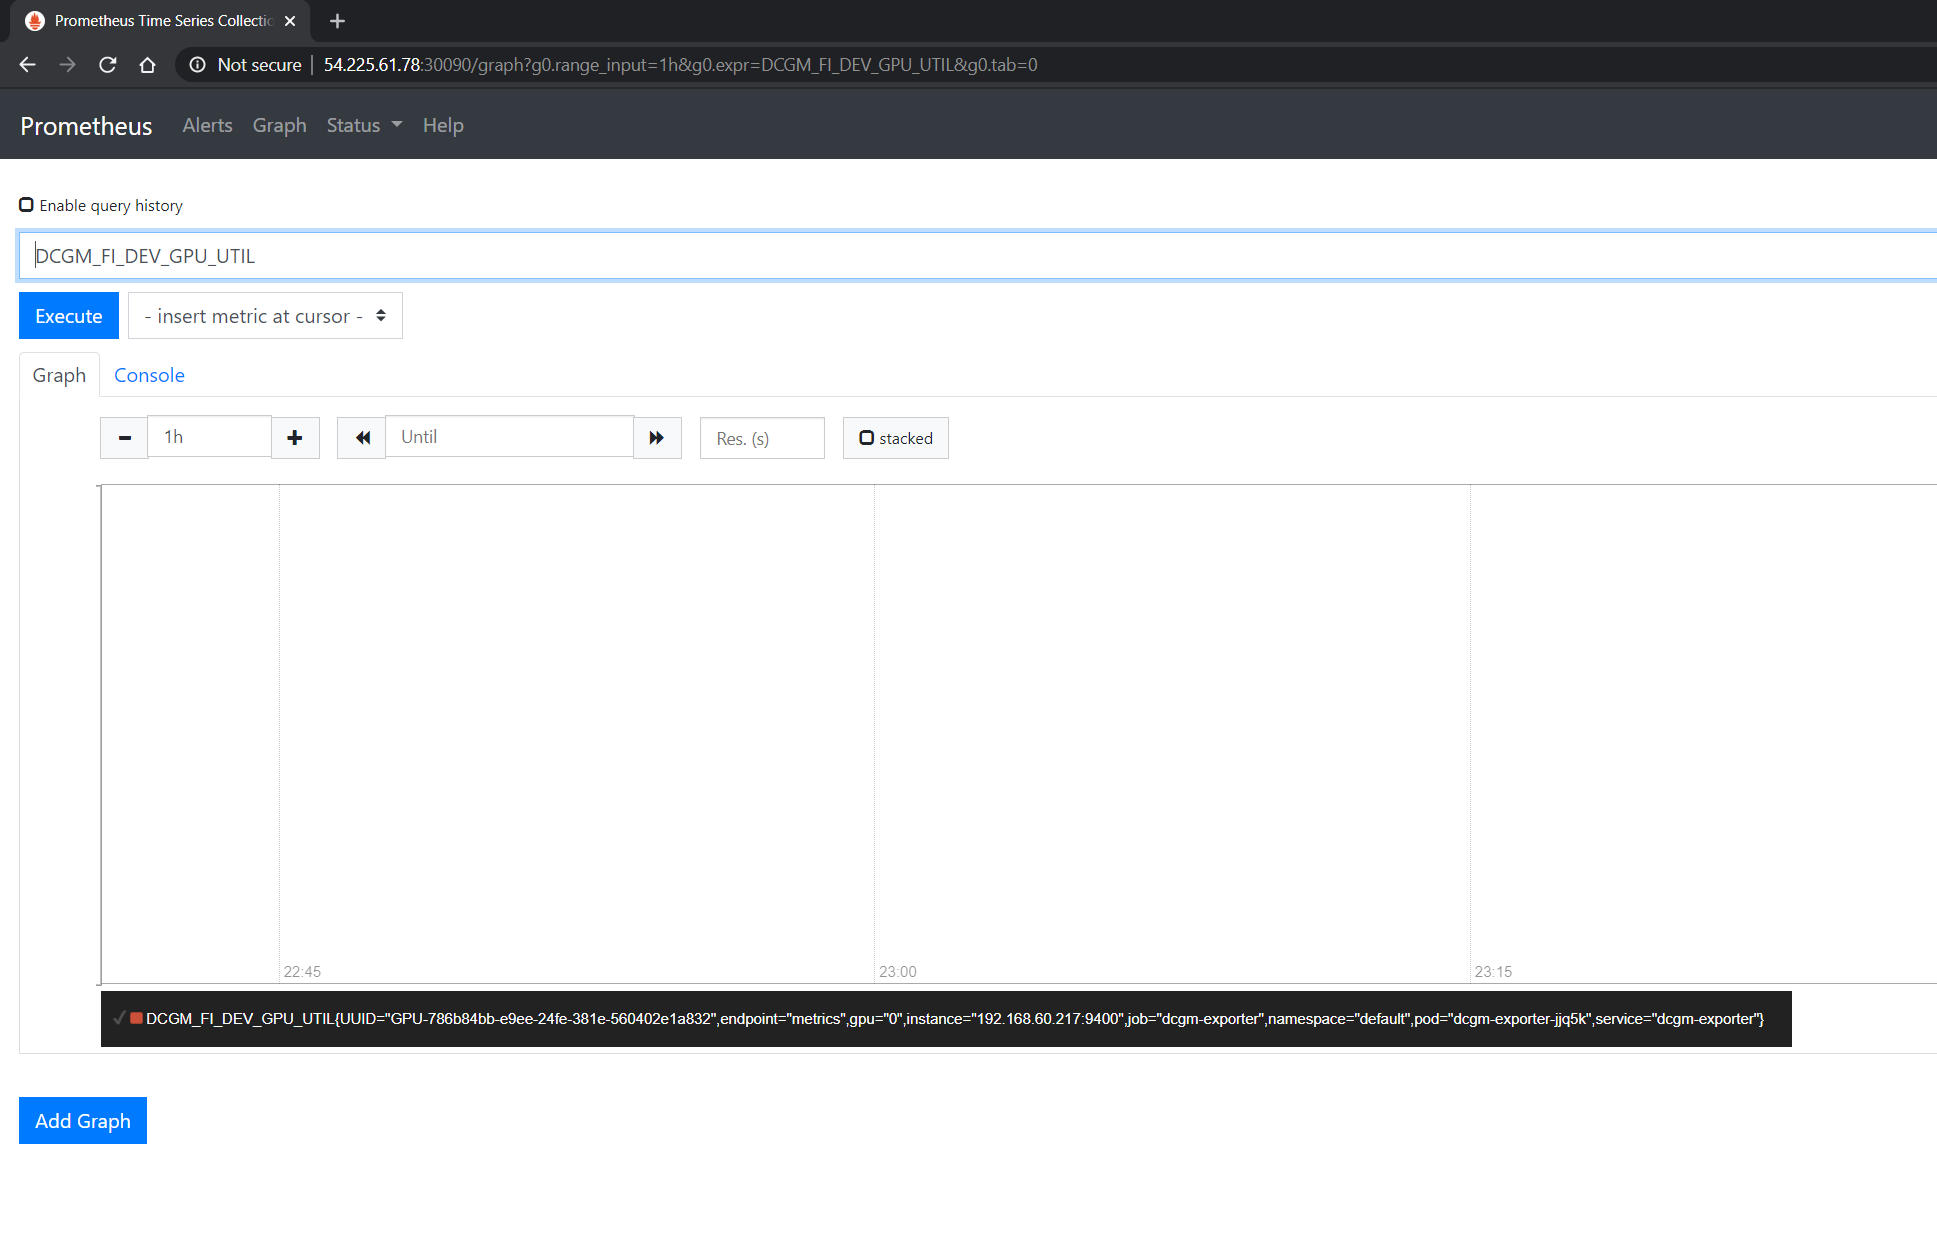
You can observe that the Prometheus server is available at port 30090 on the node’s IP address. Open your browser to http://<machine-ip-address>:30090.
It may take a few minutes for DCGM to start publishing the metrics to Prometheus. The metrics availability can be verified by typing DCGM_FI_DEV_GPU_UTIL
in the event bar to determine if the GPU metrics are visible:
Using Grafana#
You can also launch the Grafana tools for visualizing the GPU metrics.
There are two mechanisms for dealing with the ports on which Grafana is available - the service can be patched or port-forwarding can be used to reach the home page. Either option can be chosen based on preference.
Patching the Grafana Service
By default, Grafana uses a ClusterIP to expose the ports on which the service is accessible. This can be changed to a NodePort instead, so the page is accessible
from the browser, similar to the Prometheus dashboard.
You can use kubectl patch to update the service API
object to expose a NodePort instead.
First, modify the spec to change the service type:
$ cat << EOF | tee grafana-patch.yaml
spec:
  type: NodePort
  nodePort: 32322
EOF
And now use kubectl patch:
$ kubectl patch svc kube-prometheus-stack-1603211794-grafana \
   -n prometheus \
   --patch "$(cat grafana-patch.yaml)"
service/kube-prometheus-stack-1603211794-grafana patched
You can verify that the service is now exposed at an externally accessible port:
$ kubectl get svc -A
NAMESPACE     NAME                                                        TYPE        CLUSTER-IP      EXTERNAL-IP   PORT(S)                        AGE
<snip>
prometheus    kube-prometheus-stack-1603211794-grafana                    NodePort    10.109.219.60   <none>        80:30759/TCP                   32m
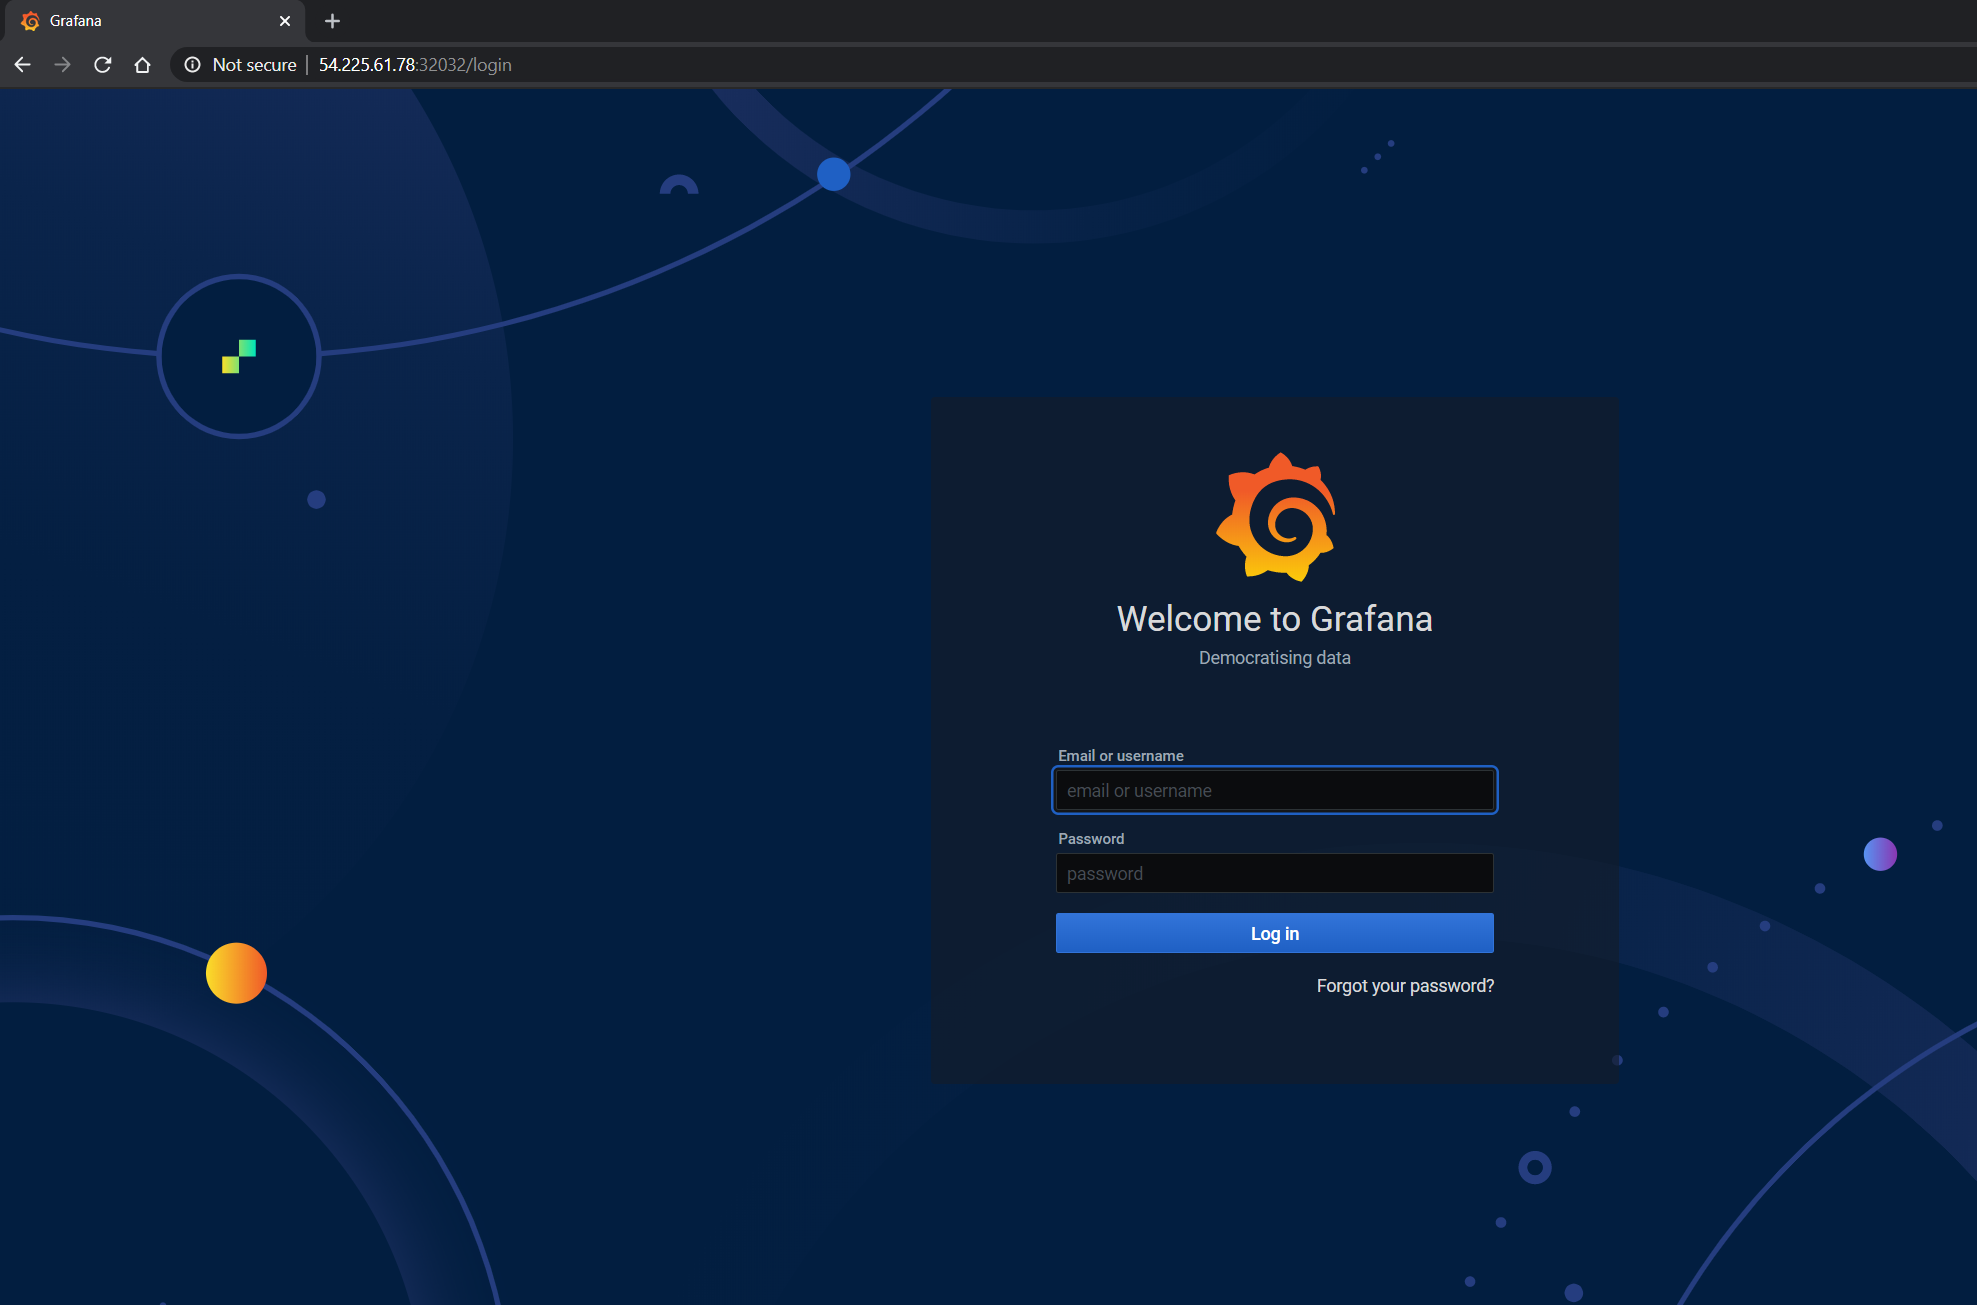
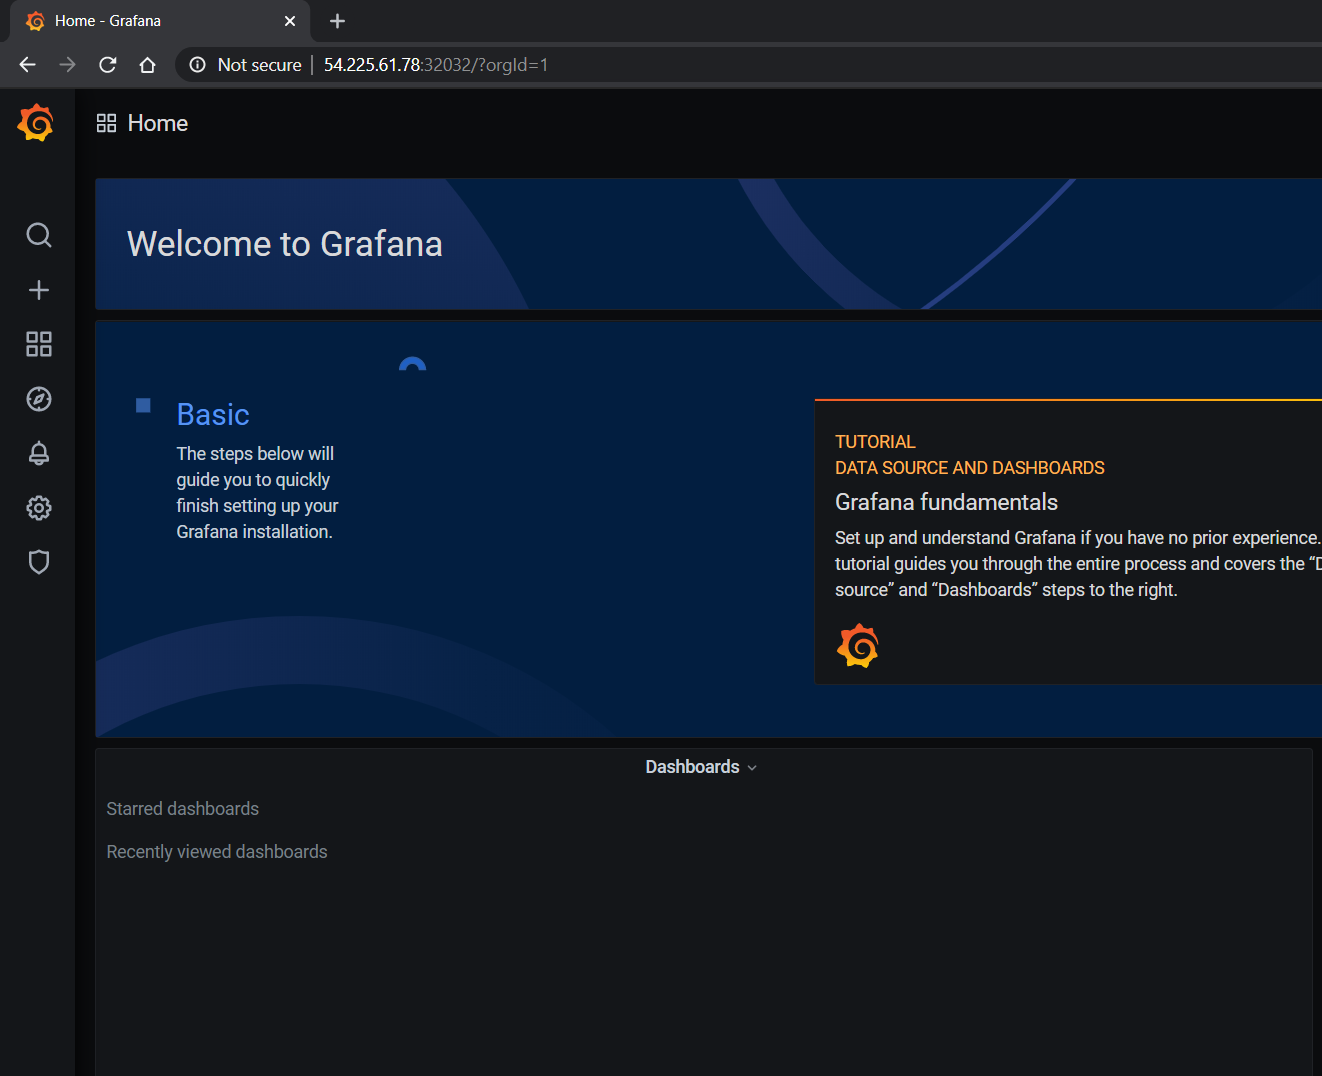
Open your browser to http://<machine-ip-address>:30759 and view the Grafana login page. Access Grafana home using the admin username.
The password credentials for the login are available in the prometheus.values file we edited in the earlier section of the doc:
## Deploy default dashboards.
##
defaultDashboardsEnabled: true

adminPassword: prom-operator
Port Forwarding
Another method to access the Grafana page would be to use port forwarding.
First, it can be observed that the Grafana service is available at port 80. We will need to port-forward the service from an abitrary port - in this example, we will forward from port 32322 on our local machine to port 80 on the service (which in turn will forward to port 3000 that the Grafana pod is listening at, as shown below):
$ kubectl port-forward svc/kube-prometheus-stack-1603211794-grafana -n prometheus 32322:80
Forwarding from 127.0.0.1:32322 -> 3000
Forwarding from [::1]:32322 -> 3000
Handling connection for 32322
If your cluster is setup on a cloud instance e.g. AWS EC2, you may have to setup an SSH tunnel between your local workstation and the instance using
port forwarding to view the Grafana tool in your local workstation’s browser. For example, on Windows you can use PuTTY to open an SSH tunnel and specify the
source port as 32322 and destination as localhost:32322 under the Tunnels sub-menu in the SSH menu.
Open your browser and point to http://localhost:32322/ to view the Grafana login page using the same credentials in the previous section.
DCGM Dashboard in Grafana#
To add a dashboard for DCGM, you can use a standard dashboard that NVIDIA has made available, which can also be customized.
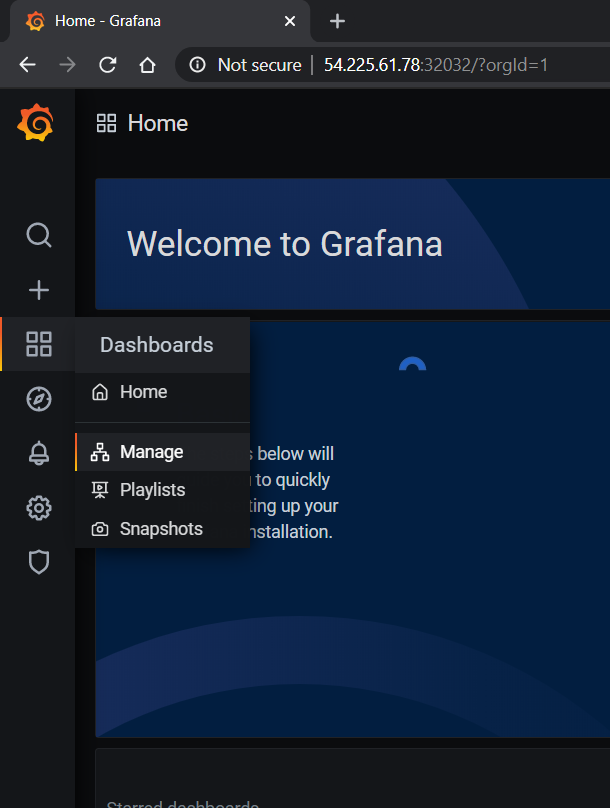
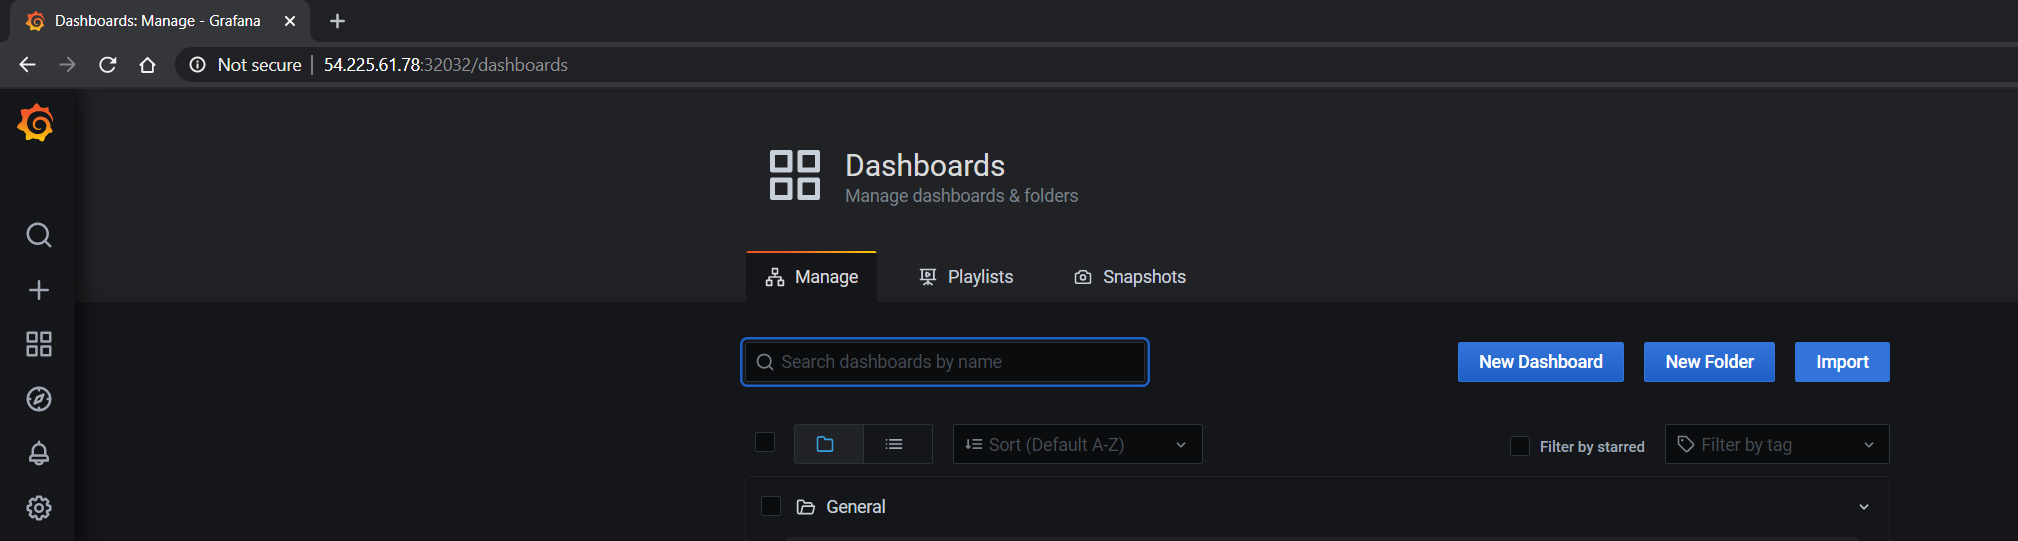
To access the dashboard, navigate from the Grafana home page to Dashboards -> Manage -> Import:
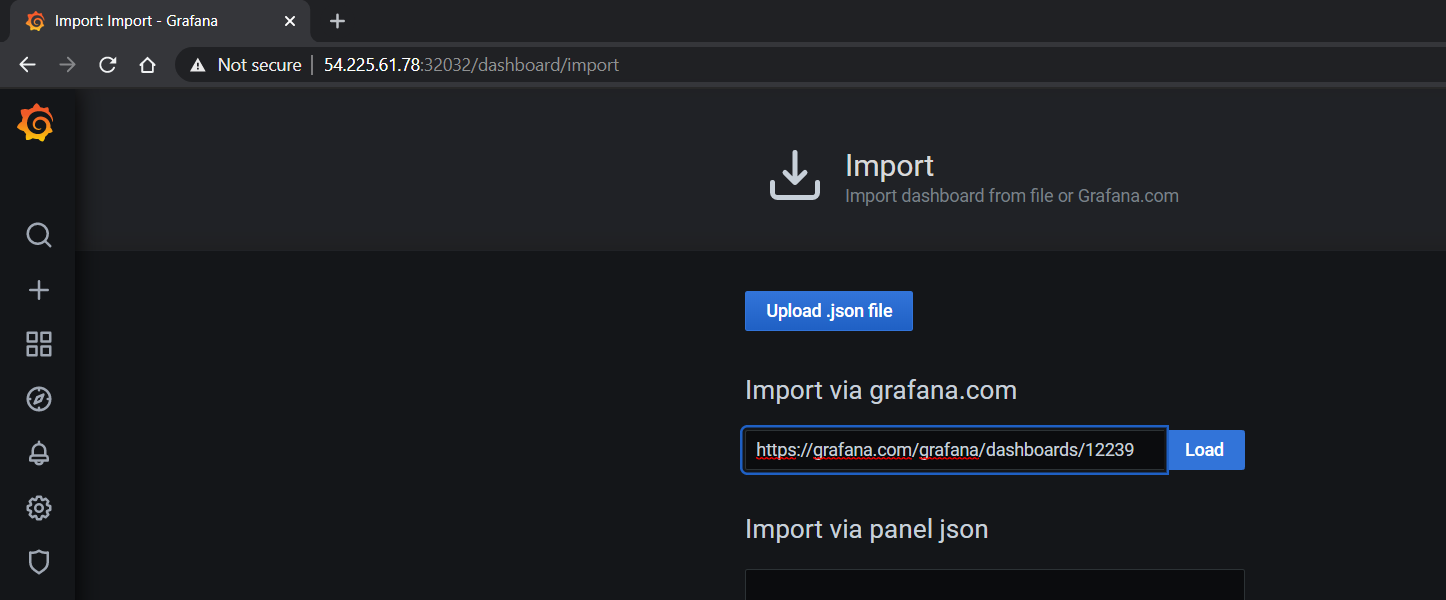
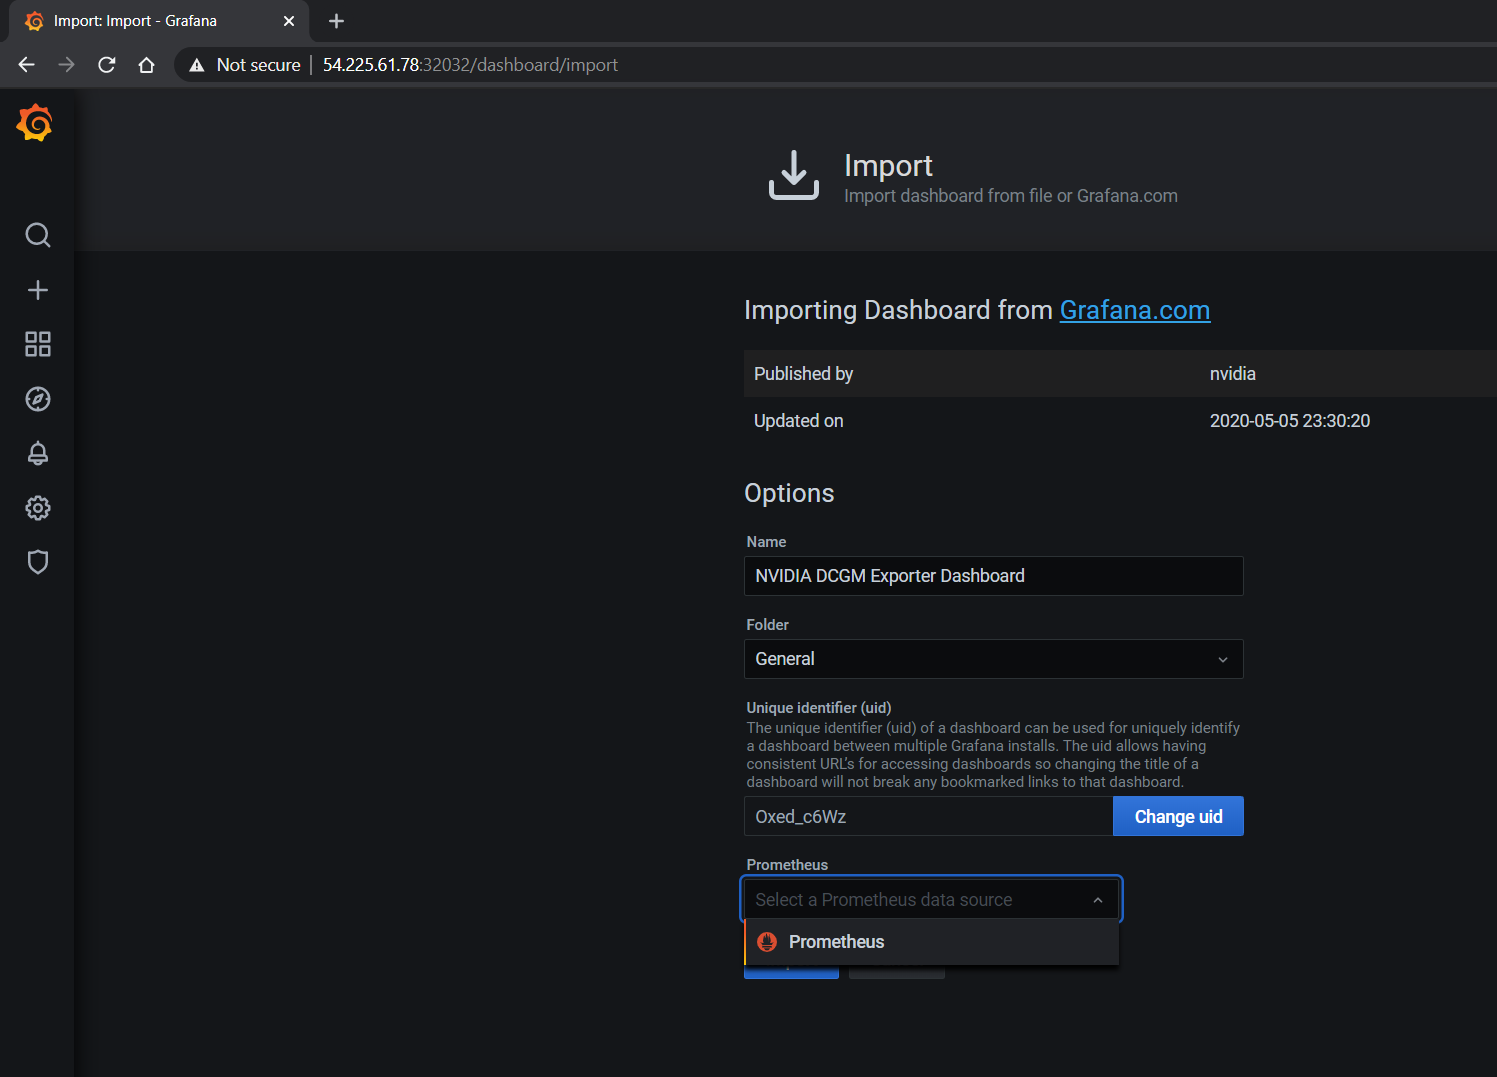
Import the NVIDIA dashboard from https://grafana.com/grafana/dashboards/12239
and choose Prometheus as the data source in the drop down:
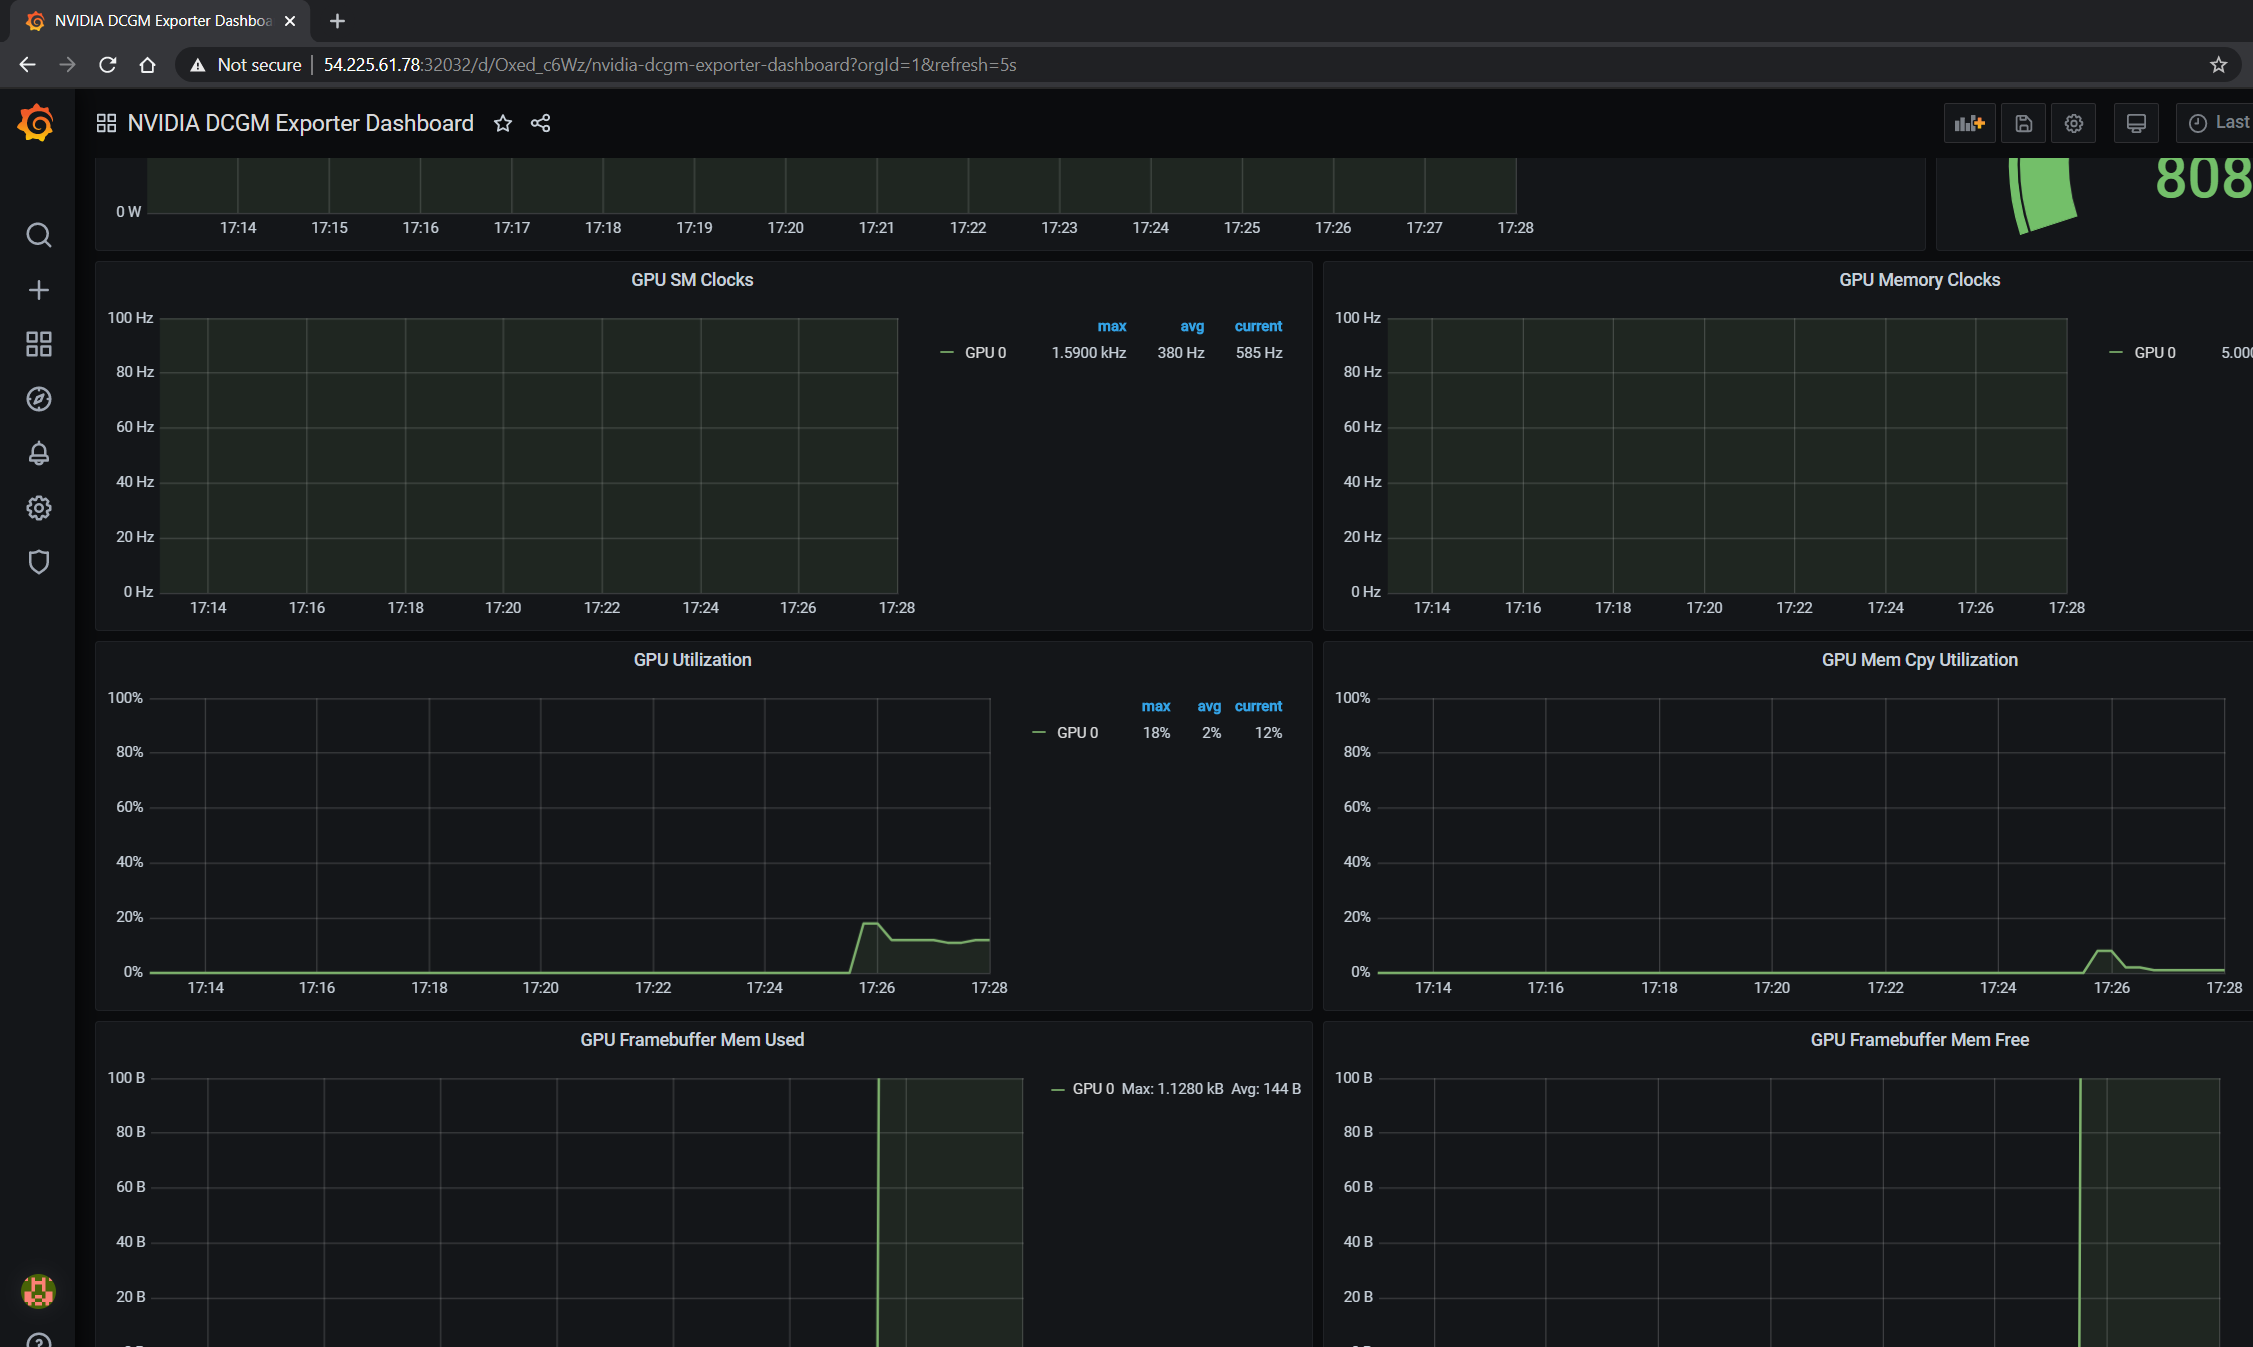
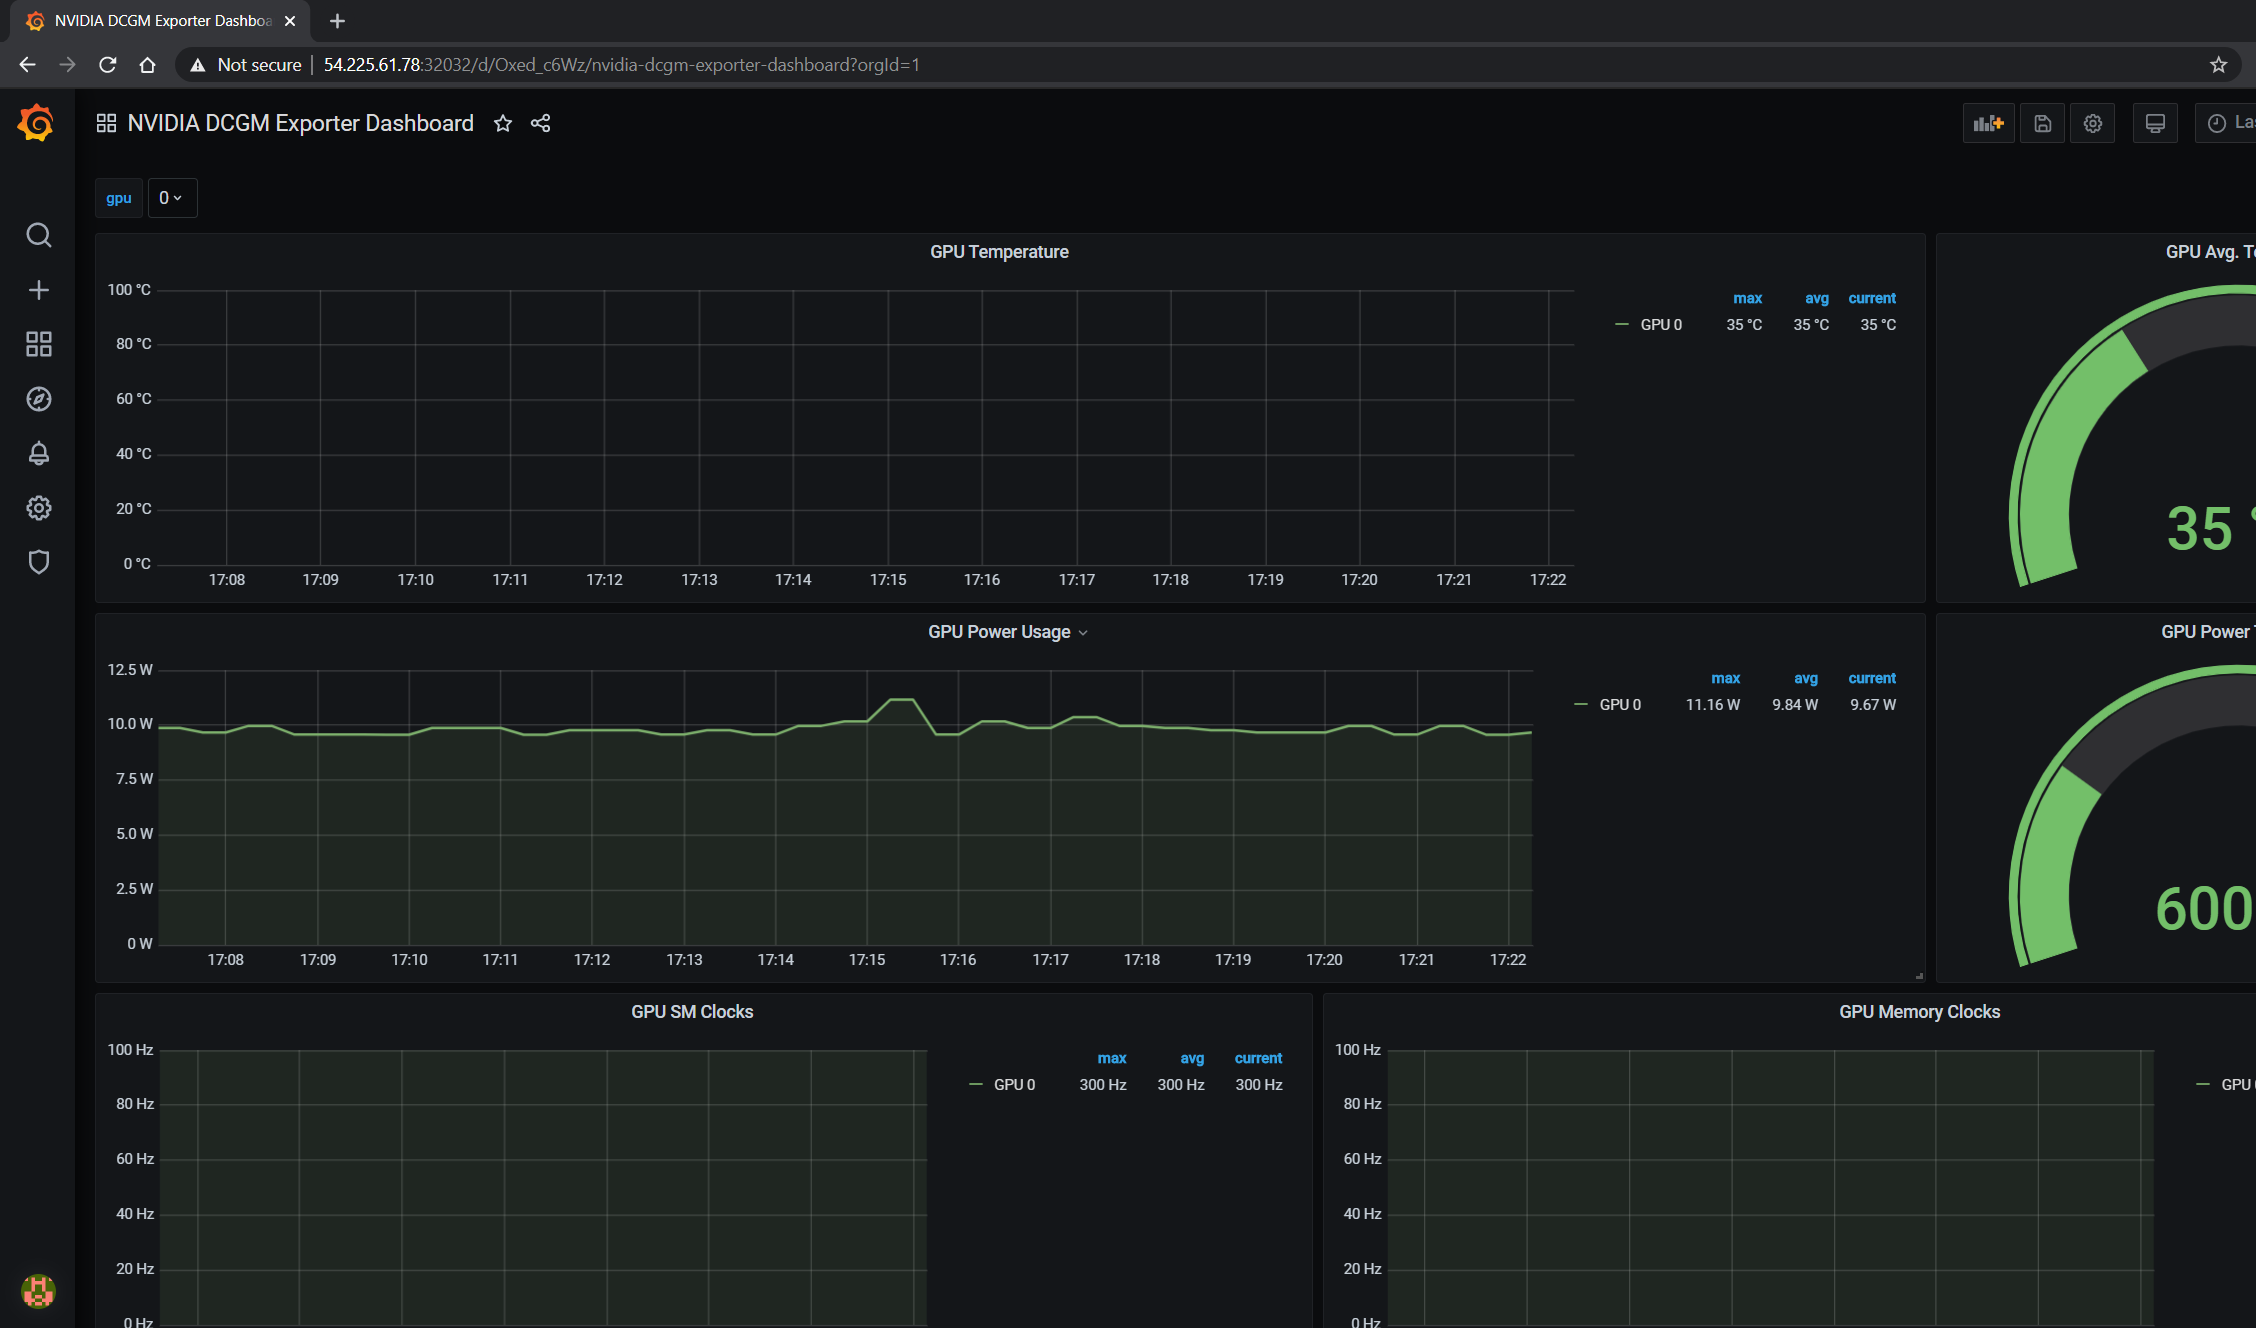
The GPU dashboard will now be available on Grafana for visualizing metrics:
Viewing Metrics for Running Applications#
In this section, let’s run a more complicated application and view the GPU metrics on the NVIDIA dashboard.
We can use the standard DeepStream Intelligent Video Analytics Demo available on the NGC registry. For our example, let’s use the Helm chart to use the WebUI:
$ helm fetch https://helm.ngc.nvidia.com/nvidia/charts/video-analytics-demo-0.1.4.tgz && \
   helm install video-analytics-demo-0.1.4.tgz --generate-name
NAME: video-analytics-demo-0-1596587131
LAST DEPLOYED: Wed Aug  5 00:25:31 2020
NAMESPACE: default
STATUS: deployed
REVISION: 1
NOTES:
1. Get the RTSP URL by running these commands:
export NODE_PORT=$(kubectl get --namespace default -o jsonpath="{.spec.ports[0].nodePort}" services video-analytics-demo-0-1596587131)
export NODE_IP=$(kubectl get nodes --namespace default -o jsonpath="{.items[0].status.addresses[0].address}")
echo rtsp://$NODE_IP:$NODE_PORT/ds-test

2.Get the WebUI URL by running these commands:
export ANT_NODE_PORT=$(kubectl get --namespace default -o jsonpath="{.spec.ports[0].nodePort}" services video-analytics-demo-0-1596587131-webui)
export NODE_IP=$(kubectl get nodes --namespace default -o jsonpath="{.items[0].status.addresses[0].address}")
echo http://$NODE_IP:$ANT_NODE_PORT/WebRTCApp/play.html?name=videoanalytics
Disclaimer:
Note: Due to the output from DeepStream being real-time via RTSP, you may experience occasional hiccups in the video stream depending on network conditions.
The demo can be viewed in the browser by pointing to the address following the instructions above.
The GPU metrics are also visible either in the Grafana dashboard or the Prometheus dashboard as can be seen in the following screenshots showing GPU utilization, memory allocated as the application is running on the GPU: