

Topology and NVLink#
Inventory establishes which entities the host engine knows about. Topology and link information explain how those entities are related and what happened on their interconnects. These views answer different questions and should be used together.
View |
Question |
Boundary |
|---|---|---|
GPU topology |
Which CPU cores and other GPUs are close to this GPU? |
Describes known CPU, PCIe, and direct-NVLink relationships; does not reserve hardware or test bandwidth. |
NVLink status |
Is each supported GPU or NVSwitch port up, down, or disabled now? |
Point-in-time port state; does not decide whether a port is expected to be used. |
Error counters |
Did an error total increase during an interval? |
Passive evidence; does not identify root cause or validate the path under load. |
Traffic and error fields |
How do selected link measurements change over time? |
Watched telemetry with the cadence, support, and retention rules of the field service. |
Diagnostics |
Can the path operate correctly under an active test? |
A separate, intrusive workflow with plugin-specific requirements. |
Begin with Entities and Groups to discover the GPUs, switches, and link entities. Read Fields and Watches before designing repeated link monitoring.
How NVLinks Are Represented#
An NVLink connects one port on a GPU or NVSwitch to a peer port. Port numbers are local to their parent device. Several links can connect the same pair of GPUs, and an NVSwitch can join many GPU-facing links into a switched fabric.
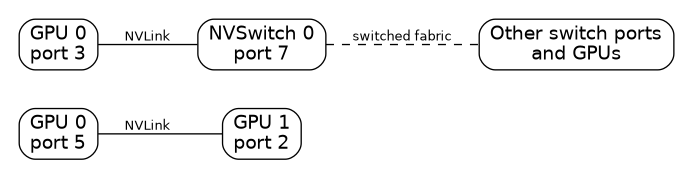
NVLink endpoints in direct and switched connections#
A DCGM_FE_LINK entity represents one endpoint, not the entire end-to-end
route. DCGM accepts three selector forms:
gpu_link:<gpu-id>:<port-index>for a GPU endpoint;switch_link:<switch-id>:<port-index>for an NVSwitch endpoint; andlink:<packed-id>for the packed entity ID printed by DCGM.
Enumerate current port IDs instead of guessing them:
$ dcgmi nvlink --link-status --show-entity-ids
Structured selectors are easier to read in commands. Packed IDs are useful when a program consumes enumeration output.
Read GPU Topology#
Query one GPU when choosing CPUs or peer GPUs for a workload:
$ dcgmi topo --gpuid 0
The report contains:
CPU Core AffinityCPU cores local to the GPU. The report does not bind the process to those cores.
To GPU <id>The PCIe relationship to another GPU, such as an on-board switch, one or more PCIe switches, a PCIe host bridge, or a CPU-level link.
NVLinkWhen present, the number of direct links and GPU-local port IDs in that GPU-to-GPU relationship.
Use a group query after selecting all GPUs considered for a workload:
$ dcgmi topo --group <group-id>
The group view summarizes CPU affinity, whether all members are NUMA-optimal, and the slowest PCIe relationship among their pairs. It does not show all pairwise detail, so return to per-GPU queries when the summary is unexpected.
Topology can be unsupported. Even when available, it describes relationships known to DCGM; it does not predict application performance, prove that every link is currently active, or measure bandwidth. Use link status for current port state and diagnostics for an active path test.
Inspect Current Link State#
Display all GPU and NVSwitch ports known to the host engine:
$ dcgmi nvlink --link-status --show-entity-ids
The command prints one character for every physical port position:
Character |
State |
Interpretation |
|---|---|---|
|
Up |
The supported link is active. |
|
Down |
A supported port currently has a down link. |
|
Disabled |
The supported link has been disabled. |
|
Not supported |
No supported link exists at this port index. |
An underscore is a port position, not a failed link. A disabled port can also
be intentional for a platform. Compare D or X with the system’s
supported topology and with the peer endpoint before treating it as a fault.
DCGM observes the fabric; it does not configure an NVSwitch fabric or bring a link up. On systems that require Fabric Manager or another platform service, that software remains responsible for fabric configuration. Check its state and logs when DCGM reports an unexpected path.
The status command is point-in-time. Use the Health module when an operator needs passive monitoring and a retained health judgment for link-down or NVSwitch conditions.
Compare NVLink Error Counters#
Request the concise error report for one GPU:
$ dcgmi nvlink --errors --gpuid 0
DCGM chooses a generation-appropriate field set and presentation:
GPU generation |
Organization |
Examples of reported values |
|---|---|---|
Hopper and older |
A section for each supported link. |
CRC FLIT, CRC data, replay, and recovery error totals. |
Blackwell and newer |
A GPU-level error-detail section. |
Malformed packet, buffer overrun, receive, remote receive, transmit discard, link integrity, symbol BER, and effective BER or error values. |
The command reads current values and does not clear them. Unsupported legacy links are omitted. A blank Blackwell value can also be omitted, so an absent row is not necessarily a zero.
Most error values are cumulative. An isolated nonzero number cannot show when the event occurred. Capture the same report immediately before and after the activity of interest:
$ dcgmi nvlink --errors --gpuid 0
# Run the workload or test interval.
$ dcgmi nvlink --errors --gpuid 0
Compare corresponding fields. An unchanged total is historical evidence; an increase belongs to the interval but still needs context from the peer, link state, platform logs, and workload behavior.
Watch Traffic and Error Fields#
Use field monitoring when the concise report does not provide the entity, field set, cadence, or history needed by the investigation.
DCGM 4.6 provides NVLink COUNT fields in these ranges:
1200-1219 for packet, byte, and error counters; and
1404-1419 for FEC history buckets.
Use dcgmi dmon --list or
Field Identifiers for exact names, types, and units.
Representative fields include transmitted packets (1200), transmitted bytes
(1201), received packets (1202), received bytes (1203), malformed received
packets (1204), received packets dropped because of buffer overrun (1205), and
effective errors (1219).
The fields in these two ranges require NVLink 5 or newer. On NVLink 4 and
older, both GPU-level and link-entity queries return N/A. The following
examples assume supported NVLink 5+ hardware and compare transmitted and
received packet totals.
For a GPU entity, DCGM requests NVML’s aggregate across all links:
$ dcgmi dmon --field-id 1200,1202 --entity-id gpu:0
The same fields can also be read for an individual link entity:
$ dcgmi dmon --field-id 1200,1202 \
    --entity-id gpu_link:0:5
Range selectors make a port comparison concise:
$ dcgmi dmon --field-id 1200,1202 \
    --entity-id 'gpu_link:0:{0-5}'
A field’s presence in the catalogue does not guarantee support for a
particular GPU or link; unsupported selections also display N/A.
Apply normal counter rules: take a baseline, preserve timestamps, and compute a delta over a defined interval. If traffic is needed as a rate, divide the counter delta by the elapsed time between the two samples; do not divide by the requested watch interval unless the timestamps confirm it.
Workflow: Investigate an NVLink Path#
Suppose a multi-GPU workload reports unexpectedly low communication performance.
Discover the current GPU identities and the group used by the workload:
$ dcgmi discovery --list
$ dcgmi group --group <group-id> --info
Read per-GPU topology to identify expected peer relationships and local port IDs:
$ dcgmi topo --gpuid 0
$ dcgmi topo --gpuid 1
Capture both endpoints’ link state:
$ dcgmi nvlink --link-status --show-entity-ids
Capture error baselines for both GPUs, run the workload interval, and capture the reports again:
$ dcgmi nvlink --errors --gpuid 0
$ dcgmi nvlink --errors --gpuid 1
If more timing or port detail is needed, watch supported COUNT fields for the identified GPU or link entities.
Compare unexpected states or deltas with the peer endpoint, Fabric Manager or platform-service state, kernel and service logs, and Health results.
Use Diagnostics when active path validation is appropriate. Topology, status, and counters alone do not generate load or prove end-to-end performance.
Further Reading#
dcgmi topo defines topology output and PCIe path classifications.
dcgmi nvlink defines link-state and concise error-report output.
dcgmi dmon defines repeated field sampling.
Health Monitoring explains passive link and interconnect health.
NVSwitch and ConnectX introduces NVSwitch and ConnectX-specific functionality.