Monitoring Cluster Devices#
The cluster manager monitoring allows a cluster administrator to monitor anything that can be monitored in the cluster. Much of the monitoring consists of predefined sampling configurations. If there is anything that is not configured, but the data on which it is based can be sampled, then monitoring can be configured for it too, by the administrator.
The monitoring data can be viewed historically, as well as on demand. The historical monitoring data can be stored raw, and optionally also as consolidated data—a way of summarizing data.
The data can be handled raw and processed externally, or it can be visualized within Base View in the form of customizable charts. Visualization helps the administrator spot trends and abnormal behavior and is helpful in providing summary reports for managers.
Monitoring can be configured to set off alerts based on triggers, and predefined or custom actions can be conducted automatically, depending on triggers. The triggers can be customized according to user-defined conditional expressions.
Conducting such actions automatically after having set up triggers for them means that the monitoring system can free the administrator from having to carry out these chores.
In this chapter, the monitoring system is explained with the following approach:
A basic example is first presented in which processes are run on a node. These processes are monitored and trigger an action when a threshold is exceeded.
With this easy-to-understand example as a basic model, the various features and associated functionality of the cluster manager monitoring system are then described and discussed in further depth. These include visualization of data, concepts, configuration, monitoring customization and cmsh use.
Basic Monitoring Example and Action#
The example in this section is designed to present a basic illustration of what the monitoring system is capable of handling. This example describes a structure around which further details are fitted and filled in during the coverage in the rest of this chapter.
Synopsis Of Basic Monitoring Example#
In this example, a user is running an artificial CPU-intensive process on a head node that is normally very lightly loaded. An administrator can monitor user mode CPU load usage throughout the cluster and notices this usage spike. After getting the user to stop wasting CPU cycles, the administrator may decide that putting a stop to such processes automatically is a good idea. The administrator can set that up with an action that is triggered when a high load is detected. The action that is taken after triggering, is to stop the processes (Figure 9).
Figure 9. CPU-intensive processes started, detected, and stopped
Setting Up the Pieces#
Running Artificial Loads#
One way to simulate a user running CPU-intensive processes is to run several instances of the standard unix utility, yes. The yes command sends out an endless number of lines of y texts. It is typically used in scripts to answer dialog prompts for confirmation. The administrator can run eight subshell processes in the background from the CLI on the head node, with yes output sent to /dev/null:
1for i in {1..8}; do ( yes > /dev/null &); done
Running mpstat 2 shows usage statistics for each processor, updating every two seconds. It shows that %user, which is user mode CPU usage percentage, is close to 90% on an eight-core or less head node when the eight subshell processes are running.
Setting Up the Kill Action#
To stop the artificial CPU-intensive yes processes, the killall yes command can be used. The administrator can make it a part of a script killallyes:
1#!/bin/bash killall yes
and make the script executable with a chmod 700 killallyes. For convenience, it may be placed in the /cm/local/apps/cmd/scripts/actions directory where some other action scripts also reside.
Using the Basic Monitoring Example#
Now that the pieces are in place, the administrator can use Base View to add the killallyesaction action to its action list, and then set up a trigger for the action.
Adding the Action to the Actions List#
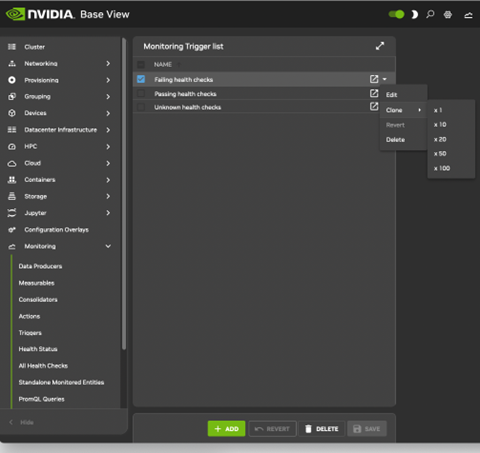
Clickpath Monitoring>Actions>Monitoring Actions>killprocess>Clone is used to clone the structure of an existing action. The killprocess action is convenient because it is expected to function in a similar way, so its options should not have to be modified much. However, any action could be cloned, and the clone modified in appropriate places.
The name of the cloned action is changed. That is, the administrator sets Name to killallyesaction. The name of the file is arbitrary.
Script is set to the path /cm/local/apps/cmd/scripts/actions/killallyes, which is where the script was placed earlier.
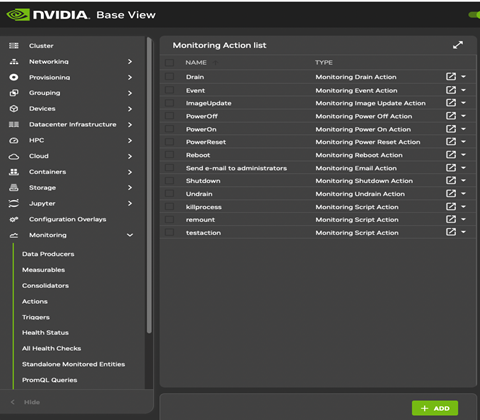
After saving, the killallyesaction action becomes part of the list of monitoring actions (Figure 10).
Figure 10. Base View monitoring configuration: adding an action
Setting Up a Trigger Using CPUUser on the Login Node#
Clickpath Monitoring>Triggers>Failing health checks>Clone can be used to configure a monitoring trigger by cloning an existing trigger. A trigger is a sample state condition that runs an action. In this case, the sample state condition may be that the metric (Section 6.2.1.8) CPUUser must not exceed 50. If it does, then an action (killallyesaction) is run, which should kill the yes processes.
CPUUser is a measure of the time spent in user mode CPU usage per second and is measured in jiffy intervals per second.
A jiffy interval is a somewhat arbitrary time interval that is predefined for kernel developers per platform. It is the minimum amount of time that a process has access to the CPU before the kernel can switch to another task.
Unlike %user from the top command, a jiffy interval is not a percentage.
To configure the trigger attributes:
Goto the Monitoring Trigger list screen. Clickpath Monitoring>Triggers>Failing health checks
Set a name for the trigger. The name is arbitrary. killallyestrigger is used in this example.
Configure Enter actions so the trigger can run an action script if the sample state crosses over into a state that meets the trigger condition.
Configure the condition under which the Enter actions action script is run. The condition can be set by setting an expression in the expression subwindow. For example, when CPUUser on the head node is above 50.
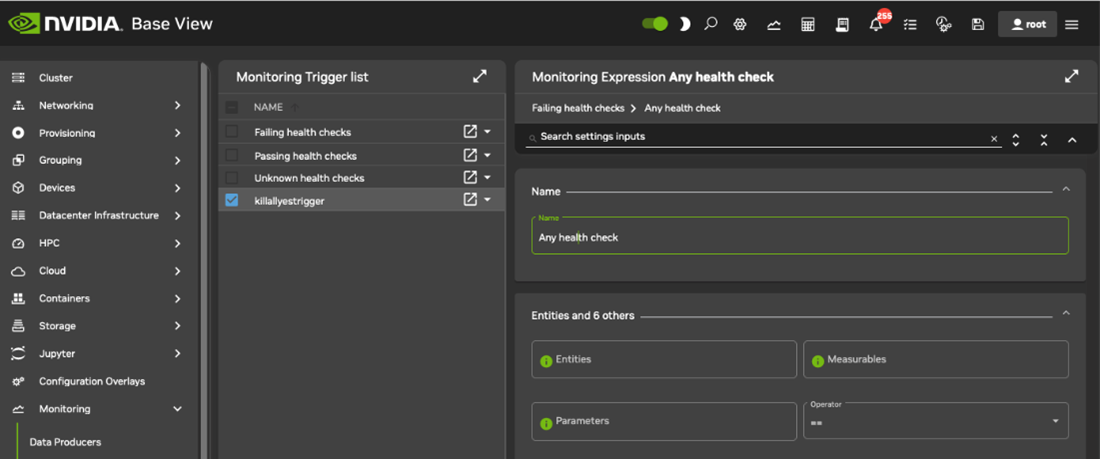
Set the name for the trigger. The name is arbitrary, and killallyestrigger is used in this example.
Set the Name for the expression. Name is arbitrary, and killallyesregex is in this example.
Set the entity. In this case, the entity being monitored is the head node. If the head node is called headnode in this example, then headnode is the value set for entities. An entity is often simply a device, but it can be any object that CMDaemon stores.
Set Measurables. In this case, CPUUser is used.
Set an operator and threshold. In this case GT, which is the greater than operator, and 50 that is a significant amount of CPUUser time in jiffies/s, are set for Operator and Value.
Enable the trigger to activate it.
After saving the configuration, the killallyesregex regular expression evaluates the data being sampled for the trigger. If the expression is TRUE, then the trigger launches the killallyesaction action.
The Result#
In the preceding section, an action was added, and a trigger was set up with a monitoring expression. With a default installation on a newly installed cluster, the measurement of CPUUser is done every 120s (the period can be modified in the Data Producer window of Base View, as seen in Figure 12.9 of the Bright Cluster Manager Administrator Manual. The basic example configured with the defaults thus monitors if CPUUser on the head node has crossed the bound of 50 jiffies/s every 120s.
If CPUUser is found to have entered—that is crossed over from below the value and gone into the zone beyond 50 jiffies—then the killallyesregex regular expression notices that. Then, the trigger it is configured for, killallyestrigger trigger, runs the killallyesaction action, which runs the killallyes script. The killallyes script kills all the running yes processes. Assuming the system is trivially loaded apart from these yes processes, the CPUUser metric value then drops to below 50 jiffies.
To clarify what “found to have entered” means in the previous paragraph:
After an Enter trigger condition has been met for a sample, the first sample immediately after that does not ever meet the Enter trigger condition, because an Enter threshold crossing condition requires the previous sample to be below the threshold.
The second sample can only launch an action if the Enter trigger condition is met and if the preceding sample is below the threshold.
Other non-yes CPU-intensive processes running on the head node can also trigger the killallyes script. Since the script only kills yes processes, leaving any non-yes processes alone, it would in such a case run unnecessarily. This is a deficiency due to the contrived and simple nature of the basic example that is being illustrated here. In a production case, the action script is expected to have a more sophisticated design.
The following sections in this chapter cover the concepts and features for the cluster manager monitoring in greater detail.
Monitoring Concepts and Definitions#
A discussion of the concepts of monitoring, along with definitions of terms used, is appropriate at this point. The features of the monitoring system in the cluster manager covered later in this chapter will then be understood more clearly.
Measurables#
Measurables are measurements (sample values) that are obtained using data producers (6.2.8) CMDaemon monitoring system. The measurements can be made for nodes, head nodes, other devices, or other entities.
Types of Measurables#
Measurables can be:
enummetrics: measurements with a small number of states. The states can be predefined, or user-defined. These are covered in 6.2.1.7.
metrics: measurements with number values, and no data, as possible values. For example, values such as: -13113143234.5, 24, 9234131299. These are covered in
health checks: measurements with the states PASS, FAIL, and UNKNOWN as possible states, and no data as another possible state, when none of the other states are set. These are covered in 6.2.2.
no data and Measurables#
If no measurements are carried out, but a sample value must be saved, then the sample value is set to no data for a measurable. This is a defined value, not a null data value. metrics and enummetrics can therefore also take the no data value.
Entities and Measurables#
Normally, a device, or a category or some similar grouping is a convenient idea to keep in mind as an entity, for concreteness.
The default entities in a new installation of the cluster manager are:
device category partition[base] software images
However, more generally, an entity can be an object from the following top-level modes of cmsh:
category ceph cloud cmjob configuration overlay device edgesight etcd fspart group jobqueue jobs kubernetes network nodegroup partition profile rack softwareimage user
For example, a software image object that is to be provisioned to a node is an entity, with some of the possible attributes of the entity being the name, kernel version, creationtime, or locked attributes of the image:
 1[root©headnode ~]# cmsh -c "software image use default-image; show"
 2Parameter                                              Value
 3-------------------------------- -----------------------------------------------
 4Creation time                                          Thu, 08 Jun 2017 18:15:13 CEST
 5Enable  SOL                                            no
 6Kernel modules                                         <44 in submode> Kernel parameters
 7Kernel version                                         3.10.0-327.3.1.el7.x86_64
 8Locked                                                         no
 9Name                                                                   default-image
10...
Because measurements can be carried out on such a variety of entities, it means that the monitoring and conditional actions that can be carried out on a cluster manager cluster can be very diverse. This makes entities a powerful and versatile concept in the cluster manager’s monitoring system for managing clusters.
Listing Measurables Used by an Entity#
In cmsh, for an entity, such as a device within device mode, a list of the measurables used by that device can be viewed with the measurables command.
1[headnode->device]% measurables dgx001
2Type                         Name                              Parameter  Class      Producer
3------------ ------------------- ---------- --------- ---------------
4Enum                         DeviceStatus                 Internal   DeviceState
5HealthCheck  ManagedServicesOk            Internal   CMDaemonState
6HealthCheck  default gateway                      Network    default gateway
7HealthCheck  diskspace                            Disk       diskspace
8HealthCheck  dmesg                                OS         dmesg
9...
The subsets of these measurables can be listed with list enum (6.2.1.7), list metric (6.2.1.8), and list healthcheck (6.2.2).
In Base View, the equivalent to listing the measurables can be conducted using clickpath Monitoring>All Health Checks.
Listing Measurables from monitoring Mode#
Similarly, under monitoring mode, within the measurable submode, the list of measurable objects that can be used can be viewed with a list command:
1[headnode->monitoring]% measurable list
2Type                         Name (key)        Parameter  Class                          Producer
3------------ ------------------- ---------- ---------------------------- ------------------
4Enum                         DeviceStatus                 Internal                       DeviceState
5HealthCheck  ManagedServicesOk            Internal                       CMDaemonState
6HealthCheck  Mon::Storage                 Internal/Monitoring/Storage  MonitoringSystem
7HealthCheck  chrootprocess                OS                             chrootprocess
8HealthCheck  cmsh                                         Internal                       cmsh
9...
The subsets of these measurables can be listed with list enum, list metric, and list healthcheck.
In Base View, the equivalent to listing the measurables can be conducted through clickpath Monitoring>Measurables and listing the subsets of the measurables is possible using column filtering.
Viewing Parameters for a measurable in monitoring Mode#
Within the measurable submode, parameters for a particular measurable can be viewed with the show command for that measurable.
 1[headnode->monitoring->measurable]% use devicestatus [headnode->monitoring->measurable[DeviceStatus]]% show
 2Parameter                                              Value
 3-------------------------------- ----------------------
 4Class                                                                  Internal
 5Consolidator                                           none
 6Description                                            The device status
 7Disabled                                                       no (DeviceState)
 8Maximal age                                            0s (DeviceState)
 9Maximal samples                                4,096 (DeviceState)
10Name                                                                   DeviceStatus
11Parameter
12Producer                                                       DeviceState
13Revision
14Type                                                                   Enum
Enummetrics#
An enummetric is a measurable for an entity that can only take a limited set of values. DeviceStatus is the only enummetric. This may change in future versions of the cluster manager. The full list of possible values for the enummetric DeviceStatus is: up, down, closed, installing, installer_failed, installer_rebooting, installer_callinginit, installer_unreachable, installer_burning, burning, unknown, opening, going_down, pending, and no data.
The enummetrics available for use can be listed from within the measurable submode of the monitoring mode:
1[headnode->monitoring->measurable]%  list  enum
2Type         Name (key)                               Parameter            Class      Producer
3------ ------------------------ ------------------- --------- -------------------
4Enum         DeviceStatus                                          Internal  DeviceState
5[headnode->monitoring->measurable]%
The list of enummetrics that is configured by an entity, such as a device, can be viewed with the enummetrics command for that entity:
1[headnode->device]% enummetrics dgx001
2Type         Name                                             Parameter            Class      Producer
3------ ------------------------ ------------------- --------- -------------------
4Enum         DeviceStatus                                          Internal  DeviceState
5[headnode->device]%
The states that the entity has been through can be viewed with the dumpmonitoringdata command:
1[headnode->device]% dumpmonitoringdata -99d now devicestatus dgx001
2Timestamp                                       Value        Info
3-------------------------- ----------- ----------
42017/07/03 16:07:00.001    down
52017/07/03 16:09:00.001    installing
62017/07/03 16:09:29.655    no data
72017/07/03 16:11:00       up
82017/07/12 16:05:00       up
The parameters of an enummetric such as devicestatus can be viewed and set from monitoring mode, from within the measurable submode (6.2.1.6).
Metrics#
A metric for an entity is typically a numeric value for an entity. The value can have units associated with it.
In the example of 6.1, the metric value considered was CPUUser, measured at the default regular time intervals of 120s.
The value can also be defined as no data. no data is substituted for a null value when there is no response for a sample. no data is not a null value once it has been set. This means that there are no null values stored for monitored data.
Other examples for metrics are:
LoadOne (value is a number, for example: 1.23).
WriteTime (value in ms/s, for example: 5 ms/s).
MemoryFree (value in readable units, for example: 930 MiB, or 10.0 GiB).
A metric can be a built-in, which means it comes with the cluster manager as integrated code within CMDaemon. This is based on c++ and is therefore much faster than the alternative. The alternative is that a metric can be a standalone script, which means that it typically can be modified more easily by an administrator with scripting skills.
The word metric is often used to mean the script or object associated with a metric as well as a metric value. The context makes it clear that is meant.
Metrics in use can be viewed in cmsh using the list command from monitoring mode:
1[headnode->monitoring]% measurable list metric
2Type                Name (key)                         Parameter       Class               Producer
3------- ------------------------ -------------- ------------------ -------------
4Metric  AlertLevel                     count           Internal             AlertLevel
5Metric  AlertLevel                     maximum         Internal             AlertLevel
6...
In Base View, the metrics can be viewed with clickpath Monitoring>Measurables and then clicking on the filter widget to select Metric. A list of metrics in use by an entity can be viewed in cmsh using the metrics command for that entity.
For example, for the entity dgx001 in mode devices:
1[headnode->devices]% metrics dgx001
2Type                Name                                       Parameter       Class     Producer
3------- ------------------------ -------------- --------- --------------
4Metric  AlertLevel                     count           Internal  AlertLevel
5Metric  AlertLevel                     maximum         Internal  AlertLevel
6...
The parameters of a metric such as AlertLevel:count can be viewed and set from monitoring mode, from within the measurable submode, just as for the other measurables:
 1[headnode->monitoring->measurable]% use alert level:count
 2[headnode->monitoring->measurable[AlertLevel:count]]% show
 3Parameter                                              Value
 4-------------------------------- ----------------------
 5Class                                                                  Internal
 6Consolidator                                           default
 7Cumulative                                             no
 8Description                                            Number of active triggers
 9Disabled                                                       no
10Maximal age                                            0s
11Maximal samples                                0
12Maximum                                                        0
13Minimum                                                        0
14Name                                                                   AlertLevel
15Parameter                                              count
16Producer                                                       AlertLevel
17Revision
18Type                                                                   Metric
The equivalent Base View clickpath to edit the parameters is Monitoring>Measurables>Edit.
Health Check#
A health check value is a response to a check conducted on an entity. The response indicates the health of the entity for that check. For example, the ssh2node health check, which runs on the head node to check if the SSH port 22 passwordless access to regular nodes is reachable. A health check is run at a regular time interval, and can have the following possible values:
PASS: the health check succeeded. For example, if ssh2node is successful, which suggests that an ssh connection to the node is fine.
FAIL: the health check failed. For example, if ssh2node was rejected. This suggests that the ssh connection to the node is failing.
UNKNOWN: the health check had an unknown response. For example, if ssh2node has a timeout, due to routing or other issues, it means that it is unknown whether the connection is fine or failing. The administrator should investigate this further.
no data: the health check did not run, so no data was obtained. For example, if ssh2node is disabled for some time, then no data values were obtained during this time. Since the health check is disabled, it means that no data cannot be recorded during this time by ssh2node. However, because having a no data value in the monitoring data for this situation is a good idea—explicitly knowing about having no data is helpful for various reasons—then no data values can be set, by CMDaemon, for samples that have no data.
Other examples of health checks are:
diskspace: check if the hard drive still has enough space left on it.
mounts: check mounts are accessible.
mysql: check status and configuration of MySQL is correct.
hpraid: check RAID and health status for certain HP RAID hardware
These and others can be seen in the directory: /cm/local/apps/cmd/scripts/healthchecks
Health Checks#
In Base View, the health checks that can be configured for all entities can be seen with clickpath Monitoring>Measurables and then clicking on the filter widget to select Health Check. Options can be set for each health check by clicking through using the Edit button.
All Configured Health Checks#
All configured healthchecks can be viewed using the clickpath Monitoring>All Health Checks. The view can be filtered per column.
Configured Health Checks for an Entity#
An overview can be seen for a particular entity <entity> using clickpath Monitoring>Health status>entity>Show.
Severity Levels for Health Checks, and Overriding Them#
A health check has a settable severity (6.2.5) associated with its response defined in the trigger options. For standalone health checks, the severity level defined by the script overrides the value in the trigger. For example, FAIL 40 or UNKNOWN 10, as is set in the hpraid health check (/cm/local/apps/cmd/scripts/healthchecks/hpraid). Severity values are processed for the AlertLevel metric (6.2.6) when the health check runs.
Default Templates for Health Checks and Triggers#
A health check can also launch an action based on any of the response values.
Monitoring triggers have the following default templates:
The severity level is one of the default parameters for the corresponding health checks. These defaults can also be modified to allow an action to be launched when the trigger runs, for example, sending an email notification whenever any health check fails.
With the default templates, the actions are by default set for all health checks. However, specific actions that are launched for a particular measurable instead of for all health checks can be configured. To do this, one of the templates can be cloned, the trigger can be renamed, and an action can be set to launch from a trigger.
Trigger#
A trigger is a threshold condition set for a sampled measurable. When a sample crosses the threshold condition, it enters or leaves a zone that is demarcated by the threshold. A trigger zone also has a settable severity (6.2.5) associated with it. This value is processed for the AlertLevel metric (6.2.6) when an action is triggered by a threshold event. Triggers are discussed in 6.1.3.2.
Action#
In the basic example of 6.1, the action script is the script added to the monitoring system to kill all yes processes. The script runs when the condition is met that CPUUser crosses 50 jiffies. An action is a standalone script or a built-in command that is executed when a condition is met and has exit code 0 on success. The condition that is met can be:
A FAIL, PASS, UNKNOWN, or no data from a health check.
A trigger condition. This can be a FAIL or PASS for conditional expressions.
State flapping (6.2.7)
The actions that can be run are listed from within the action submode of the monitoring mode.
 1[headnode->monitoring->action]% list
 2Type                        Name (key)              Run on  Action
 3----------- ----------------        ------- ---------------------------------------------------
 4Drain                       Drain                           Active  Drain node from all WLM
 5Email                       Send e-mail     Active  Send e-mail
 6Event                       Event                           Active  Send an event to users with connected client
 7ImageUpdate ImageUpdate     Active  Update the image on the node
 8PowerOff            PowerOff                        Active  Power off a device
 9PowerOn             PowerOn                 Active  Power on a device
10PowerReset  PowerReset              Active  Power reset a device
11Reboot              Reboot                  Node    Reboot a node
12Script              killallyesaction        Node    /cm/local/apps/cmd/scripts/actions/killallyes
13Script              killprocess     Node    /cm/local/apps/cmd/scripts/actions/killprocess.pl
14Script              remount                 Node    /cm/local/apps/cmd/scripts/actions/remount
15Script              testaction              Node    /cm/local/apps/cmd/scripts/actions/testaction
16Shutdown            Shutdown                        Node    Shutdown a node
17Undrain             Undrain                 Active  Undrain node from all WLM
The Base View equivalent is accessible using clickpath Monitoring>Actions. Configuration of monitoring actions is discussed further in 6.1.3.1.
Severity#
Severity is a positive integer value that the administrator assigns for a trigger. It takes one of six suggested values (Figure 1).
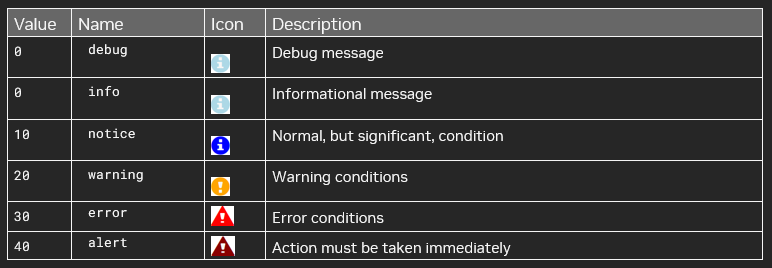
Figure 1 Severity values#
Severity levels are used in the AlertLevel metric (6.2.6). They can also be set by the administrator in the return values of health check scripts (6.2.2). By default, the severity value is 15 for a health check FAIL response, 10 for a health check UNKNOWN response, and 0 for a health check PASS response (6.2.2).
AlertLevel#
AlertLevel is a special metric. It is sampled and re-calculated when an event with an associated Severity (6.2.5) occurs. There are three types of AlertLevel metrics:
AlertLevel (count): the number of events that are at notice level and higher. This metric alerts the administrator to the number of issues.
AlertLevel (max): the maximum severity of the latest value of all the events. This metric alerts the administrator to the severity of the most important issue.
AlertLevel (sum): the sum of the latest severity values of all the events. This metric alert the administrator to the overall severity of issues.
Flapping#
Flapping, or State Flapping, is when a measurable trigger (6.2.3) that is detecting changes, changes that are too frequent. That is, the measurable goes in and out of the zone too many times over several samples. In the basic example of 6.1, if the CPUUser metric crossed the threshold zone five times within five minutes (the default values for flap detection), it would by default be detected as flapping. A flapping alert would then be recorded in the event viewer, and a flapping action could also be launched if configured to do so.
Data Producer#
A data producer produces measurables. Sometimes it can be a group of measurables, as in the measurables provided by a data producer that is being used:
 1[headnode->monitoring->measurable]% list -f name:25,producer:15 | grep ProcStat
 2BlockedProcesses    ProcStat
 3CPUGuest                            ProcStat
 4CPUIdle                             ProcStat
 5CPUIrq                              ProcStat
 6CPUNice                             ProcStat
 7CPUSoftIrq                  ProcStat
 8CPUSteal                            ProcStat
 9CPUSystem                   ProcStat
10CPUUser                             ProcStat
11CPUWait                             ProcStat
12CtxtSwitches                ProcStat
13Forks                                       ProcStat
14Interrupts                  ProcStat
15RunningProcesses    ProcStat
Sometimes it may just be one measurable, as provided by a used data producer:
1[headnode->monitoring->measurable]% list -f name:25,producer:15 | grep ssh2node ssh2node ssh2node
It can even have no measurables, and just be an empty container for measurables that are not in use yet.
In cmsh all data producers (used and unused) can be listed as follows:
1[headnode->monitoring->setup]% list
The equivalent in Base View is using clickpath Monitoring>Data Producers.
The data producers configured for an entity, such as a head node headnode, can be listed with the monitoringproducers command:
 1[headnode->device[headnode]]%  monitoringproducers
 2Type                                         Name          Arguments    Measurables  Node execution filters
 3------------------ ----------------- ------------ ------------ --------------------
 4AlertLevel                   AlertLevel                          3 / 231       <0 in submode>
 5CMDaemonState                CMDaemonState               1 / 231       <0 in submode>
 6ClusterTotal                 ClusterTotal                18 / 231      <1 in submode>
 7Collection                   NFS                                 32 / 231      <0 in submode>
 8Collection                   sdt                                 0 / 231       <0 in submode>
 9DeviceState                  DeviceState                 1 / 231       <1 in submode>
10HealthCheckScript    chrootprocess               1 / 231       <1 in submode>
11HealthCheckScript    cmsh                        1 / 231       <1 in submode>
12HealthCheckScript    default gateway                     1 / 231       <0 in submode>
13HealthCheckScript    diskspace                           1 / 231       <0 in submode>
14HealthCheckScript    dmesg                       1 / 231       <0 in submode>
15HealthCheckScript    exports                             1 / 231       <0 in submode>
16HealthCheckScript    failedprejob                1 / 231       <1 in submode>
17HealthCheckScript    hardware-profile                    0 / 231       <1 in submode>
18HealthCheckScript    ib                                  1 / 231       <0 in submode>
19HealthCheckScript    interfaces                          1 / 231       <0 in submode>
20HealthCheckScript    ldap                        1 / 231       <0 in submode>
21HealthCheckScript    lustre                      1 / 231       <0 in submode>
22HealthCheckScript    mounts                      1 / 231       <0 in submode>
23HealthCheckScript    mysql                       1 / 231       <1 in submode>
24HealthCheckScript    ntp                                 1 / 231       <0 in submode>
25HealthCheckScript    oomkiller                           1 / 231       <0 in submode>
26HealthCheckScript    opalinkhealth               1 / 231       <0 in submode>
27HealthCheckScript    rogueprocess                1 / 231       <1 in submode>
28HealthCheckScript    schedulers                          1 / 231       <0 in submode>
29HealthCheckScript    smart                       1 / 231       <0 in submode>
30HealthCheckScript    ssh2node                            1 / 231       <1 in submode>
31Job                                  JobSampler                          0 / 231       <1 in submode>
32JobQueue                             JobQueueSampler                     7 / 231       <1 in submode>
33MonitoringSystem     MonitoringSystem                    36 / 231      <1 in submode>
34ProcMemInfo                  ProcMemInfo                 10 / 231      <0 in submode>
35ProcMount                    ProcMounts                          2 / 231       <0 in submode>
36ProcNetDev                   ProcNetDev                          18 / 231      <0 in submode>
37ProcNetSnmp                  ProcNetSnmp                 21 / 231      <0 in submode>
38ProcPidStat                  ProcPidStat                 5 / 231       <0 in submode>
39ProcStat                             ProcStat                            14 / 231      <0 in submode>
40ProcVMStat                   ProcVMStat                          6 / 231       <0 in submode>
41Smart                                        SmartDisk                           0 / 231       <0 in submode>
42SysBlockStat                 SysBlockStat                20 / 231      <0 in submode>
43SysInfo                              SysInfo                             5 / 231       <0 in submode>
44UserCount                    UserCount                           3 / 231       <1 in submode>
The displayed data producers are the ones configured for the entity, even if there are no measurables used by the entity. Data producer configuration in Base View is discussed further in Section 12.4.1 of the Bright Cluster Manager Administrator Manual.
Main Monitoring Interfaces of Base View#
Base View, besides having the default settings mode, has some other display modes and logging view modes that can be selected using the 11 icons in the top-right corner of the Base View standard display (Figure 11).
Figure 11. Base View top-right corner icons
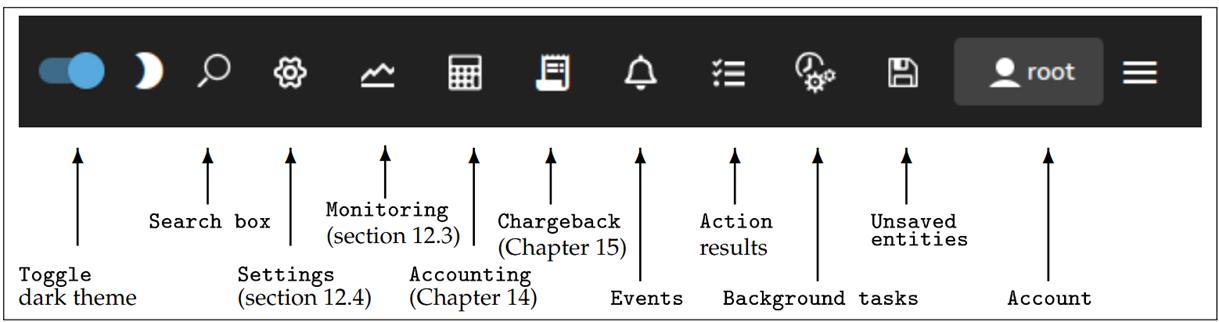
The 11 icons are described from left to right next:
Toggle dark theme option allows the display of Base View to use a darker theme.
Search box allows resource to be searched for, with predictive text suggestions.
- Settings mode is active when Base View first starts up.
The Settings mode has a navigation panel to the left of it, showing the resources of the cluster as expandable items. One of the resources is Monitoring. This resource should not be confused with the Bright View Monitoring mode, which is launched by the next icon. The Monitoring resource is about configuring how items are monitored and how their data values are collected.
The Monitoring mode allows visualization of the data values collected according to the specifications of the Bright View Monitoring resource. The visualization allows graphs to be configured.
The Accounting mode typically allows visualization of job resources used by users, although it can be used to visualize job resources used by other aggregation entities. This is helpful tracking resources consumed by users.
The Chargeback mode allows the monitoring of resources requested over a period for jobs run by selected groups.
The Events icon allows logs of events to be viewed.
The Action results icon allows the logs of the results of actions to be viewed.
The Background tasks icon allows background tasks to be viewed.
The Unsaved entities icon allows unsaved entities to be viewed.
The Account handling icon allows account settings to be managed for the Base View user.
Monitoring Visualization with Base View#
The Monitoring icon in the menu bar of Base View (Figure 11) launches an intuitive visualization tool that is the main GUI tool for getting a feel of the system’s behavior over periods of time. With this tool, the measurements and states of the system can be viewed as resizable and overlayable graphs. The graphs can be zoomed in and out over a particular time, the graphs can be laid out on top of each other, or the graphs can be laid out as a giant grid. The graph scale settings can also be adjusted, stored, and recalled for use the next time a session is started.
An alternative to Base View’s visualization tool is the CLI cmsh. This has the same functionality in the sense that data values can be selected and studied according to configurable parameters with it. The data values can even be plotted and displayed on graphs with cmsh with the help of unix pipes and graphing utilities. However, the strengths of monitoring with cmsh lie elsewhere: cmsh is more useful for scripting or for examining pre-decided metrics and health checks rather than a quick visual check over the system. This is because cmsh needs more familiarity with options and is designed for text output instead of interactive graphs.
See Section 12.5 and Section 12.6 of the Base Command Manager Administrator Manual for more information about monitoring with cmsh.
Visualization of monitoring graphs with Base View is now described.
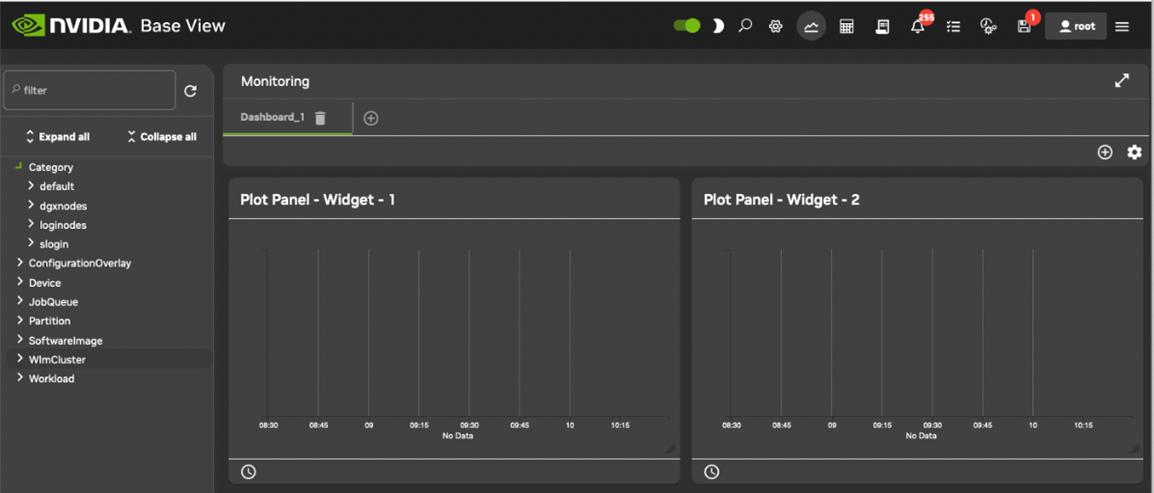
The Monitoring Window#
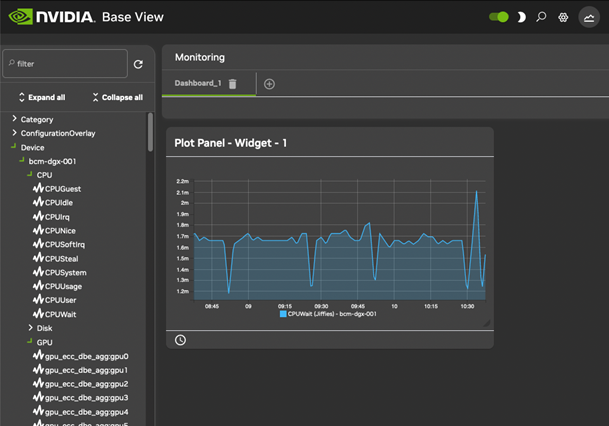
Selecting the Monitoring icon from the menu bar of Base View (Figure 11) launches a monitoring window for visualizing data opens. By default, this displays blank plot panels—graph axes with a time scale going back some time on the x-axis, and with no y axis measurable data values plotted. The monitoring window for Base View is shown in Figure 12.
Figure 12. Base View monitoring window
Finding and Selecting the Measurable to be Plotted#
To plot measurables, the entity that it belongs to should be selected from the navigation menu on the left-hand side. Once that has been selected, a class for that measurable can be chosen, and then the measurable itself can be selected. For example, to plot the measurable CPUUser for a head node headnode, it can be selected from the navigation clickpath Device>headnode>CPU>CPUUser.
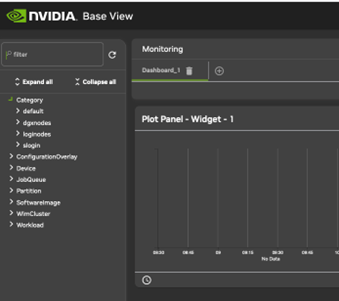
Sometimes, finding a measurable is easier with the filter search box. Entering CPUUser there shows all the measurables with that text (Figure 13). The search is case insensitive.
Figure 13. Base View monitoring filter search box
The filter search box can handle some simple regexes too, with .* and | taking their usual meaning:
dgx001.*cpuuserdgx001cpuuser
(dgx001|dgx002).*cpuuserdgx002dgx001
The / (forward slash) allows filtering according to the data path. It corresponds to the navigation depth in the tree hierarchy:
1dgx001/cpu/cpu user
Searches for a measurable with a data path that matches dgx001/cpu/cpu user.
Plotting The Measurable#
Once the measurable is selected, it can be drag-and-dropped into a plot panel. This causes the data values to be plotted.
When a measurable is plotted into a panel, two graph plots are displayed. The smaller, bottom plot represents the polled value as a bar chart. The larger, upper plot represents an interpolated line graph.
Different kinds of interpolations can be set. To get a quick idea of the effect of different kinds of interpolations, https://bl.ocks.org/mbostock/4342190 is an interactive overview that shows how they work on a small set of values.
The time axes can be expanded or shrunk using the mouse wheel in the graphing area of the plot panel. The resizing is centered around the position of the mouse pointer.