NVIDIA DOCA Telemetry Service Guide
This guide provides instructions on how to use the DOCA Telemetry Service (DTS) container on top of NVIDIA® BlueField® DPU.
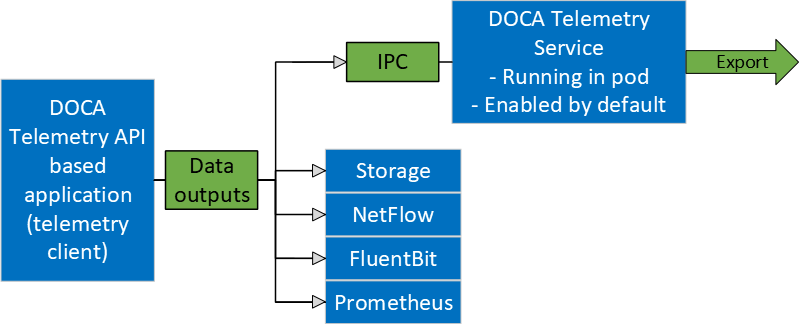
DOCA Telemetry Service (DTS) collects data from built-in providers and from external telemetry applications. The following providers are available:
Data providers:
sysfs
ethtool
tc (traffic control)
Aggregation providers:
fluent_aggr
prometheus_aggr
Sysfs provider is enabled by default.
DTS stores collected data into binary files under the /opt/mellanox/doca/services/telemetry/data directory. Data write is disabled by default due to BlueField storage restrictions.
DTS can export the data via Prometheus Endpoint (pull) or Fluent Bit (push).
DTS allows exporting NetFlow packets when data is collected from the DOCA Telemetry NetFlow API client application. NetFlow exporter is enabled from dts_config.ini by setting NetFlow collector IP/address and port.
Available Images
Built-in DOCA Service Image
DOCA Telemetry Service is enabled by default on the DPU and is shipped as part of the BlueField image. That is, every BlueField image contains a fixed service version so as to provide out-of-the-box support for programs based on the DOCA Telemetry library.
DOCA Service on NGC
In addition to the built-in image shipped with the BlueField boot image, DTS is also available on NGC, NVIDIA's container catalog. This is useful in case a new version of the service has been released and the user wants to upgrade from the built-in image. For service-specific configuration steps and deployment instructions, refer to the service's container page .
For more information about the deployment of DOCA containers on top of the BlueField DPU, refer to NVIDIA DOCA Container Deployment Guide.
DPU Deployment
As mentioned above, DTS starts automatically on BlueField boot. This is done according to the .yaml file located at /etc/kubelet.d/doca_telemetry_standalone.yaml. Removing the .yaml file from this path stops the automatic DTS boot.
DTS files can be found under the directory /opt/mellanox/doca/services/telemetry/.
Container folder mounts:
config
data
ipc_sockets
Backup files:
doca_telemetry_service_${version}_arm64.tar.gz – DTS image
doca_telemetry_standalone.yaml – copy of the default boot .yaml file
Host Deployment
DTS supports x86_64 hosts. The providers and exporters all run from a single docker container.
Initialize and configure host DTS with the desired DTS version:
            export DTS_IMAGE=nvcr.io/nvidia/doca/doca_telemetry:<desired-DTS-version>
docker run -v "/opt/mellanox/doca/services/telemetry/config:/config" --rm --name doca-telemetry-init -it $DTS_IMAGE /bin/bash -c "DTS_CONFIG_DIR=host /usr/bin/telemetry-init.sh"
NotePer NGC policy, the "latest" tag does not exist. This means that when deploying DTS, the user must pick the desired tag from NGC and ensure that the DTS_IMAGE variable points to the full image. Example from version 1.16.5-doca2.6.0-host:
export DTS_IMAGE=nvcr.io/nvidia/doca/doca_telemetry:1.16.5-doca2.6.0-host
Run with:
            docker run -d --net=host --uts=host --ipc=host                                        \
              --privileged                                                            \
              --ulimit stack=67108864 --ulimit memlock=-1                             \
              --device=/dev/mst/                                                      \
              --device=/dev/infiniband/                                               \
              --gpus all                                                              \
              -v "/opt/mellanox/doca/services/telemetry/config:/config"               \
              -v "/opt/mellanox/doca/services/telemetry/ipc_sockets:/tmp/ipc_sockets" \
              -v "/opt/mellanox/doca/services/telemetry/data:/data"                   \
              -v "/usr/lib/mft:/usr/lib/mft"                                          \
              -v "/sys/kernel/debug:/sys/kernel/debug"                                \
              --rm --name doca-telemetry -it $DTS_IMAGE /usr/bin/telemetry-run.sh
NoteThe following mounts are required by specific services only:
hcaperf provider:
--device=/dev/mst/
-v "/usr/lib/mft:/usr/lib/mft"
-v "/sys/kernel/debug:/sys/kernel/debug"
UCX/RDMA export modes:
--device=/dev/infiniband/
GPU providers (nvidia-smi and dcgm):
--gpu all
Deployment with Grafana Monitoring
Refer to section "Deploying with Grafana Monitoring".
The configuration of DTS is placed under /opt/mellanox/doca/services/telemetry/config by DTS during initialization. The user can interact with the dts_config.ini file and fluent_bit_configs folder. dts_config.ini contains the main configuration for the service and must be used to enable/disable providers, exporters, data writing. More details are provided in the corresponding sections. For every update in this file, DST must be restarted. Interaction with fluent_bit_configs folder is described in section Fluent Bit.
Init Scripts
The InitContainers section of the .yaml file has 2 scripts for config initialization:
/usr/bin/telemetry-init.sh – generates the default configuration files if, and only if, the /opt/mellanox/doca/services/telemetry/config folder is empty.
/usr/bin/enable-fluent-forward.sh – configures the destination host and port for Fluent Bit forwarding. The script requires that both the host and port are present, and only in this case it would start. The script overwrites the /opt/mellanox/doca/services/telemetry/config/fluent_bit_configs folder and configures the .exp file.
Enabling Fluent Bit Forwarding
To enable Fluent Bit forward, add the destination host and port to the command line found in the initContainers section of the .yaml file:
command: ["/bin/bash", "-c", "/usr/bin/telemetry-init.sh && /usr/bin/enable-fluent-forward.sh -i=127.0.0.1 -p=24224"]
The host and port shown above are just an example. See section Fluent Bit to learn about manual configuration.
Generating Configuration
The configuration folder /opt/mellanox/doca/services/telemetry/config starts empty by default. Once the service starts, the initial scripts run as a part of the initial container and create configuration as described in section Enabling Fluent Bit Forwarding.
Resetting Configuration
Resetting the configuration can be done by deleting the content found in the configuration folder and restarting the service to generate the default configuration.
Enabling Providers
Providers are enabled from the dts_config.ini configuration file. Uncomment the enable-provider=$provider-name line to allow data collection for this provider. For example, uncommenting the following line enables the ethtool provider:
#enable-provider=ethtool
More information about telemetry providers can be found under the Providers section.
Remote Collection
Certain providers or components are unable to execute properly within the container due to various container limitations. Therefore, they would have to perform remote collection or execution.
The following steps enable remote collection:
Activate DOCA privileged executer (DPE), as DPE is how remote collection is achieved:
systemctl start dpe
Add grpc before provider-name (i.e., enable-provider=grpc.$provider-name). For example, the following line configures remote collection of the hcaperf provider:
enable-provider=grpc.hcaperf
If there are any configuration lines that are provider-specific, then add the grpc prefix as well. Building upon the previous example:
            grpc.hcaperf.mlx5_0=sample
grpc.hcaperf.mlx5_1=sample
Enabling Data Write
Uncomment the following line in dts_config.ini:
#output=/data
Changes in dts_config.ini force the main DTS process to restart in 60 seconds to apply the new settings.
Enabling IPC with Non-container Program
For information on enabling IPC between DTS and an application that runs outside of a container, refer to section "Using IPC with Non-container Application" in the DOCA Telemetry.
Providers
DTS supports on-board data collection from sysf, ethtool, and tc providers.
Fluent and Prometheus aggregator providers can collect the data from other applications.
Sysfs Counters List
The sysfs provider has several components: ib_port, hw_port, mr_cache, eth, hwmon and bf_ptm . By default, all the components (except bf_ptm) are enabled when the provider is enabled:
#disable-provider=sysfs
The components can be disabled separately. For instance, to disable eth:
            enable-provider=sysfs
disable-provider=sysfs.eth
ib_port and ib_hvw are state counters which are collected per port. These counters are only collected for ports whose state is active.
ib_port counters:
            {hca_name}:{port_num}:ib_port_state
{hca_name}:{port_num}:VL15_dropped
{hca_name}:{port_num}:excessive_buffer_overrun_errors
{hca_name}:{port_num}:link_downed
{hca_name}:{port_num}:link_error_recovery
{hca_name}:{port_num}:local_link_integrity_errors
{hca_name}:{port_num}:multicast_rcv_packets
{hca_name}:{port_num}:multicast_xmit_packets
{hca_name}:{port_num}:port_rcv_constraint_errors
{hca_name}:{port_num}:port_rcv_data
{hca_name}:{port_num}:port_rcv_errors
{hca_name}:{port_num}:port_rcv_packets
{hca_name}:{port_num}:port_rcv_remote_physical_errors
{hca_name}:{port_num}:port_rcv_switch_relay_errors
{hca_name}:{port_num}:port_xmit_constraint_errors
{hca_name}:{port_num}:port_xmit_data
{hca_name}:{port_num}:port_xmit_discards
{hca_name}:{port_num}:port_xmit_packets
{hca_name}:{port_num}:port_xmit_wait
{hca_name}:{port_num}:symbol_error
{hca_name}:{port_num}:unicast_rcv_packets
{hca_name}:{port_num}:unicast_xmit_packets
ib_hw counters:
            {hca_name}:{port_num}:hw_state
{hca_name}:{port_num}:hw_duplicate_request
{hca_name}:{port_num}:hw_implied_nak_seq_err
{hca_name}:{port_num}:hw_lifespan
{hca_name}:{port_num}:hw_local_ack_timeout_err
{hca_name}:{port_num}:hw_out_of_buffer
{hca_name}:{port_num}:hw_out_of_sequence
{hca_name}:{port_num}:hw_packet_seq_err
{hca_name}:{port_num}:hw_req_cqe_error
{hca_name}:{port_num}:hw_req_cqe_flush_error
{hca_name}:{port_num}:hw_req_remote_access_errors
{hca_name}:{port_num}:hw_req_remote_invalid_request
{hca_name}:{port_num}:hw_resp_cqe_error
{hca_name}:{port_num}:hw_resp_cqe_flush_error
{hca_name}:{port_num}:hw_resp_local_length_error
{hca_name}:{port_num}:hw_resp_remote_access_errors
{hca_name}:{port_num}:hw_rnr_nak_retry_err
{hca_name}:{port_num}:hw_rx_atomic_requests
{hca_name}:{port_num}:hw_rx_dct_connect
{hca_name}:{port_num}:hw_rx_icrc_encapsulated
{hca_name}:{port_num}:hw_rx_read_requests
{hca_name}:{port_num}:hw_rx_write_requests
ib_mr_cache counters:
            {hca_name}:mr_cache:size_{n}:cur
{hca_name}:mr_cache:size_{n}:limit
{hca_name}:mr_cache:size_{n}:miss
{hca_name}:mr_cache:size_{n}:size
NoteWhere n ranges from 0 to 24.
eth counters:
            {hca_name}:{device_name}:eth_collisions
{hca_name}:{device_name}:eth_multicast
{hca_name}:{device_name}:eth_rx_bytes
{hca_name}:{device_name}:eth_rx_compressed
{hca_name}:{device_name}:eth_rx_crc_errors
{hca_name}:{device_name}:eth_rx_dropped
{hca_name}:{device_name}:eth_rx_errors
{hca_name}:{device_name}:eth_rx_fifo_errors
{hca_name}:{device_name}:eth_rx_frame_errors
{hca_name}:{device_name}:eth_rx_length_errors
{hca_name}:{device_name}:eth_rx_missed_errors
{hca_name}:{device_name}:eth_rx_nohandler
{hca_name}:{device_name}:eth_rx_over_errors
{hca_name}:{device_name}:eth_rx_packets
{hca_name}:{device_name}:eth_tx_aborted_errors
{hca_name}:{device_name}:eth_tx_bytes
{hca_name}:{device_name}:eth_tx_carrier_errors
{hca_name}:{device_name}:eth_tx_compressed
{hca_name}:{device_name}:eth_tx_dropped
{hca_name}:{device_name}:eth_tx_errors
{hca_name}:{device_name}:eth_tx_fifo_errors
{hca_name}:{device_name}:eth_tx_heartbeat_errors
{hca_name}:{device_name}:eth_tx_packets
{hca_name}:{device_name}:eth_tx_window_errors
BlueField-2 hwmon counters:
            {hwmon_name}:{l3cache}:CYCLES
{hwmon_name}:{l3cache}:HITS_BANK0
{hwmon_name}:{l3cache}:HITS_BANK1
{hwmon_name}:{l3cache}:MISSES_BANK0
{hwmon_name}:{l3cache}:MISSES_BANK1
{hwmon_name}:{pcie}:IN_C_BYTE_CNT
{hwmon_name}:{pcie}:IN_C_PKT_CNT
{hwmon_name}:{pcie}:IN_NP_BYTE_CNT
{hwmon_name}:{pcie}:IN_NP_PKT_CNT
{hwmon_name}:{pcie}:IN_P_BYTE_CNT
{hwmon_name}:{pcie}:IN_P_PKT_CNT
{hwmon_name}:{pcie}:OUT_C_BYTE_CNT
{hwmon_name}:{pcie}:OUT_C_PKT_CNT
{hwmon_name}:{pcie}:OUT_NP_BYTE_CNT
{hwmon_name}:{pcie}:OUT_NP_PKT_CNT
{hwmon_name}:{pcie}:OUT_P_PKT_CNT
{hwmon_name}:{tile}:MEMORY_READS
{hwmon_name}:{tile}:MEMORY_WRITES
{hwmon_name}:{tile}:MSS_NO_CREDIT
{hwmon_name}:{tile}:VICTIM_WRITE
{hwmon_name}:{tilenet}:CDN_DIAG_C_OUT_OF_CRED
{hwmon_name}:{tilenet}:CDN_REQ
{hwmon_name}:{tilenet}:DDN_REQ
{hwmon_name}:{tilenet}:NDN_REQ
{hwmon_name}:{trio}:TDMA_DATA_BEAT
{hwmon_name}:{trio}:TDMA_PBUF_MAC_AF
{hwmon_name}:{trio}:TDMA_RT_AF
{hwmon_name}:{trio}:TPIO_DATA_BEAT
{hwmon_name}:{triogen}:TX_DAT_AF
{hwmon_name}:{triogen}:TX_DAT_AF
BlueField-3 hwmon counters:
            {hwmon_name}:{llt}:GDC_BANK0_RD_REQ
{hwmon_name}:{llt}:GDC_BANK1_RD_REQ
{hwmon_name}:{llt}:GDC_BANK0_WR_REQ
{hwmon_name}:{llt}:GDC_BANK1_WR_REQ
{hwmon_name}:{llt_miss}:GDC_MISS_MACHINE_RD_REQ
{hwmon_name}:{llt_miss}:GDC_MISS_MACHINE_WR_REQ
{hwmon_name}:{mss}:SKYLIB_DDN_TX_FLITS
{hwmon_name}:{mss}:SKYLIB_DDN_RX_FLITS
BlueField-3 bf_ptm counters:
            bf:ptm:active_power_profile
bf:ptm:atx_power_available
bf:ptm:core_temp
bf:ptm:ddr_temp
bf:ptm:error_state
bf:ptm:power_envelope
bf:ptm:power_throttling_event_count
bf:ptm:power_throttling_state
bf:ptm:thermal_throttling_event_count
bf:ptm:thermal_throttling_state
bf:ptm:throttling_state
bf:ptm:total_power
bf:ptm:vr0_power
bf:ptm:vr1_power
Port Counters
The following parameters are located in /sys/class/infiniband/mlx5_0/ports/1/counters.
|
Counter |
Description |
InfiniBand Spec Name |
Group |
|
port_rcv_data |
The total number of data octets, divided by 4, (counting in double words, 32 bits), received on all VLs from the port. |
PortRcvData |
Informative |
|
port_rcv_packets |
Total number of packets (this may include packets containing Errors. This is 64 bit counter. |
PortRcvPkts |
Informative |
|
port_multicast_rcv_packets |
Total number of multicast packets, including multicast packets containing errors. |
PortMultiCastRcvPkts |
Informative |
|
port_unicast_rcv_packets |
Total number of unicast packets, including unicast packets containing errors. |
PortUnicastRcvPkts |
Informative |
|
port_xmit_data |
The total number of data octets, divided by 4, (counting in double words, 32 bits), transmitted on all VLs from the port. |
PortXmitData |
Informative |
|
port_xmit_packets port_xmit_packets_64 |
Total number of packets transmitted on all VLs from this port. This may include packets with errors. This is 64 bit counter. |
PortXmitPkts |
Informative |
|
port_rcv_switch_relay_errors |
Total number of packets received on the port that were discarded because they could not be forwarded by the switch relay. |
PortRcvSwitchRelayErrors |
Error |
|
port_rcv_errors |
Total number of packets containing an error that were received on the port. |
PortRcvErrors |
Informative |
|
port_rcv_constraint_errors |
Total number of packets received on the switch physical port that are discarded. |
PortRcvConstraintErrors |
Error |
|
local_link_integrity_errors |
The number of times that the count of local physical errors exceeded the threshold specified by LocalPhyErrors. |
LocalLinkIntegrityErrors |
Error |
|
port_xmit_wait |
The number of ticks during which the port had data to transmit but no data was sent during the entire tick (either because of insufficient credits or because of lack of arbitration). |
PortXmitWait |
Informative |
|
port_multicast_xmit_packets |
Total number of multicast packets transmitted on all VLs from the port. This may include multicast packets with errors. |
PortMultiCastXmitPkts |
Informative |
|
port_unicast_xmit_packets |
Total number of unicast packets transmitted on all VLs from the port. This may include unicast packets with errors. |
PortUnicastXmitPkts |
Informative |
|
port_xmit_discards |
Total number of outbound packets discarded by the port because the port is down or congested. |
PortXmitDiscards |
Error |
|
port_xmit_constraint_errors |
Total number of packets not transmitted from the switch physical port. |
PortXmitConstraintErrors |
Error |
|
port_rcv_remote_physical_errors |
Total number of packets marked with the EBP delimiter received on the port. |
PortRcvRemotePhysicalErrors |
Error |
|
symbol_error |
Total number of minor link errors detected on one or more physical lanes. |
SymbolErrorCounter |
Error |
|
VL15_dropped |
Number of incoming VL15 packets dropped due to resource limitations (e.g., lack of buffers) of the port. |
VL15Dropped |
Error |
|
link_error_recovery |
Total number of times the Port Training state machine has successfully completed the link error recovery process. |
LinkErrorRecoveryCounter |
Error |
|
link_downed |
Total number of times the Port Training state machine has failed the link error recovery process and downed the link. |
LinkDownedCounter |
Error |
Hardware Counters
The hardware counters, found under /sys/class/infiniband/mlx5_0/ports/1/hw_counters/, are counted per function and exposed on the function. Some counters are not counted per function. These counters are commented with a relevant comment.
|
Counter |
Description |
Group |
|
duplicate_request |
Number of received packets. A duplicate request is a request that had been previously executed. |
Error |
|
implied_nak_seq_err |
Number of time the requested decided an ACK. with a PSN larger than the expected PSN for an RDMA read or response. |
Error |
|
lifespan |
The maximum period in ms which defines the aging of the counter reads. Two consecutive reads within this period might return the same values |
Informative |
|
local_ack_timeout_err |
The number of times QP's ack timer expired for RC, XRC, DCT QPs at the sender side. The QP retry limit was not exceed, therefore it is still recoverable error. |
Error |
|
np_cnp_sent |
The number of CNP packets sent by the Notification Point when it noticed congestion experienced in the RoCEv2 IP header (ECN bits). |
Informative |
|
np_ecn_marked_roce_packets |
The number of RoCEv2 packets received by the notification point which were marked for experiencing the congestion (ECN bits where '11' on the ingress RoCE traffic) . |
Informative |
|
out_of_buffer |
The number of drops occurred due to lack of WQE for the associated QPs. |
Error |
|
out_of_sequence |
The number of out of sequence packets received. |
Error |
|
packet_seq_err |
The number of received NAK sequence error packets. The QP retry limit was not exceeded. |
Error |
|
req_cqe_error |
The number of times requester detected CQEs completed with errors. |
Error |
|
req_cqe_flush_error |
The number of times requester detected CQEs completed with flushed errors. |
Error |
|
req_remote_access_errors |
The number of times requester detected remote access errors. |
Error |
|
req_remote_invalid_request |
The number of times requester detected remote invalid request errors. |
Error |
|
resp_cqe_error |
The number of times responder detected CQEs completed with errors. |
Error |
|
resp_cqe_flush_error |
The number of times responder detected CQEs completed with flushed errors. |
Error |
|
resp_local_length_error |
The number of times responder detected local length errors. |
Error |
|
resp_remote_access_errors |
The number of times responder detected remote access errors. |
Error |
|
rnr_nak_retry_err |
The number of received RNR NAK packets. The QP retry limit was not exceeded. |
Error |
|
rp_cnp_handled |
The number of CNP packets handled by the Reaction Point HCA to throttle the transmission rate. |
Informative |
|
rp_cnp_ignored |
The number of CNP packets received and ignored by the Reaction Point HCA. This counter should not raise if RoCE Congestion Control was enabled in the network. If this counter raise, verify that ECN was enabled on the adapter. See HowTo Configure DCQCN (RoCE CC) values for ConnectX-4 (Linux). |
Error |
|
rx_atomic_requests |
The number of received ATOMIC request for the associated QPs. |
Informative |
|
rx_dct_connect |
The number of received connection request for the associated DCTs. |
Informative |
|
rx_read_requests |
The number of received READ requests for the associated QPs. |
Informative |
|
rx_write_requests |
The number of received WRITE requests for the associated QPs. |
Informative |
|
rx_icrc_encapsulated |
The number of RoCE packets with ICRC errors. |
Error |
|
roce_adp_retrans |
Counts the number of adaptive retransmissions for RoCE traffic |
Informative |
|
roce_adp_retrans_to |
Counts the number of times RoCE traffic reached timeout due to adaptive retransmission |
Informative |
|
roce_slow_restart |
Counts the number of times RoCE slow restart was used |
Informative |
|
roce_slow_restart_cnps |
Counts the number of times RoCE slow restart generated CNP packets |
Informative |
|
roce_slow_restart_trans |
Counts the number of times RoCE slow restart changed state to slow restart |
Informative |
|
roce_adp_retrans_to |
Counts the number of adaptive retransmissions for RoCE traffic |
Informative |
|
roce_slow_restart |
Counts the number of times RoCE traffic reached timeout due to adaptive retransmission |
Informative |
Debug Status Counters
The following parameters are located in /sys/class/net/<interface>/debug.
|
Parameter |
Description |
Default |
|
lro_timeout |
Sets the LRO timer period value in usecs which will be used as LRO session expiration time. For example:
|
32 |
|
link_down_reason |
Link down reason will allow the user to query the reason which is preventing the link from going up. For example:
Refer to the adapter PRM for all possible options (PDDR register). |
N/A |
Power Thermal Counters
The bf_ptm component collects BlueField-3 power thermal counters using remote collection. It is disabled by default and can be enabled as follows:
Load kernel module mlxbf-ptm:
modprobe -
vmlxbf-ptmEnable component using remote collection:
enable-provider=grpc.sysfs.bf_ptm
NoteDPE server should be active before changing the dts_config.ini file. See section "Remote Collection" for details.
Ethtool Counters
Ethtool counters is the generated list of counters which corresponds to Ethtool utility. Counters are generated on a per-device basis.
There are several counter groups, depending on where the counter is counted:
Ring – software ring counters
Software port – an aggregation of software ring counters
vPort counters – traffic counters and drops due to steering or no buffers. May indicate BlueField issues. These counters include Ethernet traffic counters (including raw Ethernet) and RDMA/RoCE traffic counters.
Physical port counters – the physical port connecting BlueField to the network. May indicate device issues or link or network issues. This measuring point holds information on standardized counters like IEEE 802.3, RFC2863, RFC 2819, RFC 3635 and additional counters like flow control, FEC, and more. Physical port counters are not exposed to virtual machines.
Priority port counters – a set of the physical port counters, per priory per port
Each group of counters may have different counter types:
Traffic informative counters – counters which counts traffic. These counters can be used for load estimation of for general debug.
Traffic acceleration counters – counters which counts traffic accelerated by NVIDIA drivers or by hardware. The counters are an additional layer to the informative counter set and the same traffic is counted in both informative and acceleration counters. Acceleration counters are marked with [A].
Error counters – increment of these counters might indicate a problem
The following acceleration mechanisms have dedicated counters:
TCP segmentation offload (TSO) – increasing outbound throughput and reducing CPU utilization by allowing the kernel to buffer multiple packets in a single large buffer. The BlueField splits the buffer into packet and transmits it.
Large receive offload (LRO) – increasing inbound throughput and reducing CPU utilization by aggregation of multiple incoming packets of a single stream to a single buffer
CHECKSUM – calculation of TCP checksum (by the BlueField). The following checksum offloads are available ( refer to skbuff.h for detailed explanation)
CHECKSUM_UNNECESSARY
CHECKSUM_NONE – no checksum acceleration was used
CHECKSUM_COMPLETE – device provided checksum on the entire packet
CHECKSUM_PARTIAL – device provided checksum
CQE compress – compression of completion queue events (CQE) used for sparing bandwidth on PCIe and hence achieve better performance.
Ring/Software Port Counters
The following counters are available per ring or software port.
These counters provide information on the amount of traffic accelerated by the BlueField. The counters tally the accelerated traffic in addition to the standard counters which tally that (i.e. accelerated traffic is counted twice).
The counter names in the table below refers to both ring and port counters. the notation for ring counters includes the [i] index without the braces. the notation for port counters does not include the [i]. a counter name rx[i]_packets will be printed as rx0_packets for ring 0 and rx_packets for the software port
|
Counter |
Description |
Type |
|
rx[i]_packets |
The number of packets received on ring i. |
Informative |
|
rx[i]_bytes |
The number of bytes received on ring i. |
Informative |
|
tx[i]_packets |
The number of packets transmitted on ring i. |
Informative |
|
tx[i]_bytes |
The number of bytes transmitted on ring i. |
Informative |
|
tx[i]_tso_packets |
The number of TSO packets transmitted on ring i [A]. |
Acceleration |
|
tx[i]_tso_bytes |
The number of TSO bytes transmitted on ring i [A]. |
Acceleration |
|
tx[i]_tso_inner_packets |
The number of TSO packets which are indicated to be carry internal encapsulation transmitted on ring i [A] |
Acceleration |
|
tx[i]_tso_inner_bytes |
The number of TSO bytes which are indicated to be carry internal encapsulation transmitted on ring i [A]. |
Acceleration |
|
rx[i]_lro_packets |
The number of LRO packets received on ring i [A]. |
Acceleration |
|
rx[i]_lro_bytes |
The number of LRO bytes received on ring i [A]. |
Acceleration |
|
rx[i]_csum_unnecessary |
Packets received with a CHECKSUM_UNNECESSARY on ring i [A]. |
Acceleration |
|
rx[i]_csum_none |
Packets received with CHECKSUM_NONE on ring i [A]. |
Acceleration |
|
rx[i]_csum_complete |
Packets received with a CHECKSUM_COMPLETE on ring i [A]. |
Acceleration |
|
rx[i]_csum_unnecessary_inner |
Packets received with inner encapsulation with a CHECK_SUM UNNECESSARY on ring i [A]. |
Acceleration |
|
tx[i]_csum_partial |
Packets transmitted with a CHECKSUM_PARTIAL on ring i [A]. |
Acceleration |
|
tx[i]_csum_partial_inner |
Packets transmitted with inner encapsulation with a CHECKSUM_PARTIAL on ring i [A]. |
Acceleration |
|
tx[i]_csum_none |
Packets transmitted with no hardware checksum acceleration on ring i. |
Informative |
|
tx[i]_stopped tx_queue_stopped 1 |
Events where SQ was full on ring i. If this counter is increased, check the amount of buffers allocated for transmission. |
Error |
|
tx[i]_wake tx_queue_wake 1 |
Events where SQ was full and has become not full on ring i. |
Error |
|
tx[i]_dropped tx_queue_dropped 1 |
Packets transmitted that were dropped due to DMA mapping failure on ring i. If this counter is increased, check the amount of buffers allocated for transmission. |
Error |
|
rx[i]_wqe_err |
The number of wrong opcodes received on ring i. |
Error |
|
tx[i]_nop |
The number of no WQEs (empty WQEs) inserted to the SQ (related to ring i) due to the reach of the end of the cyclic buffer. When reaching near to the end of cyclic buffer the driver may add those empty WQEs to avoid handling a state the a WQE start in the end of the queue and ends in the beginning of the queue. This is a normal condition. |
Informative |
|
rx[i]_mpwqe_frag |
The number of WQEs that failed to allocate compound page and hence fragmented MPWQE's (multipacket WQEs) were used on ring i. If this counter raise, it may suggest that there is no enough memory for large pages, the driver allocated fragmented pages. This is not abnormal condition. |
Informative |
|
rx[i]_mpwqe_filler_cqes |
The number of filler CQEs events that where issued on ring i. |
Informative |
|
rx[i]_cqe_compress_blks |
The number of receive blocks with CQE compression on ring i [A]. |
Acceleration |
|
rx[i]_cqe_compress_pkts |
The number of receive packets with CQE compression on ring i [A]. |
Acceleration |
|
rx[i]_cache_reuse |
The number of events of successful reuse of a page from a driver's internal page cache |
Acceleration |
|
rx[i]_cache_full |
The number of events of full internal page cache where driver can't put a page back to the cache for recycling (page will be freed) |
Acceleration |
|
rx[i]_cache_empty |
The number of events where cache was empty - no page to give. driver shall allocate new page |
Acceleration |
|
rx[i]_cache_busy |
The number of events where cache head was busy and cannot be recycled. driver allocated new page |
Acceleration |
|
rx[i]_xmit_more |
The number of packets sent with xmit_more indication set on the skbuff (no doorbell) |
Acceleration |
|
tx[i]_cqes |
The number of completions received on the CQ of TX ring. |
Informative |
|
ch[i]_poll |
The number of invocations of NAPI poll of channel. |
Informative |
|
ch[i]_arm |
The number of times the NAPI poll function completed and armed the completion queues on channel |
Informative |
|
ch[i]_aff_change |
The number of times the NAPI poll function explicitly stopped execution on a CPU due to a change in affinity, on channel. |
Informative |
|
rx[i]_congst_umr |
The number of times an outstanding UMR request is delayed due to congestion, on ring |
Error |
|
ch[i]_events |
The number of hard interrupt events on the completion queues of channel. |
Informative |
|
rx[i]_mpwqe_filler_strides |
The number of strides consumed by filler CQEs on ring. |
Informative |
|
rx[i]_xdp_tx_xmit |
The number of packets forwarded back to the port due to XDP program XDP_TX action (bouncing). these packets are not counted by other software counters. These packets are counted by physical port and vPort counters. |
Informative |
|
rx[i]_xdp_tx_full |
The number of packets that should have been forwarded back to the port due to XDP_TX action but were dropped due to full tx queue. these packets are not counted by other software counters. These packets are counted by physical port and vPort counters You may open more rx queues and spread traffic rx over all queues and/or increase rx ring size. |
Error |
|
rx[i]_xdp_tx_err |
The number of times an XDP_TX error such as frame too long and frame too short occurred on XDP_TX ring of RX ring. |
Error |
|
rx[i]_xdp_tx_cqes rx_xdp_tx_cqe 1 |
The number of completions received on the CQ of the XDP-TX ring. |
Informative |
|
rx[i]_xdp_drop |
The number of packets dropped due to XDP program XDP_DROP action. these packets are not counted by other software counters. These packets are counted by physical port and vPort counters. |
Informative |
|
rx[i]_xdp_redirect |
The number of times an XDP redirect action was triggered on ring. |
Acceleration |
|
tx[i]_xdp_xmit |
The number of packets redirected to the interface(due to XDP redirect). These packets are not counted by other software counters. These packets are counted by physical port and vPort counters. |
Informative |
|
tx[i]_xdp_full |
The number of packets redirected to the interface(due to XDP redirect), but were dropped due to full tx queue. these packets are not counted by other software counters. you may enlarge tx queues. |
Informative |
|
tx[i]_xdp_err |
The number of packets redirected to the interface(due to XDP redirect) but were dropped due to error such as frame too long and frame too short. |
Error |
|
tx[i]_xdp_cqes |
The number of completions received for packets redirected to the interface(due to XDP redirect) on the CQ . |
Informative |
|
rx[i]_cache_waive |
The number of cache evacuation. This can occur due to page move to another NUMA node or page was pfmemalloc-ed and should be freed as soon as possible. |
Acceleration |
The corresponding ring and global counters do not share the same name (i.e., do not follow the common naming scheme).
vPort Counters
Counters on the eswitch port that is connected to the vNIC.
|
Counter |
Description |
Type |
|
rx_vport_unicast_packets |
Unicast packets received, steered to a port including raw Ethernet QP/DPDK traffic, excluding RDMA traffic |
Informative |
|
rx_vport_unicast_bytes |
Unicast bytes received, steered to a port including raw Ethernet QP/DPDK traffic, excluding RDMA traffic |
Informative |
|
tx_vport_unicast_packets |
Unicast packets transmitted, steered from a port including raw Ethernet QP/DPDK traffic, excluding RDMA traffic |
Informative |
|
tx_vport_unicast_bytes |
Unicast bytes transmitted, steered from a port including raw Ethernet QP/DPDK traffic, excluding RDMA traffic |
Informative |
|
rx_vport_multicast_packets |
Multicast packets received, steered to a port including raw Ethernet QP/DPDK traffic, excluding RDMA traffic |
Informative |
|
rx_vport_multicast_bytes |
Multicast bytes received, steered to a port including raw Ethernet QP/DPDK traffic, excluding RDMA traffic |
Informative |
|
tx_vport_multicast_packets |
Multicast packets transmitted, steered from a port including raw Ethernet QP/DPDK traffic, excluding RDMA traffic |
Informative |
|
tx_vport_multicast_bytes |
Multicast bytes transmitted, steered from a port including raw Ethernet QP/DPDK traffic, excluding RDMA traffic |
Informative |
|
rx_vport_broadcast_packets |
Broadcast packets received, steered to a port including raw Ethernet QP/DPDK traffic, excluding RDMA traffic |
Informative |
|
rx_vport_broadcast_bytes |
Broadcast bytes received, steered to a port including raw Ethernet QP/DPDK traffic, excluding RDMA traffic |
Informative |
|
tx_vport_broadcast_packets |
Broadcast packets transmitted, steered from a port including raw Ethernet QP/DPDK traffic, excluding RDMA traffic |
Informative |
|
tx_vport_broadcast_bytes |
Broadcast packets transmitted, steered from a port including raw Ethernet QP/DPDK traffic, excluding RDMA traffic |
Informative |
|
rx_vport_rdma_unicast_packets |
RDMA unicast packets received, steered to a port (counters counts RoCE/UD/RC traffic) [A] |
Acceleration |
|
rx_vport_rdma_unicast_bytes |
RDMA unicast bytes received, steered to a port (counters counts RoCE/UD/RC traffic) [A] |
Acceleration |
|
tx_vport_rdma_unicast_packets |
RDMA unicast packets transmitted, steered from a port (counters counts RoCE/UD/RC traffic) [A] |
Acceleration |
|
tx_vport_rdma_unicast_bytes |
RDMA unicast bytes transmitted, steered from a port (counters counts RoCE/UD/RC traffic) [A] |
Acceleration |
|
rx_vport_ rdma _multicast_packets |
RDMA multicast packets received, steered to a port (counters counts RoCE/UD/RC traffic) [A] |
Acceleration |
|
rx_vport_ rdma _multicast_bytes |
RDMA multicast bytes received, steered to a port (counters counts RoCE/UD/RC traffic) [A] |
Acceleration |
|
tx_vport_ rdma _multicast_packets |
RDMA multicast packets transmitted, steered from a port (counters counts RoCE/UD/RC traffic) [A] |
Acceleration |
|
tx_vport_ rdma _multicast_bytes |
RDMA multicast bytes transmitted, steered from a port (counters counts RoCE/UD/RC traffic) [A] |
Acceleration |
|
rx_steer_missed_packets |
Number of packets that was received by the NIC, however was discarded because it did not match any flow in the NIC flow table |
Error |
|
rx_packets |
Representor only: packets received, that were handled by the hypervisor |
Informative |
|
rx_bytes |
Representor only: bytes received, that were handled by the hypervisor |
Informative |
|
tx_packets |
Representor only: packets transmitted, that were handled by the hypervisor |
Informative |
|
tx_bytes |
Representor only: bytes transmitted, that were handled by the hypervisor |
Informative |
Physical Port Counters
The physical port counters are the counters on the external port connecting adapter to the network. This measuring point holds information on standardized counters like IEEE 802.3, RFC2863, RFC 2819, RFC 3635 and additional counters like flow control, FEC and more.
|
Counter |
Description |
Type |
|
rx_packets_phy |
The number of packets received on the physical port. This counter doesn’t include packets that were discarded due to FCS, frame size and similar errors. |
Informative |
|
tx_packets_phy |
The number of packets transmitted on the physical port. |
Informative |
|
rx_bytes_phy |
The number of bytes received on the physical port, including Ethernet header and FCS. |
Informative |
|
tx_bytes_phy |
The number of bytes transmitted on the physical port. |
Informative |
|
rx_multicast_phy |
The number of multicast packets received on the physical port. |
Informative |
|
tx_multicast_phy |
The number of multicast packets transmitted on the physical port. |
Informative |
|
rx_broadcast_phy |
The number of broadcast packets received on the physical port. |
Informative |
|
tx_broadcast_phy |
The number of broadcast packets transmitted on the physical port. |
Informative |
|
rx_crc_errors_phy |
The number of dropped received packets due to frame check sequence (FCS) error on the physical port. If this counter is increased in high rate, check the link quality using rx_symbol_error_phy and rx_corrected_bits_phy counters below. |
Error |
|
rx_in_range_len_errors_phy |
The number of received packets dropped due to length/type errors on a physical port. |
Error |
|
rx_out_of_range_len_phy |
The number of received packets dropped due to length greater than allowed on a physical port. If this counter is increasing, it implies that the peer connected to the adapter has a larger MTU configured. Using same MTU configuration shall resolve this issue. |
Error |
|
rx_oversize_pkts_phy |
The number of dropped received packets due to length which exceed MTU size on a physical port. If this counter is increasing, it implies that the peer connected to the adapter has a larger MTU configured. Using same MTU configuration shall resolve this issue. |
Error |
|
rx_symbol_err_phy |
The number of received packets dropped due to physical coding errors (symbol errors) on a physical port. |
Error |
|
rx_mac_control_phy |
The number of MAC control packets received on the physical port. |
Informative |
|
tx_mac_control_phy |
The number of MAC control packets transmitted on the physical port. |
Informative |
|
rx_pause_ctrl_phy |
The number of link layer pause packets received on a physical port. If this counter is increasing, it implies that the network is congested and cannot absorb the traffic coming from to the adapter. |
Informative |
|
tx_pause_ctrl_phy |
The number of link layer pause packets transmitted on a physical port. If this counter is increasing, it implies that the NIC is congested and cannot absorb the traffic coming from the network. |
Informative |
|
rx_unsupported_op_phy |
The number of MAC control packets received with unsupported opcode on a physical port. |
Error |
|
rx_discards_phy |
The number of received packets dropped due to lack of buffers on a physical port. If this counter is increasing, it implies that the adapter is congested and cannot absorb the traffic coming from the network. |
Error |
|
tx_discards_phy |
The number of packets which were discarded on transmission, even no errors were detected. the drop might occur due to link in down state, head of line drop, pause from the network, etc. |
Error |
|
tx_errors_phy |
The number of transmitted packets dropped due to a length which exceed MTU size on a physical port. |
Error |
|
rx_undersize_pkts_phy |
The number of received packets dropped due to length which is shorter than 64 bytes on a physical port. If this counter is increasing, it implies that the peer connected to the adapter has a non-standard MTU configured or malformed packet had arrived. |
Error |
|
rx_fragments_phy |
The number of received packets dropped due to a length which is shorter than 64 bytes and has FCS error on a physical port. If this counter is increasing, it implies that the peer connected to the adapter has a non-standard MTU configured. |
Error |
|
rx_jabbers_phy |
The number of received packets d due to a length which is longer than 64 bytes and had FCS error on a physical port. |
Error |
|
rx_64_bytes_phy |
The number of packets received on the physical port with size of 64 bytes. |
Informative |
|
rx_65_to_127_bytes_phy |
The number of packets received on the physical port with size of 65 to 127 bytes. |
Informative |
|
rx_128_to_255_bytes_phy |
The number of packets received on the physical port with size of 128 to 255 bytes. |
Informative |
|
rx_256_to_511_bytes_phy |
The number of packets received on the physical port with size of 256 to 512 bytes. |
Informative |
|
rx_512_to_1023_bytes_phy |
The number of packets received on the physical port with size of 512 to 1023 bytes. |
Informative |
|
rx_1024_to_1518_bytes_phy |
The number of packets received on the physical port with size of 1024 to 1518 bytes. |
Informative |
|
rx_1519_to_2047_bytes_phy |
The number of packets received on the physical port with size of 1519 to 2047 bytes. |
Informative |
|
rx_2048_to_4095_bytes_phy |
The number of packets received on the physical port with size of 2048 to 4095 bytes. |
Informative |
|
rx_4096_to_8191_bytes_phy |
The number of packets received on the physical port with size of 4096 to 8191 bytes. |
Informative |
|
rx_8192_to_10239_bytes_phy |
The number of packets received on the physical port with size of 8192 to 10239 bytes. |
Informative |
|
link_down_events_phy |
The number of times where the link operative state changed to down. In case this counter is increasing it may imply on port flapping. You may need to replace the cable/transceiver. |
Error |
|
rx_out_of_buffer |
Number of times receive queue had no software buffers allocated for the adapter's incoming traffic. |
Error |
|
module_bus_stuck |
The number of times that module's I2C bus (data or clock) short-wire was detected. You may need to replace the cable/transceiver |
Error |
|
module_high_temp |
The number of times that the module temperature was too high. If this issue persist, you may need to check the ambient temperature or replace the cable/transceiver module |
Error |
|
module_bad_shorted |
The number of times that the module cables were shorted. You may need to replace the cable/transceiver module |
Error |
|
module_unplug |
The number of times that module was ejected |
Informative |
|
rx_buffer_passed_thres_phy |
The number of events where the port receive buffer was over 85% full |
Informative |
|
tx_pause_storm_warning_events |
The number of times the device was sending pauses for a long period of time |
Informative |
|
tx_pause_storm_error_events |
The number of times the device was sending pauses for a long period of time, reaching time out and disabling transmission of pause frames. On the period where pause frames were disabled, drop could have been occurred. |
Error |
|
rx[i]_buff_alloc_err / rx_buff_alloc_err |
Failed to allocate a buffer to received packet (or SKB) on port (or per ring) |
Error |
|
rx_bits_phy |
This counter provides information on the total amount of traffic that could have been received and can be used as a guideline to measure the ratio of errored traffic in rx_pcs_symbol_err_phy and rx_corrected_bits_phy. |
Informative |
|
rx_pcs_symbol_err_phy |
This counter counts the number of symbol errors that wasn’t corrected by FEC correction algorithm or that FEC algorithm was not active on this interface. If this counter is increasing, it implies that the link between the NIC and the network is suffering from high BER, and that traffic is lost. You may need to replace the cable/transceiver. The error rate is the number of rx_pcs_symbol_err_phy divided by the number of rx_phy_bits on a specific time frame. |
Error |
|
rx_corrected_bits_phy |
The number of corrected bits on this port according to active FEC (RS/FC). If this counter is increasing, it implies that the link between the NIC and the network is suffering from high BER. The corrected bit rate is the number of rx_corrected_bits_phy divided by the number of rx_phy_bits on a specific time frame |
Error |
|
phy_raw_errors_lane[l] |
This counter counts the number of physical raw errors per lane [l] index. The counter counts errors before FEC corrections. If this counter is increasing, it implies that the link between the NIC and the network is suffering from high BER, and that traffic might be lost. You may need to replace the cable/transceiver. Please check in accordance with rx_corrected_bits_phy . |
Error |
Priority Port Counters
The following counters are physical port counters that being counted per L2 priority (0-7).
p in the counter name represents the priority.
|
Counter |
Description |
Type |
|
rx_prio[p]_bytes |
The number of bytes received with priority p on the physical port. |
Informative |
|
rx_prio[p]_packets |
The number of packets received with priority p on the physical port. |
Informative |
|
tx_prio[p]_bytes |
The number of bytes transmitted on priority p on the physical port. |
Informative |
|
tx_prio[p]_packets |
The number of packets transmitted on priority p on the physical port. |
Informative |
|
rx_prio[p]_pause |
The number of pause packets received with priority p on a physical port. If this counter is increasing, it implies that the network is congested and cannot absorb the traffic coming from the adapter. Note: This counter is available only if PFC was enabled on priority p. Refer to HowTo Configure PFC on ConnectX-4. |
Informative |
|
rx_prio[p]_pause_duration |
The duration of pause received (in microSec) on priority p on the physical port. The counter represents the time the port did not send any traffic on this priority. If this counter is increasing, it implies that the network is congested and cannot absorb the traffic coming from the adapter. Note: This counter is available only if PFC was enabled on priority p. Refer to HowTo Configure PFC on ConnectX-4. |
Informative |
|
rx_prio[p]_pause_transition |
The number of times a transition from Xoff to Xon on priority p on the physical port has occurred. Note: This counter is available only if PFC was enabled on priority p. Refer to HowTo Configure PFC on ConnectX-4. |
Informative |
|
tx_prio[p]_pause |
The number of pause packets transmitted on priority p on a physical port. If this counter is increasing, it implies that the adapter is congested and cannot absorb the traffic coming from the network. Note: This counter is available only if PFC was enabled on priority p. Refer to HowTo Configure PFC on ConnectX-4. |
Informative |
|
tx_prio[p]_pause_duration |
The duration of pause transmitter (in microSec) on priority p on the physical port. Note: This counter is available only if PFC was enabled on priority p. Refer to HowTo Configure PFC on ConnectX-4. |
Informative |
|
rx_prio[p]_buf_discard |
The number of packets discarded by device due to lack of per host receive buffers |
Informative |
|
rx_prio[p]_cong_discard |
The number of packets discarded by device due to per host congestion |
Informative |
|
rx_prio[p]_marked |
The number of packets ecn marked by device due to per host congestion |
Informative |
|
rx_prio[p]_discard |
The number of packets discarded by device due to lack of receive buffers |
Infornative |
Device Counters
|
Counter |
Description |
Type |
|
rx_pci_signal_integrity |
Counts physical layer PCIe signal integrity errors, the number of transitions to recovery due to Framing errors and CRC (dlp and tlp). If this counter is raising, try moving the adapter card to a different slot to rule out a bad PCIe slot. Validate that you are running with the latest firmware available and latest server BIOS version. |
Error |
|
tx_pci_signal_integrity |
Counts physical layer PCIe signal integrity errors, the number of transition to recovery initiated by the other side (moving to recovery due to getting TS/EIEOS). If this counter is raising, try moving the adapter card to a different slot to rule out a bad PCI slot. Validate that you are running with the latest firmware available and latest server BIOS version. |
Error |
|
outbound_pci_buffer_overflow |
The number of packets dropped due to pci buffer overflow. If this counter is raising in high rate, it might indicate that the receive traffic rate for a host is larger than the PCIe bus and therefore a congestion occurs |
Informative |
|
outbound_pci_stalled_rd |
The percentage (in the range 0...100) of time within the last second that the NIC had outbound non-posted reads requests but could not perform the operation due to insufficient posted credits |
Informative |
|
outbound_pci_stalled_wr |
The percentage (in the range 0...100) of time within the last second that the NIC had outbound posted writes requests but could not perform the operation due to insufficient posted credits |
Informative |
|
outbound_pci_stalled_rd_events |
The number of seconds where outbound_pci_stalled_rd was above 30% |
Informative |
|
outbound_pci_stalled_wr_events |
The number of seconds where outbound_pci_stalled_wr was above 30% |
Informative |
|
dev_out_of_buffer |
The number of times the device owned queue had not enough buffers allocated. |
Error |
Full List of Counters
            # ethtool -S eth5

NIC statistics:
rx_packets: 10
rx_bytes: 3420
tx_packets: 18
tx_bytes: 1296
tx_tso_packets: 0
tx_tso_bytes: 0
tx_tso_inner_packets: 0
tx_tso_inner_bytes: 0
tx_added_vlan_packets: 0
tx_nop: 0
rx_lro_packets: 0
rx_lro_bytes: 0
rx_ecn_mark: 0
rx_removed_vlan_packets: 0
rx_csum_unnecessary: 0
rx_csum_none: 0
rx_csum_complete: 10
rx_csum_unnecessary_inner: 0
rx_xdp_drop: 0
rx_xdp_redirect: 0
rx_xdp_tx_xmit: 0
rx_xdp_tx_full: 0
rx_xdp_tx_err: 0
rx_xdp_tx_cqe: 0
tx_csum_none: 18
tx_csum_partial: 0
tx_csum_partial_inner: 0
tx_queue_stopped: 0
tx_queue_dropped: 0
tx_xmit_more: 0
tx_recover: 0
tx_cqes: 18
tx_queue_wake: 0
tx_udp_seg_rem: 0
tx_cqe_err: 0
tx_xdp_xmit: 0
tx_xdp_full: 0
tx_xdp_err: 0
tx_xdp_cqes: 0
rx_wqe_err: 0
rx_mpwqe_filler_cqes: 0
rx_mpwqe_filler_strides: 0
rx_buff_alloc_err: 0
rx_cqe_compress_blks: 0
rx_cqe_compress_pkts: 0
rx_page_reuse: 0
rx_cache_reuse: 0
rx_cache_full: 0
rx_cache_empty: 2688
rx_cache_busy: 0
rx_cache_waive: 0
rx_congst_umr: 0
rx_arfs_err: 0
ch_events: 75
ch_poll: 75
ch_arm: 75
ch_aff_change: 0
ch_eq_rearm: 0
rx_out_of_buffer: 0
rx_if_down_packets: 15
rx_steer_missed_packets: 0
rx_vport_unicast_packets: 0
rx_vport_unicast_bytes: 0
tx_vport_unicast_packets: 0
tx_vport_unicast_bytes: 0
rx_vport_multicast_packets: 2
rx_vport_multicast_bytes: 172
tx_vport_multicast_packets: 12
tx_vport_multicast_bytes: 936
rx_vport_broadcast_packets: 37
rx_vport_broadcast_bytes: 9270
tx_vport_broadcast_packets: 6
tx_vport_broadcast_bytes: 360
rx_vport_rdma_unicast_packets: 0
rx_vport_rdma_unicast_bytes: 0
tx_vport_rdma_unicast_packets: 0
tx_vport_rdma_unicast_bytes: 0
rx_vport_rdma_multicast_packets: 0
rx_vport_rdma_multicast_bytes: 0
tx_vport_rdma_multicast_packets: 0
tx_vport_rdma_multicast_bytes: 0
tx_packets_phy: 0
rx_packets_phy: 0
rx_crc_errors_phy: 0
tx_bytes_phy: 0
rx_bytes_phy: 0
tx_multicast_phy: 0
tx_broadcast_phy: 0
rx_multicast_phy: 0
rx_broadcast_phy: 0
rx_in_range_len_errors_phy: 0
rx_out_of_range_len_phy: 0
rx_oversize_pkts_phy: 0
rx_symbol_err_phy: 0
tx_mac_control_phy: 0
rx_mac_control_phy: 0
rx_unsupported_op_phy: 0
rx_pause_ctrl_phy: 0
tx_pause_ctrl_phy: 0
rx_discards_phy: 0
tx_discards_phy: 0
tx_errors_phy: 0
rx_undersize_pkts_phy: 0
rx_fragments_phy: 0
rx_jabbers_phy: 0
rx_64_bytes_phy: 0
rx_65_to_127_bytes_phy: 0
rx_128_to_255_bytes_phy: 0
rx_256_to_511_bytes_phy: 0
rx_512_to_1023_bytes_phy: 0
rx_1024_to_1518_bytes_phy: 0
rx_1519_to_2047_bytes_phy: 0
rx_2048_to_4095_bytes_phy: 0
rx_4096_to_8191_bytes_phy: 0
rx_8192_to_10239_bytes_phy: 0
link_down_events_phy: 0
rx_prio0_bytes: 0
rx_prio0_packets: 0
tx_prio0_bytes: 0
tx_prio0_packets: 0
rx_prio1_bytes: 0
rx_prio1_packets: 0
tx_prio1_bytes: 0
tx_prio1_packets: 0
rx_prio2_bytes: 0
rx_prio2_packets: 0
tx_prio2_bytes: 0
tx_prio2_packets: 0
rx_prio3_bytes: 0
rx_prio3_packets: 0
tx_prio3_bytes: 0
tx_prio3_packets: 0
rx_prio4_bytes: 0
rx_prio4_packets: 0
tx_prio4_bytes: 0
tx_prio4_packets: 0
rx_prio5_bytes: 0
rx_prio5_packets: 0
tx_prio5_bytes: 0
tx_prio5_packets: 0
rx_prio6_bytes: 0
rx_prio6_packets: 0
tx_prio6_bytes: 0
tx_prio6_packets: 0
rx_prio7_bytes: 0
rx_prio7_packets: 0
tx_prio7_bytes: 0
tx_prio7_packets: 0
module_unplug: 0
module_bus_stuck: 0
module_high_temp: 0
module_bad_shorted: 0
ch0_events: 9
ch0_poll: 9
ch0_arm: 9
ch0_aff_change: 0
ch0_eq_rearm: 0
ch1_events: 23
ch1_poll: 23
ch1_arm: 23
ch1_aff_change: 0
ch1_eq_rearm: 0
ch2_events: 8
ch2_poll: 8
ch2_arm: 8
ch2_aff_change: 0
ch2_eq_rearm: 0
ch3_events: 19
ch3_poll: 19
ch3_arm: 19
ch3_aff_change: 0
ch3_eq_rearm: 0
ch4_events: 8
ch4_poll: 8
ch4_arm: 8
ch4_aff_change: 0
ch4_eq_rearm: 0
ch5_events: 8
ch5_poll: 8
ch5_arm: 8
ch5_aff_change: 0
ch5_eq_rearm: 0
rx0_packets: 0
rx0_bytes: 0
rx0_csum_complete: 0
rx0_csum_unnecessary: 0
rx0_csum_unnecessary_inner: 0
rx0_csum_none: 0
rx0_xdp_drop: 0
rx0_xdp_redirect: 0
rx0_lro_packets: 0
rx0_lro_bytes: 0
rx0_ecn_mark: 0
rx0_removed_vlan_packets: 0
rx0_wqe_err: 0
rx0_mpwqe_filler_cqes: 0
rx0_mpwqe_filler_strides: 0
rx0_buff_alloc_err: 0
rx0_cqe_compress_blks: 0
rx0_cqe_compress_pkts: 0
rx0_page_reuse: 0
rx0_cache_reuse: 0
rx0_cache_full: 0
rx0_cache_empty: 448
rx0_cache_busy: 0
rx0_cache_waive: 0
rx0_congst_umr: 0
rx0_arfs_err: 0
rx0_xdp_tx_xmit: 0
rx0_xdp_tx_full: 0
rx0_xdp_tx_err: 0
rx0_xdp_tx_cqes: 0
rx1_packets: 10
rx1_bytes: 3420
rx1_csum_complete: 10
rx1_csum_unnecessary: 0
rx1_csum_unnecessary_inner: 0
rx1_csum_none: 0
rx1_xdp_drop: 0
rx1_xdp_redirect: 0
rx1_lro_packets: 0
rx1_lro_bytes: 0
rx1_ecn_mark: 0
rx1_removed_vlan_packets: 0
rx1_wqe_err: 0
rx1_mpwqe_filler_cqes: 0
rx1_mpwqe_filler_strides: 0
rx1_buff_alloc_err: 0
rx1_cqe_compress_blks: 0
rx1_cqe_compress_pkts: 0
rx1_page_reuse: 0
rx1_cache_reuse: 0
rx1_cache_full: 0
rx1_cache_empty: 448
rx1_cache_busy: 0
rx1_cache_waive: 0
rx1_congst_umr: 0
rx1_arfs_err: 0
rx1_xdp_tx_xmit: 0
rx1_xdp_tx_full: 0
rx1_xdp_tx_err: 0
rx1_xdp_tx_cqes: 0
rx2_packets: 0
rx2_bytes: 0
rx2_csum_complete: 0
rx2_csum_unnecessary: 0
rx2_csum_unnecessary_inner: 0
rx2_csum_none: 0
rx2_xdp_drop: 0
rx2_xdp_redirect: 0
rx2_lro_packets: 0
rx2_lro_bytes: 0
rx2_ecn_mark: 0
rx2_removed_vlan_packets: 0
rx2_wqe_err: 0
rx2_mpwqe_filler_cqes: 0
rx2_mpwqe_filler_strides: 0
rx2_buff_alloc_err: 0
rx2_cqe_compress_blks: 0
rx2_cqe_compress_pkts: 0
rx2_page_reuse: 0
rx2_cache_reuse: 0
rx2_cache_full: 0
rx2_cache_empty: 448
rx2_cache_busy: 0
rx2_cache_waive: 0
rx2_congst_umr: 0
rx2_arfs_err: 0
rx2_xdp_tx_xmit: 0
rx2_xdp_tx_full: 0
rx2_xdp_tx_err: 0
rx2_xdp_tx_cqes: 0
...
tx0_packets: 1
tx0_bytes: 60
tx0_tso_packets: 0
tx0_tso_bytes: 0
tx0_tso_inner_packets: 0
tx0_tso_inner_bytes: 0
tx0_csum_partial: 0
tx0_csum_partial_inner: 0
tx0_added_vlan_packets: 0
tx0_nop: 0
tx0_csum_none: 1
tx0_stopped: 0
tx0_dropped: 0
tx0_xmit_more: 0
tx0_recover: 0
tx0_cqes: 1
tx0_wake: 0
tx0_cqe_err: 0
tx1_packets: 5
tx1_bytes: 300
tx1_tso_packets: 0
tx1_tso_bytes: 0
tx1_tso_inner_packets: 0
tx1_tso_inner_bytes: 0
tx1_csum_partial: 0
tx1_csum_partial_inner: 0
tx1_added_vlan_packets: 0
tx1_nop: 0
tx1_csum_none: 5
tx1_stopped: 0
tx1_dropped: 0
tx1_xmit_more: 0
tx1_recover: 0
tx1_cqes: 5
tx1_wake: 0
tx1_cqe_err: 0
tx2_packets: 0
tx2_bytes: 0
tx2_tso_packets: 0
tx2_tso_bytes: 0
tx2_tso_inner_packets: 0
tx2_tso_inner_bytes: 0
tx2_csum_partial: 0
tx2_csum_partial_inner: 0
tx2_added_vlan_packets: 0
tx2_nop: 0
tx2_csum_none: 0
tx2_stopped: 0
tx2_dropped: 0
tx2_xmit_more: 0
tx2_recover: 0
tx2_cqes: 0
tx2_wake: 0
tx2_cqe_err: 0
...
Traffic Control Info
The following TC objects are supported and reported regarding the ingress filters:
Filters
Actions
The info is provided as one of the following events:
Basic filter event
Flower/IPv4 filter event
Flower/IPv6 filter event
Basic action event
Mirred action event
Tunnel_key/IPv4 action event
Tunnel_key/IPv6 action event
General notes:
Actions always belong to a filter, so action events share the filter event's ID via the event_id data member
Basic filter event only contains textual kind (so users can see which real life objects' support they are lacking)
Basic action event only contains textual kind and some basic common statistics if available
Fluent Aggregator
fluent_aggr listens on a port for Fluent Bit Forward protocol input connections. Received data can be streamed via a Fluent Bit exporter.
The default port is 42442. This can be changed by updating the following option:
fluent-aggr-port=42442
Prometheus Aggregator
prometheus_aggr polls data from a list of Prometheus endpoints.
Each endpoint is listed in the following format:
prometheus_aggr_endpoint.{N}={host_name},{host_port_url},{poll_inteval_msec}
Where N starts from 0.
Aggregated data can be exported via a Prometheus Aggr Exporter endpoint.
Network Interfaces
ifconfig collects network interface data. To enable, set:
enable-provider=ifconfig
If the Prometheus endpoint is enabled, add the following configuration to cache every collected network interface and arrange the index according to their names:
prometheus-fset-indexes=name
Metrices are collected for each network interface as follows:
            name
rx_packets
tx_packets
rx_bytes
tx_bytes
rx_errors
tx_errors
rx_dropped
tx_dropped
multicast
collisions
rx_length_errors
rx_over_errors
rx_crc_errors
rx_frame_errors
rx_fifo_errors
rx_missed_errors
tx_aborted_errors
tx_carrier_errors
tx_fifo_errors
tx_heartbeat_errors
tx_window_errors
rx_compressed
tx_compressed
rx_nohandler
HCA Performance
hcaperf collects HCA performance data. Since it requires access to an RDMA device, it must use remote collection on the DPU. On the host, the user runs the container in privileged mode and RDMA device mount.
The counter list is device dependent.
hcaperf DPU Configuration
To enable hcaperf in remote collection mode, set:
            enable-provider=grpc.hcaperf

# specify HCAs to sample
grpc.hcaperf.mlx5_0=sample
grpc.hcaperf.mlx5_1=sample
DPE server should be active before changing the dts_config.ini file. See section "Remote Collection" for details.
hcaperf Host Configuration
To enable hcaperf in regular mode, set:
            enable-provider=hcaperf

# specify HCAs to sample
hcaperf.mlx5_0=sample
hcaperf.mlx5_1=sample
NVIDIA System Management Interface
The nvidia-smi provider collects GPU and GPU process information provided by the NVIDIA system management interface.
This provider is supported only on x86_64 hosts with installed GPUs. All GPU cards supported by nvidia-smi are supported by this provider.
The counter list is GPU dependent. Additionally, per-process information is collected for the first 20 (by default) nvidia_smi_max_processes processes.
Counters can be either collected as string data "as is" in nvidia-smi or converted to numbers when nvsmi_with_numeric_fields is set.
To enable nvidia-smi provider and change parameters, set:
            enable-provider=nvidia-smi

# Optional parameters:
#nvidia_smi_max_processes=20
#nvsmi_with_numeric_fields=1
NVIDIA Data Center GPU Manager
The dcgm provider collects GPU information provided by the NVIDIA data center GPU manager (DCGM) API.
This provider is supported only on x86_64 hosts with installed GPUs, and requires running the nv-hostengine service (refer to DCGM documentation for details).
DCGM counters are split into several groups by context:
GPU – basic GPU information (always)
COMMON – common fields that can be collected from all devices
PROF – profiling fields
ECC – ECC errors
NVLINK / NVSWITCH / VGPU – fields depending on the device type
To enable DCGM provider and counter groups, set:
            enable-provider=dcgm

dcgm_events_enable_common_fields=1
#dcgm_events_enable_prof_fields=0
#dcgm_events_enable_ecc_fields=0
#dcgm_events_enable_nvlink_fields=0
#dcgm_events_enable_nvswitch_fields=0
#dcgm_events_enable_vgpu_fields=0
BlueField Performance
The bfperf provider collects calculated performance counters of BlueField Arm cores. It requires the executable bfperf_pmc, which is integrated in the DOCA BFB bundle of BlueField-3, as well as an active DPE.
To enable BlueField performance provider, set:
enable-provider=bfperf
When running, the bfperf provider is expected to recurrently reset the counters of the sysfs.hwmon component. Consider disabling it if bfperf is enabled.
Data Outputs
DTS can send the collected data to the following outputs:
Data writer (saves binary data to disk)
Fluent Bit (push-model streaming)
Prometheus endpoint (keeps the most recent data to be pulled)
Data Writer
The data writer is disabled by default to save space on BlueField. Steps for activating data write during debug can be found under section Enabling Data Write.
The schema folder contains JSON-formatted metadata files which allow reading the binary files containing the actual data. The binary files are written according to the naming convention shown in the following example (apt install tree):
            tree /opt/mellanox/doca/services/telemetry/data/
/opt/mellanox/doca/services/telemetry/data/
├── {year}
│   └── {mmdd}
│        └── {hash}
│             ├── {source_id}
│             │   └── {source_tag}{timestamp}.bin
│             └── {another_source_id}
│                  └── {another_source_tag}{timestamp}.bin
└── schema
    └── schema_{MD5_digest}.json
New binary files appears when the service starts or when binary file age/size restriction is reached. If no schema or no data folders are present, refer to the Troubleshooting section.
source_id is usually set to the machine hostname. source_tag is a line describing the collected counters, and it is often set as the provider's name or name of user-counters.
Reading the binary data can be done from within the DTS container using the following command:
crictl exec -it <Container ID> /opt/mellanox/collectx/bin/clx_read -s /data/schema /data/path/to/datafile.bin
The path to the data file must be an absolute path.
Example output:
            {
    "timestamp": 1634815738799728,
    "event_number": 0,
    "iter_num": 0,
    "string_number": 0,
    "example_string": "example_str_1"
}
{
    "timestamp": 1634815738799768,
    "event_number": 1,
    "iter_num": 0,
    "string_number": 1,
    "example_string": "example_str_2"
}
…
Prometheus
The Prometheus endpoint keeps the most recent data to be pulled by the Prometheus server and is enabled by default.
To check that data is available, run the following command on BlueField:
curl -s http://0.0.0.0:9100/metrics
The command dumps every counter in the following format:
counter_name {list of meta fields} counter_value timestamp
Additionally, endpoint supports JSON and CSV formats:
            curl -s http://0.0.0.0:9100/json/metrics
curl -s http://0.0.0.0:9100/csv/metrics
The default port for Prometheus can be changed in dts_config.ini.
Configuration Details
Prometheus is configured as a part of dts_config.ini.
By default, the Prometheus HTTP endpoint is set to port 9100. Comment this line out to disable Prometheus export.
prometheus=http://0.0.0.0:9100
Prometheus can use the data field as an index to keep several data records with different index values. Index fields are added to Prometheus labels.
            # Comma-separated counter set description for Prometheus indexing:
#prometheus-indexes=idx1,idx2

# Comma-separated fieldset description for prometheus indexing
#prometheus-fset-indexes=idx1,idx2
The default fset index is device_name. It allows Prometheus to keep ethtool data up for both the p0 and p1 devices.
prometheus-fset-indexes=device_name
If fset index is not set, the data from p1 overwrites p0's data.
For quick name filtering, the Prometheus exporter supports being provided with a comma-separated list of counter names to be ignored:
#prometheus-ignore-names=counter_name1,counter_name_2
For quick filtering of data by tag, the Prometheus exporter supports being provided with a comma-separated list of data source tags to be ignored.
Users should add tags for all streaming data since the Prometheus exporter cannot be used for streaming. By default, FI_metrics are disabled.
prometheus-ignore-tags=FI_metrics
Prometheus Aggregator Exporter
Prometheus aggregator exporter is an endpoint that keeps the latest aggregated data using prometheus_aggr.
This exporter labels data according to its source.
To enable this provider, users must set 2 parameters in dts_config.ini:
            prometheus-aggr-exporter-host=0.0.0.0
prometheus-aggr-exporter-port=33333
Fluent Bit
Fluent Bit allows streaming to multiple destinations. Destinations are configured in .exp files that are documented in-place and can be found under:
/opt/mellanox/doca/services/telemetry/config/fluent_bit_configs
Fluent Bit allows exporting data via "Forward" protocol which connects to the Fluent Bit/FluentD instance on customer side.
Export can be enabled manually:
Uncomment the line with fluent_bit_configs=… in dts_config.ini.
Set enable=1 in required .exp files for the desired plugins.
Additional configurations can be set according to instructions in the .exp file if needed.
Restart the DTS.
Set up receiving instance of Fluent Bit/FluentD if needed.
See the data on the receiving side.
Export file destinations are set by configuring .exp files or creating new ones. It is recommended to start by going over documented example files. Documented examples exist for the following supported plugins:
forward
file
stdout
kafka
es (elastic search)
influx
All .exp files are disabled by default if not configured by initContainer entry point through .yaml file.
To forward the data to several destinations, create several forward_{num}.exp files. Each of these files must have their own destination host and port.
Export File Configuration Details
Each export destination has the following fields:
name – configuration name
plugin_name – Fluent Bit plugin name
enable – 1 or 0 values to enable/disable this destination
host – the host for Fluent Bit plugin
port – port for Fluent Bit plugin
msgpack_data_layout – the msgpacked data format. Default is flb_std. The other option is custom. See section Msgpack Data Layout for details.
plugin_key=val – key-value pairs of Fluent Bit plugin parameter (optional)
counterset/fieldset – file paths (optional). See details in section Cset/Fset Filtering.
source_tag=source_tag1,source_tag2 – comma-separated list of data page source tags for filtering. The rest tags are filtered out during export. Event tags are event provider names. All counters can be enabled/disabled only simultaneously with a counters keyword.
Use # to comment a configuration line.
Msgpack Data Layout
Data layout can be configured using .exp files by setting msgpack_data_layout=layout. There are two available layouts: Standard and Custom.
The standard flb_std data layout is an array of 2 fields:
timestamp double value
a plain dictionary (key-value pairs)
The standard layout is appropriate for all Fluent Bit plugins. For example:
[timestamp_val, {"timestamp"->ts_val, type=>"counters/events", "source"=>"source_val", "key_1"=>val_1, "key_2"=>val_2,...}]
The custom data layout is a dictionary of meta-fields and counter fields. Values are placed into a separate plain dictionary. Custom data format can be dumped with stdout_raw output plugin of Fluent-Bit installed or can be forwarded with forward output plugin.
Counters example:
{"timestamp"=>timestamp_val, "type"=>"counters", "source"=>"source_val", "values"=> {"key_1"=>val_1, "key_2"=>val_2,...}}
Events example:
{"timestamp"=>timestamp_val, "type"=>"events", "type_name"=>"type_name_val", "source"=>" source_val", "values"=>{"key_1"=>val_1, "key_2"=>val_2,...}}
Cset/Fset Filtering
Each export file can optionally use one cset and one fset file to filter UFM telemetry counters and events data.
cset contains tokens per line to filter data with "type"="counters".
fset contains several blocks started with the header line [event_type_name] and tokens under that header. An Fset file is used to filter data with "type"="events".
NoteEvent type names could be prefixed to apply the same tokens to all fitting types. For example, to filter all ethtool events, use [ethtool_event_*].
If several tokens must be matched simultaneously, use <tok1>+<tok2>+<tok3>. Exclusive tokens are available as well. For example, the line <tok1>+<tok2>-<tok3>-<tok4> filters names that match both tok1 and tok2 and do not match tok3 or tok4.
The following are the details of writing cset files:
            # Put tokens on separate lines
# Tokens are the actual name 'fragments' to be matched
# port$ # match names ending with token "port"
# ^port # match names starting with token "port"
# ^port$ # include name that is exact token "port
# port+xmit # match names that contain both tokens "port" and "xmit"
# port-support # match names that contain the token "port" and do not match the "-" token "support"
#
# Tip: To disable counter export put a single token line that fits nothing
The following are the details of writing fset files:
            # Put your events here
# Usage:
#
# [type_name_1]
# tokens
# [type_name_2]
# tokens
# [type_name_3]
# tokens
# ...
# Tokens are the actual name 'fragments' to be matched
# port$ # match names ending with token "port"
# ^port # match names starting with token "port"
# ^port$ # include name that is exact token "port
# port+xmit # match names that contain both tokens "port" and "xmit"
# port-support # match names that contain the token "port" and do not match the "-" token "support"

# The next example will export all the "tc" events and all events with type prefix "ethtool_" "ethtool" are filtered with token "port":
# [tc]
#
# [ethtool_*]
# packet

# To know which event type names are available check export and find field "type_name"=>"ethtool_event_p0"
# ...
# Corner cases:
# 1. Empty fset file will export all events.
# 2. Tokens written above/without [event_type] will be ignored.
# 3. If cannot open fset file, warning will be printed, all event types will be exported.
NetFlow Exporter
NetFlow exporter must be used when data is collected as NetFlow packets from the telemetry client applications. In this case, DOCA Telemetry NetFlow API sends NetFlow data packages to DTS via IPC. DTS uses NetFlow exporter to send data to the NetFlow collector (3rd party service).
To enable NetFlow exporter, set netflow-collector-ip and netflow-collector-port in dts_config.ini. netflow-collector-ip could be set either to IP or an address.
For additional information, refer to the dts_config.ini file.
DOCA Privileged Executer (DPE) is a daemon that allows specific DOCA services (DTS included) to access BlueField information that is otherwise inaccessible from a container due to technology limitations or permission granularity issues.
When enabled, DPE enriches the information collected by DTS. However, DTS can still be used if DPE is disabled (default).
DPE Usage
DPE is controlled by systemd, and can be used as follows:
To check DPE status:
sudo systemctl status dpe
To start DPE:
sudo systemctl start dpe
To stop DPE:
sudo systemctl stop dpe
DPE logs can be found in /var/log/doca/telemetry/dpe.log.
DPE Configuration File
DPE can be configured by the user. This section covers the syntax and implications of its configuration file.
The DPU telemetry collected by DTS does not require for this configuration file to be used.
The DPE configuration file allows users to define the set of commands that DPE should support. This may be done by passing the -f option in the following line of /etc/systemd/system/dpe.service:
ExecStart=/opt/mellanox/doca/services/telemetry/dpe/bin/dpeserver -vvv
To use the configuration file:
ExecStart=/opt/mellanox/doca/services/telemetry/dpe/bin/dpeserver -vvv -f /path/to/dpe_config.ini
The configuration file supports the following sections:
[server] - list of key=value lines for general server configuration. Allowed keys: socket.
[commands] - list of bash command lines that are not using custom RegEx
[commands_regex] - list of bash command lines that are using custom RegEx
[regex_macros] - custom RegEx definitions used in the commands_regex section
Consider the following example configuration file:
            [server]
socket=/tmp/dpe.sock

[commands]
hostname
cat /etc/os-release

[commands_regex]
crictl inspect $HEXA       # resolved as "crictl inspect [a-f0-9]+"
lspci $BDF                 # resolved as "lspci ([0-9a-f]{4}\:|)[0-9a-f]{2}\:[0-9a-f]{2}\.[0-9a-f]"

[regex_macros]
HEXA=[a-f0-9]+
BDF=([0-9a-f]{4}\:|)[0-9a-f]{2}\:[0-9a-f]{2}\.[0-9a-f]
DPE is shipped with a preconfigured file that matches the commands used by the standalone DTS version included in the same DOCA installation. The file is located in /opt/mellanox/doca/services/telemetry/dpe/etc/dpe_config.ini.
Using a DPE configuration file allows for a fine-grained control over the interface exposed by it to the rest of the DOCA services. However, even when using the pre-supplied configuration file mentioned above, one should remember that it has been configured to match a fixed DTS version. That is, replacing the standalone DTS version with a new one downloaded from NGC means that the used configuration file might not cover additional features added in the new DTS version.
This chapter provides an overview and deployment configuration of DOCA Telemetry Service with Grafana .
Grafana Deployment Prerequisites
BlueField DPU running DOCA Telemetry Service.
Optional remote server to host Grafana and Prometheus.
Prometheus installed on the host machine. Please refer to the Prometheus website for more information.
Grafana installed on the host machine. Please refer to Grafana Labs website for more information.
Grafana Deployment Configuration
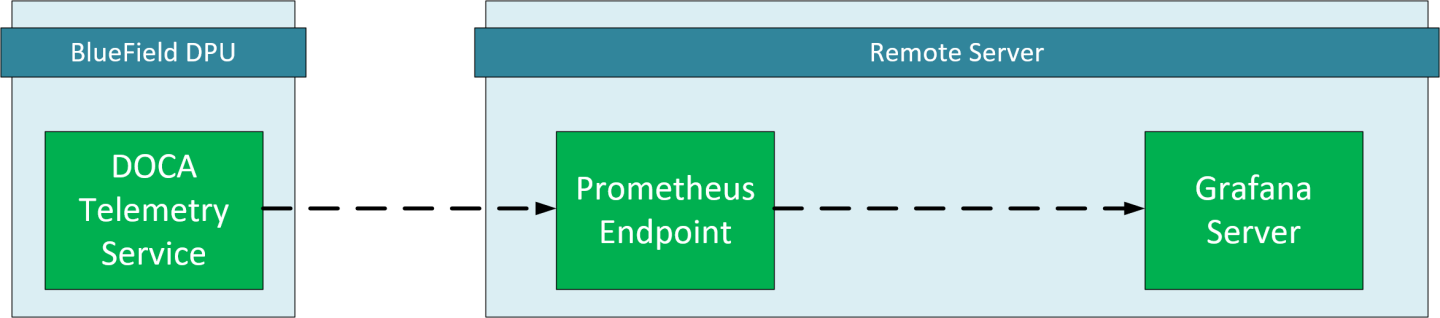
DTS Configuration (DPU Side)
DTS will be configured to export the sysfs counter using the Prometheus plugin.
Sysfs is used as an example, other counters are available. Please refer to the .NVIDIA DOCA Telemetry Service Guide v2.7.0 for more information.
Make sure the sysfs counter is enabled.
            vim /opt/mellanox/doca/services/telemetry/config/dts_config.ini

enable-provider=sysfs
Enable Prometheus exporter by setting the prometheus address and port.
            vim /opt/mellanox/doca/services/telemetry/config/dts_config.ini

prometheus=http://0.0.0.0:9100
NoteIn this example, the Prometheus plugin exports data on localhost port 9100, this is an arbitrary value and can changed.
DTS must be restarted to apply changes.
Prometheus Configuration (Remote Server)
Please download Prometheus for your platform.
Prometheus is configured via command-line flags and a configuration file, prometheus.yml.
Open the prometheus.yml file and configure the DPU as the endpoint target.
            vim prometheus.yml
# metrics_path defaults to '/metrics'
# scheme defaults to 'http'.

static_configs:
- targets: ["<dpu-ip>:<prometheus-port>"]
Where:
<dpu-ip> is the DPU IP address. Prometheus reaches to this IP to pull data.
<prometheus-port> the exporter port that set in DTS configuration.
Run Prometheus server:
./prometheus --config.file="prometheus.yml"
TipPrometheus services are available as Docker images. Please refer to Using Docker in Prometheus' Installation guide.
Grafana Configuration (Remote Server)
Please download and install Grafana for your platform.
Setup Grafana. Please refer to Install Grafana guide in Grafana documentation.
Log into the Grafana dashboard at http://localhost:3000.
NotePort 3000 is the default port number set by Grafana. This can be changed if needed. The default credentials are admin/admin.
Add Prometheus as data source by navigating to Settings → Data sources → Add data source → Prometheus.

Configure the Prometheus data source. Under the HTTP section, set the Prometheus server address.
 Note
NoteThe Prometheus server's default listen port is 9090. Prometheus and Grafana are both running on the same server, thus the address is localhost.
Save and test.
Exploring Telemetry Data
Go to the Explore page on the left-hand side, and choose a Prometheus provider.
Choose a metric to display and specify a label. The label can be used to filter out data based on the source and HCA devices.
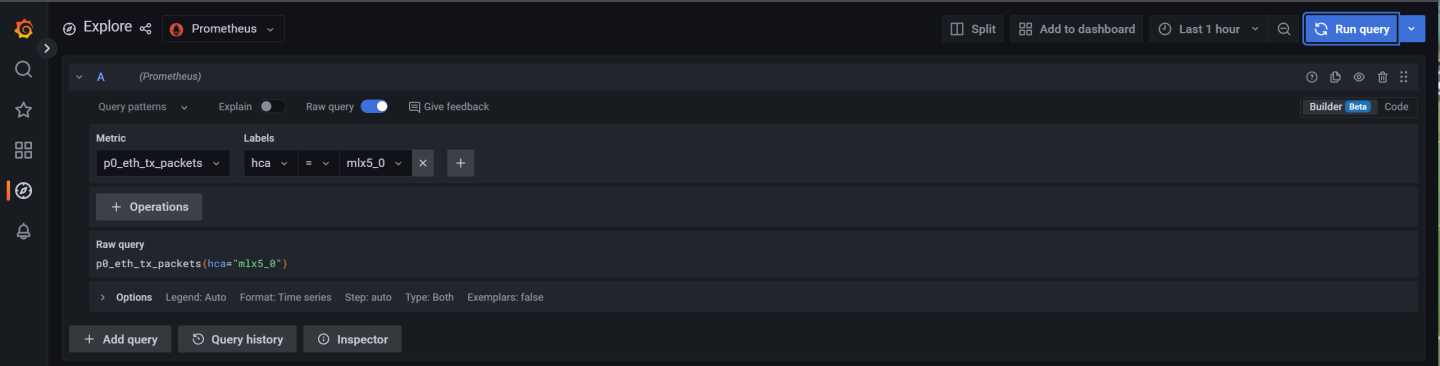
Graph display after selecting a metric and specifying a label to filter by:
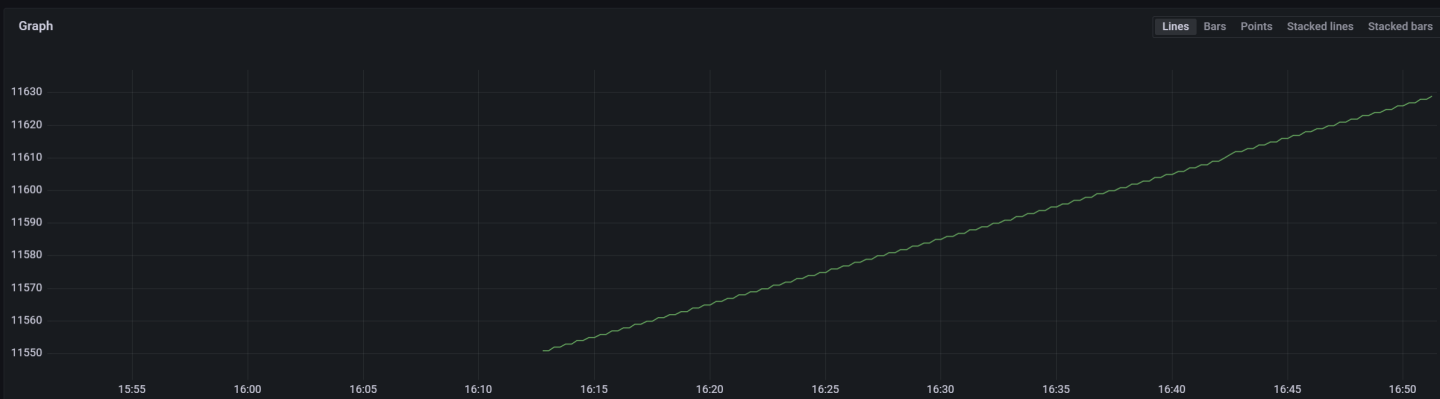
On top of the Troubleshooting section in the NVIDIA DOCA Container Deployment Guide, here are additional troubleshooting tips for DTS:
For general troubleshooting, refer to the NVIDIA DOCA Troubleshooting Guide.
If the pod's state fails to be marked as "Ready", refer to /var/log/syslog.
Check if the service is configured to write data to the disk as this may cause the system to run out of disk space.
If a PIC bus error occurs, configure the following files inside the container:
            crictl exec -it <container-id> /bin/bash
# Add to /config/clx.env the following line:
"
export UCX_TLS=tcp
"