Profiler Guide#
This guide covers deployment, configuration, integration, and troubleshooting for the Dynamo Profiler.
What is a DynamoGraphDeploymentRequest (DGDR)?#
A DynamoGraphDeploymentRequest (DGDR) is a Kubernetes Custom Resource that serves as the primary interface for users to request model deployments with specific performance and resource constraints. You specify:
What model you want to deploy (
model)How it should perform (SLA targets:
ttft,itl)Where it should run (optional GPU preferences)
Which backend to use (
backend: vllm, sglang, or trtllm)Which images to use (
profilingConfig.profilerImage,deploymentOverrides.workersImage)
The Dynamo Operator watches for DGDRs and automatically:
Discovers available GPU resources in your cluster
Runs profiling (online or offline) to find optimal configurations
Generates an optimized DynamoGraphDeployment (DGD) configuration
Deploys the DGD to your cluster
Relationship to DGD:
DGDR: High-level “intent” - what you want deployed
DGD: Low-level “implementation” - how it’s deployed
Support Matrix#
Backend |
Dense Models |
MoE Models |
|---|---|---|
vLLM |
✅ |
🚧 |
SGLang |
✅ |
✅ |
TensorRT-LLM |
✅ |
🚧 |
The profiler sweeps over the following parallelization mappings for prefill and decode:
Model Architecture |
Prefill Parallelization Mapping |
Decode Parallelization Mapping |
|---|---|---|
MLA+MoE (DeepseekV3ForCausalLM, DeepseekV32ForCausalLM) |
TEP, DEP |
TEP, DEP |
GQA+MoE (Qwen3MoeForCausalLM) |
TP, TEP, DEP |
TP, TEP, DEP |
Other Models |
TP |
TP |
Note
Exact model x parallelization mapping support is dependent on the backend. The profiler does not guarantee that the recommended P/D engine configuration is supported and bug-free by the backend.
Deployment#
Kubernetes Deployment (DGDR)#
The recommended deployment method is through DGDRs. Sample configurations are provided in benchmarks/profiler/deploy/:
Sample |
Description |
|---|---|
|
Standard online profiling with AIPerf |
|
Fast offline profiling with AI Configurator |
|
MoE model profiling (SGLang) |
Container Images#
Each DGDR requires container images for profiling and deployment:
profilingConfig.profilerImage(Required): Container image for the profiling job. Must contain the profiler code and dependencies.deploymentOverrides.workersImage(Optional): Container image for DGD worker components (frontend, workers, planner). If omitted, uses image from the base config file.
spec:
  profilingConfig:
    profilerImage: "nvcr.io/nvidia/ai-dynamo/vllm-runtime:0.9.0"
  deploymentOverrides:
    workersImage: "nvcr.io/nvidia/ai-dynamo/vllm-runtime:0.9.0"
Quick Start: Deploy with DGDR#
Step 1: Create Your DGDR
Use a sample configuration or create your own:
apiVersion: nvidia.com/v1alpha1
kind: DynamoGraphDeploymentRequest
metadata:
  name: my-model-profiling
spec:
  model: "Qwen/Qwen3-0.6B"
  backend: vllm
  profilingConfig:
    profilerImage: "nvcr.io/nvidia/ai-dynamo/vllm-runtime:0.9.0"
    config:
      sla:
        isl: 3000
        osl: 150
        ttft: 200.0
        itl: 20.0
  deploymentOverrides:
    workersImage: "nvcr.io/nvidia/ai-dynamo/vllm-runtime:0.9.0"
  autoApply: true
Step 2: Apply the DGDR
export NAMESPACE=your-namespace
kubectl apply -f my-profiling-dgdr.yaml -n $NAMESPACE
Step 3: Monitor Progress
# View status
kubectl get dgdr -n $NAMESPACE

# Detailed status
kubectl describe dgdr my-model-profiling -n $NAMESPACE

# Watch profiling job logs
kubectl logs -f job/profile-my-model-profiling -n $NAMESPACE
DGDR Status States:
Pending: Initial state, preparing to profileProfiling: Running profiling job (20-30 seconds for AIC, 2-4 hours for online)Deploying: Generating and applying DGD configurationReady: DGD successfully deployed and runningFailed: Error occurred (check events for details)
Step 4: Access Your Deployment
# Find the frontend service
kubectl get svc -n $NAMESPACE | grep frontend

# Port-forward to access locally
kubectl port-forward svc/<deployment>-frontend 8000:8000 -n $NAMESPACE

# Test the endpoint
curl http://localhost:8000/v1/models
Note
DGDRs are immutable. To update SLAs or configuration, delete the existing DGDR and create a new one.
Direct Script Execution#
For advanced use cases or local development:
python -m benchmarks.profiler.profile_sla \
  --backend vllm \
  --config path/to/disagg.yaml \
  --model meta-llama/Llama-3-8B \
  --ttft 200 --itl 15 \
  --isl 3000 --osl 150 \
  --min-num-gpus 1 \
  --max-num-gpus 8
Profiling Method#
The profiler follows a 5-step process:
Hardware Setup: Uses defaults or user-specified hardware configuration. Optionally, cluster-scoped operators can enable automatic GPU discovery to detect specifications from cluster nodes.
Identify Sweep Ranges: Automatically determine minimum and maximum number of GPUs per engine. Minimum is determined by the model size and GPU VRAM. Maximum is set to one node for dense models and 4 nodes for MoE models.
Parallelization Mapping Sweep: Test performance of engines with different parallelization mappings using the input ISL and OSL.
For dense models, test different TP sizes for both prefill and decode.
For MoE models (SGLang), evaluate both TEP and DEP as candidates for prefill and decode.
Prefill:
TP/TEP: Measure TTFT with batch size = 1 (assuming ISL is long enough to saturate compute) without KV reuse.
DEP: Attention uses data parallelism. Send a single burst with total concurrency
attention_dp_size × attn_dp_num_req_ratio(defaults to 4) and compute the reported TTFT astime_to_first_token.max / attn_dp_num_req_ratiofrom the AIPerf summary of that burst.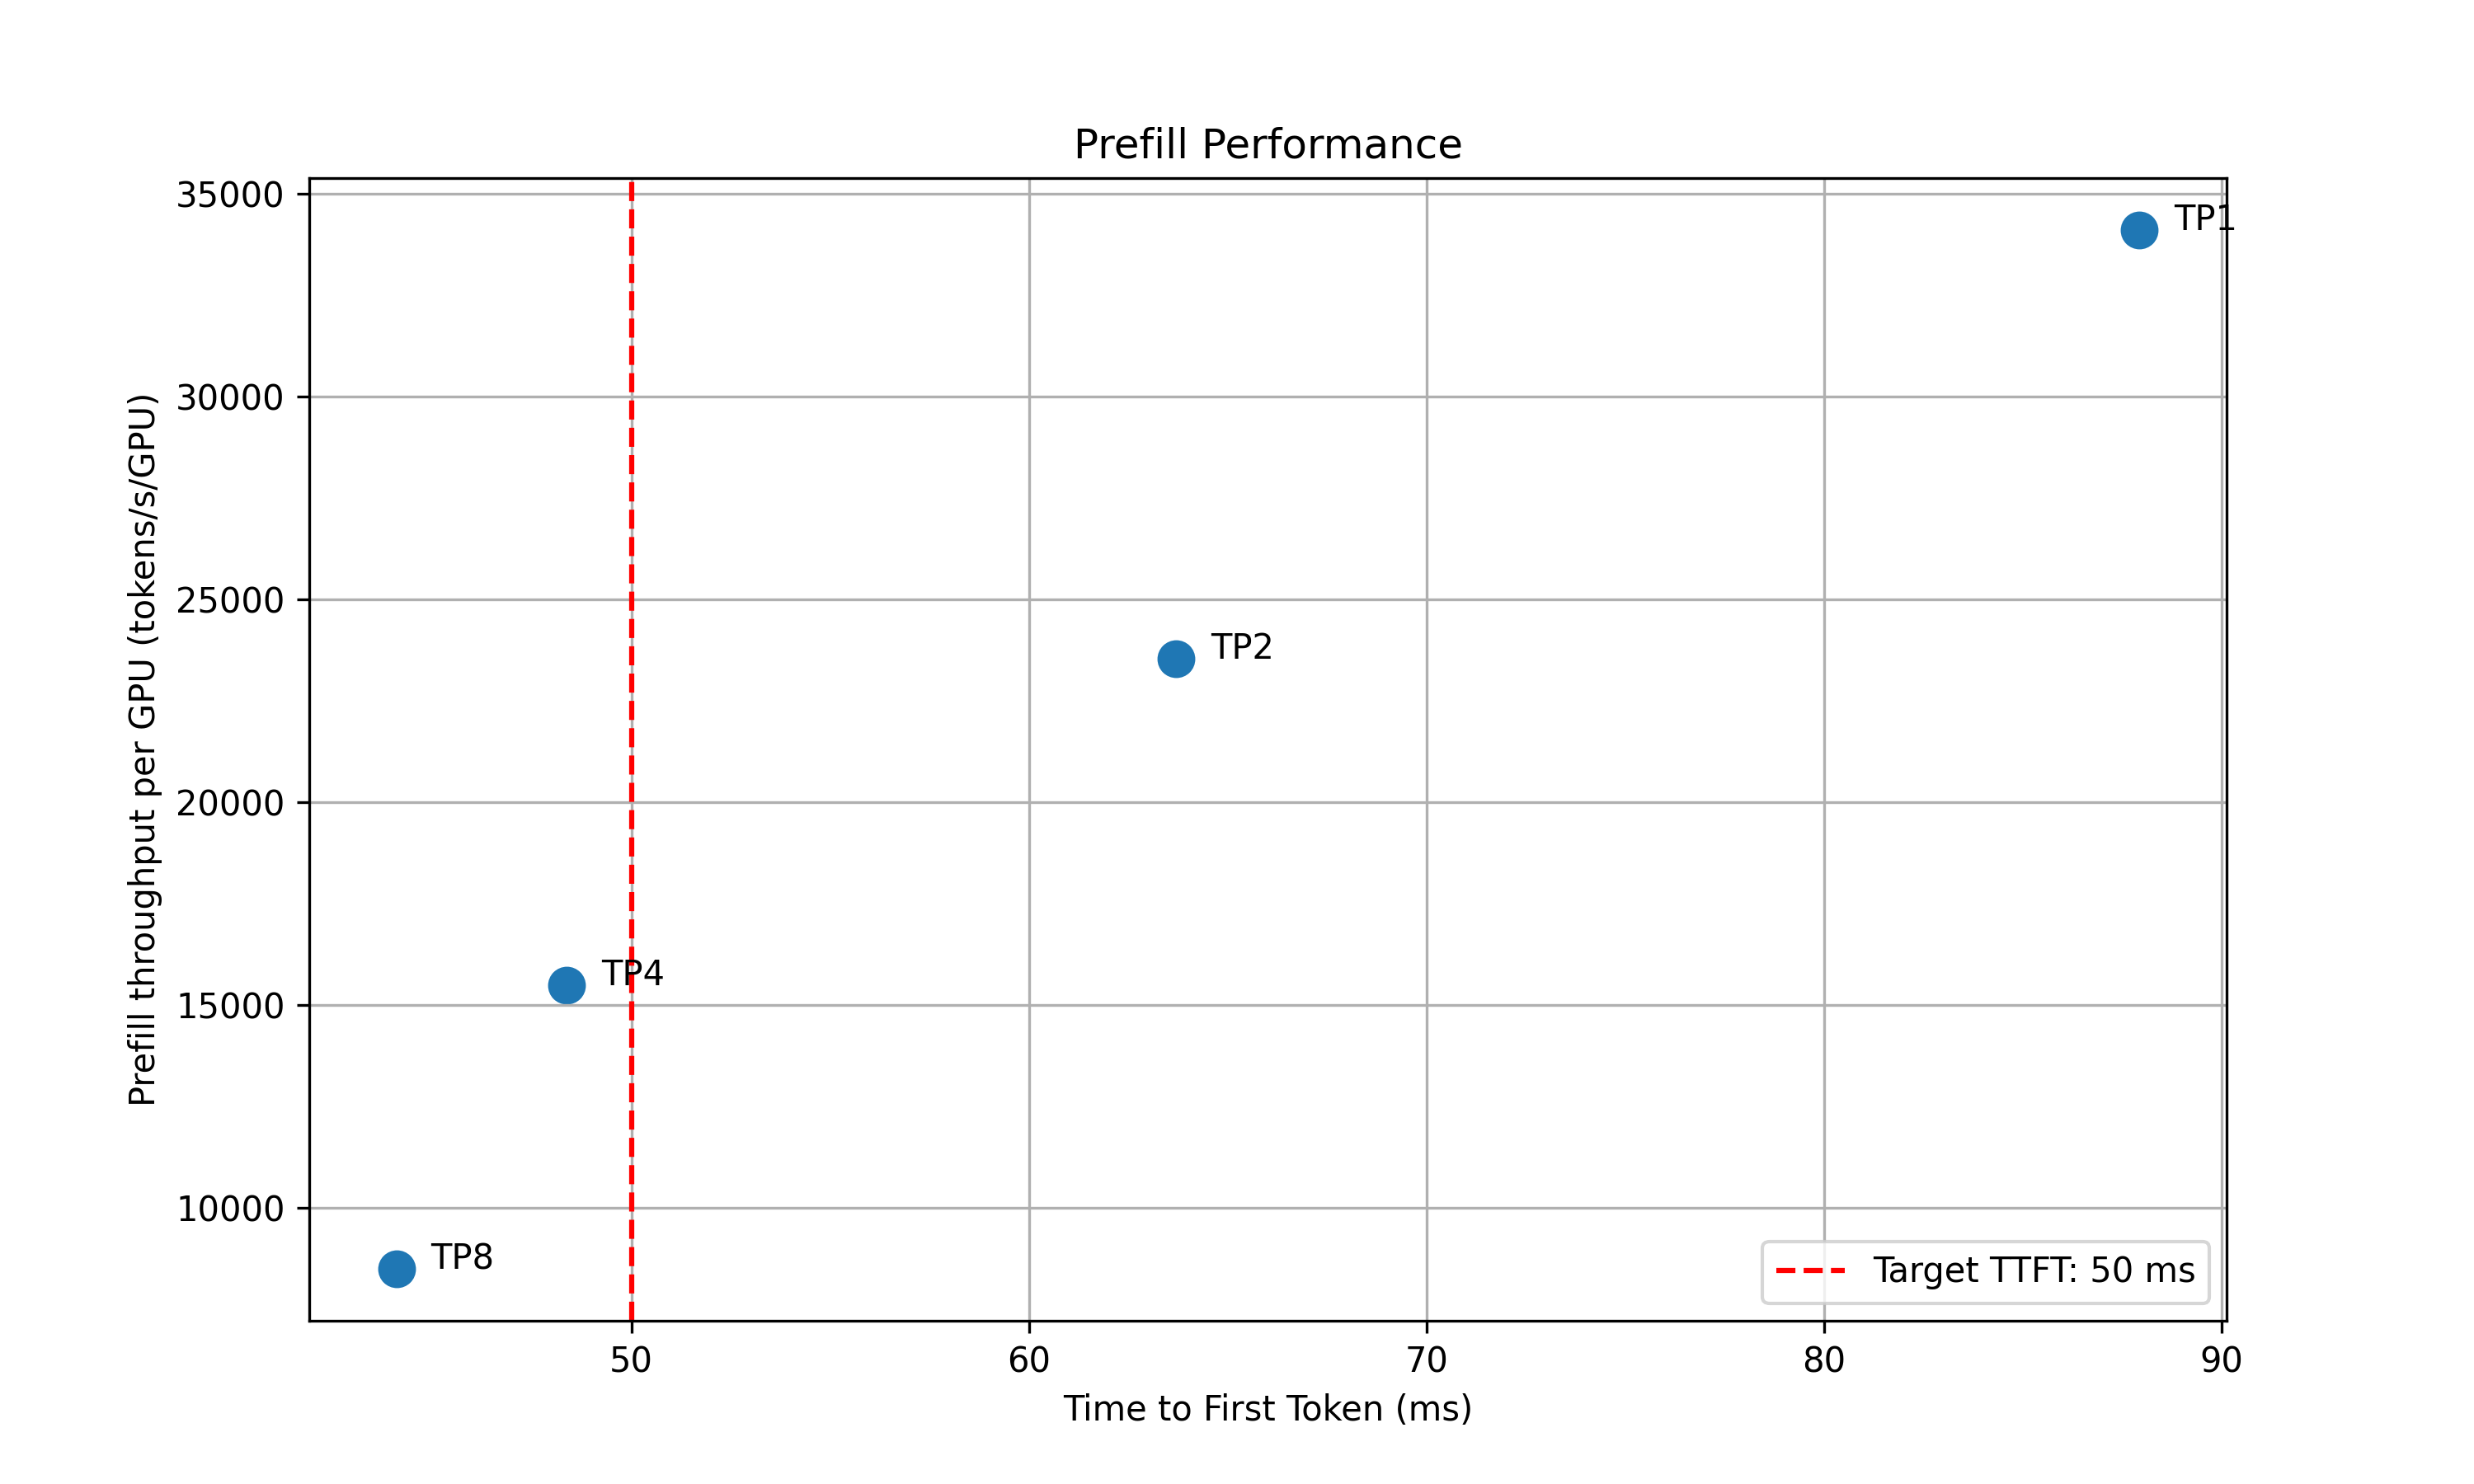
Decode: Measure the ITL under different numbers of in-flight requests, from 1 to the maximum the KV cache can hold. To measure ITL without being affected by piggy-backed prefill requests, the script enables KV-reuse and warms up the engine by issuing the same prompts before measuring.
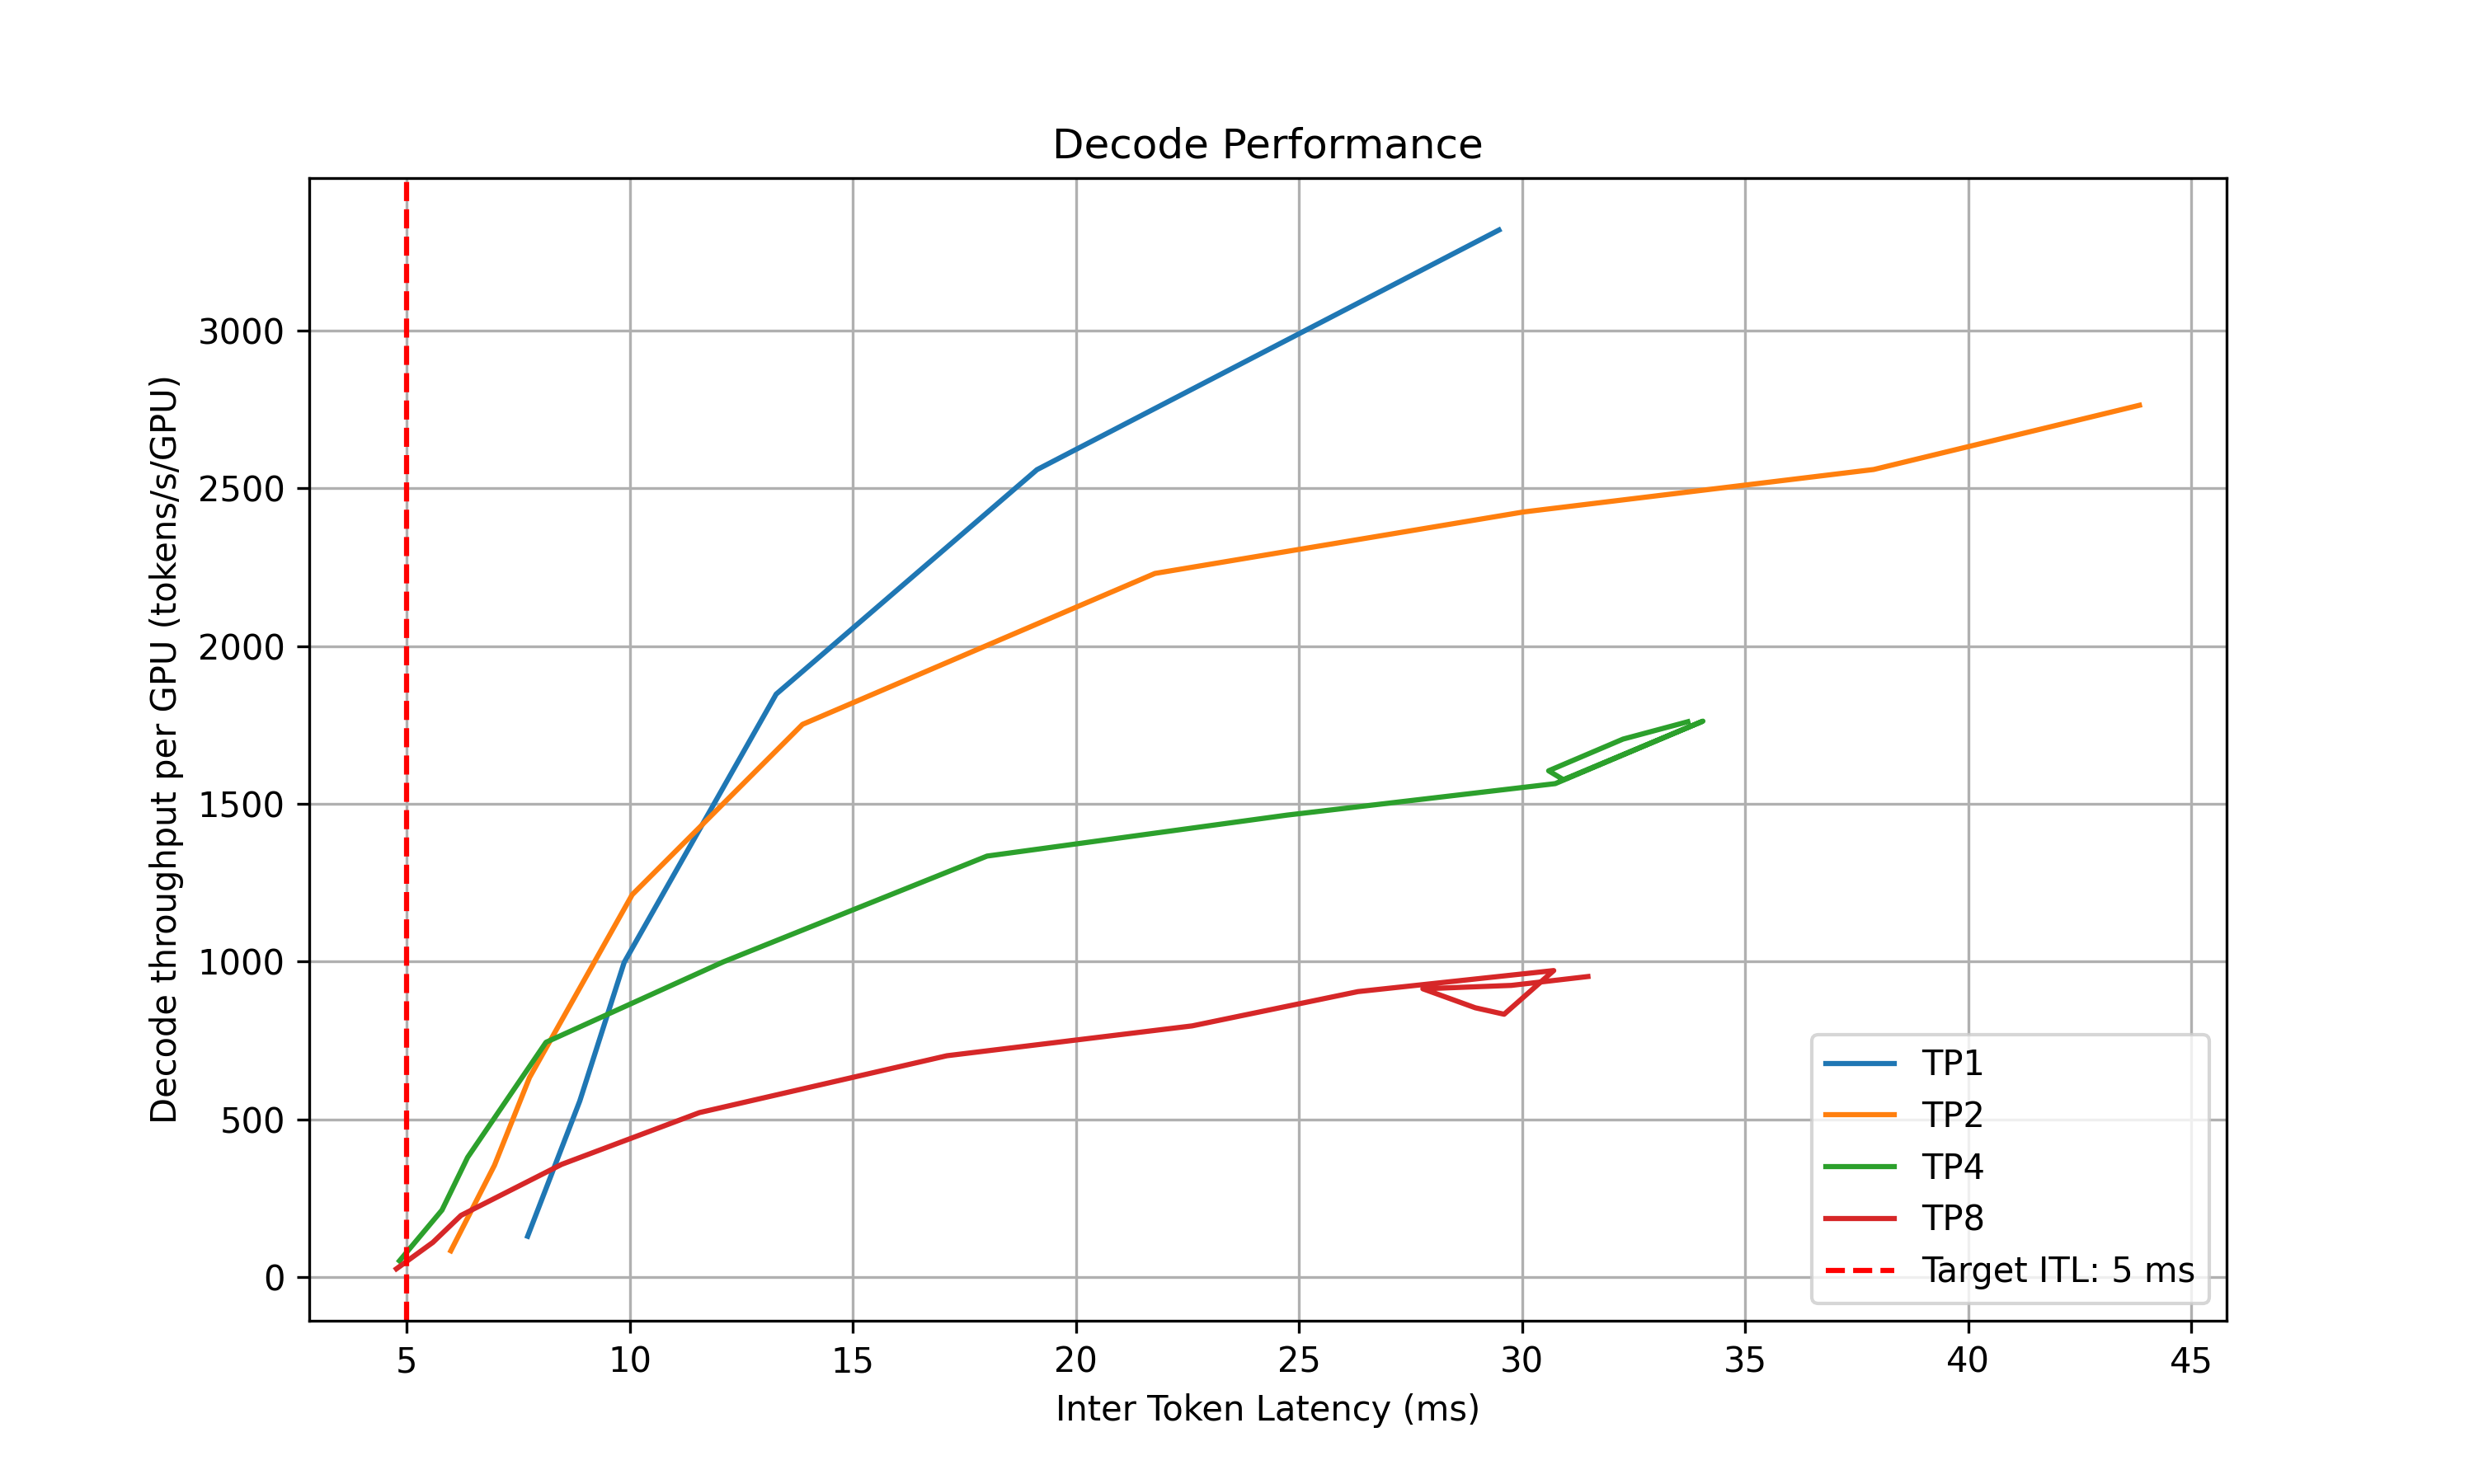
Recommendation: Select optimal parallelization mapping for prefill and decode that achieves the highest per-GPU throughput while adhering to the SLA on TTFT and ITL.
In-Depth Profiling on the Recommended P/D Engine: Interpolate TTFT with ISL and ITL with active KV cache and decode context length for more accurate performance estimation.
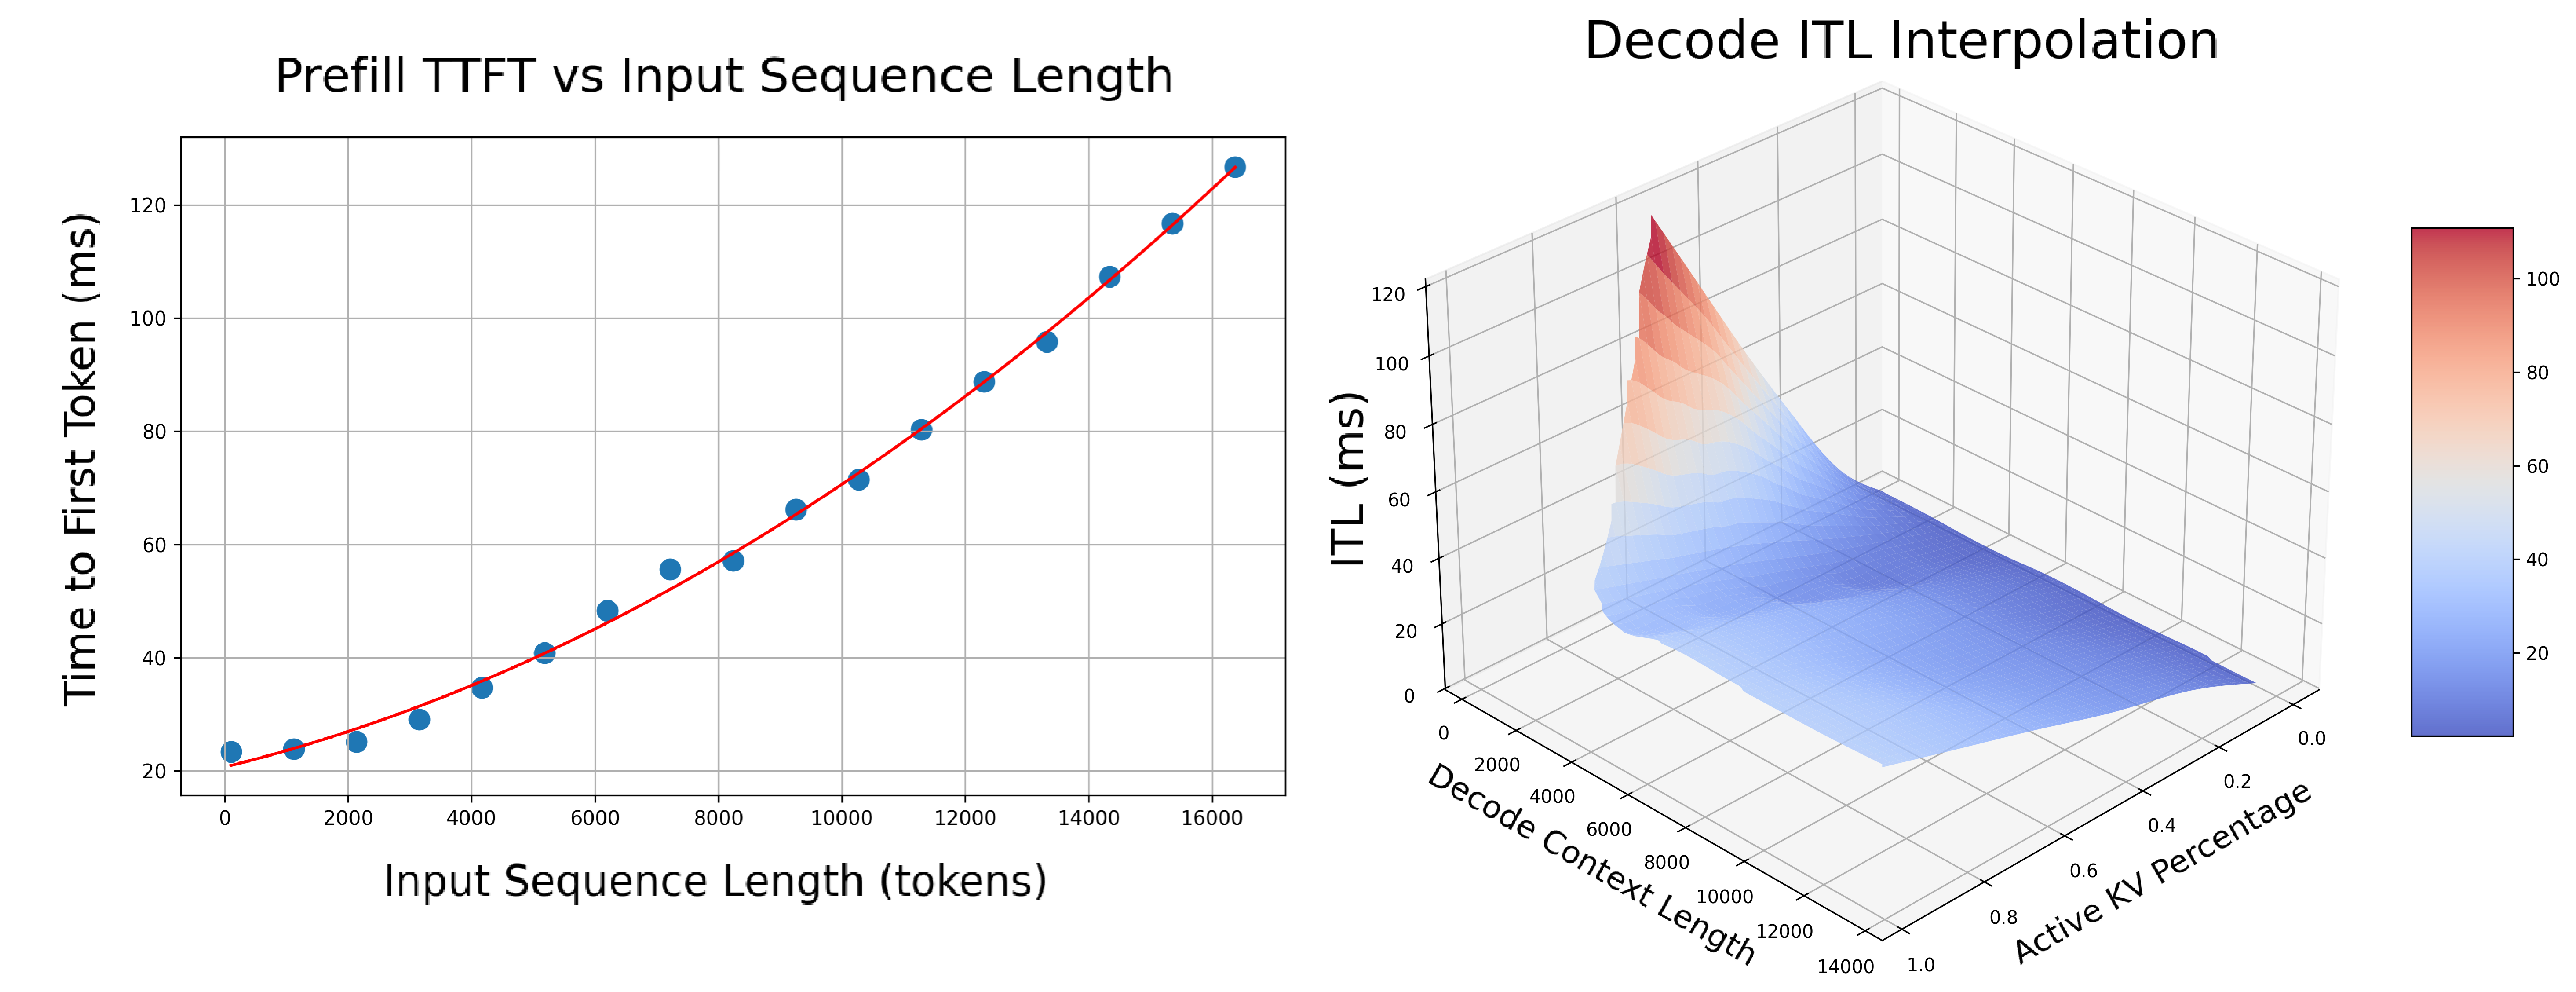
Prefill: Measures TTFT and throughput per GPU across different input lengths with batch size=1.
Decode: Measures ITL and throughput per GPU under various KV cache loads and decode context lengths.
AIPerf on Real Engines#
Profiles your model by creating real test deployments in Kubernetes and measuring their performance.
Duration: 2-4 hours
Accuracy: Highest (real measurements)
GPU Requirements: Full access to test different parallelization mappings
Backends: vLLM, SGLang, TensorRT-LLM
profilingConfig:
  config:
    sweep:
      useAiConfigurator: false  # Default
AI Configurator Simulation#
Uses performance simulation to rapidly estimate optimal configurations without running real deployments.
Duration: 20-30 seconds
Accuracy: Estimated (may have errors for unusual configurations)
GPU Requirements: None
Backends: TensorRT-LLM only (vLLM/SGLang coming soon)
profilingConfig:
  config:
    sweep:
      useAiConfigurator: true
      aicSystem: h200_sxm
      aicHfId: Qwen/Qwen3-32B
      aicBackendVersion: "0.20.0"      # TRT-LLM version simulated by AIC
Note
aicBackendVersion specifies the TensorRT-LLM version that AI Configurator simulates. See the AI Configurator supported features for available versions.
Currently supports:
Backends: TensorRT-LLM (versions 0.20.0, 1.0.0rc3, 1.0.0rc6)
Systems: H100 SXM, H200 SXM, B200 SXM, GB200 SXM, A100 SXM
Models: Wide range including GPT, Llama, Mixtral, DeepSeek, Qwen, and more
See AI Configurator documentation for the full list.
Automatic GPU Discovery#
Cluster-scoped operators can optionally enable automatic GPU discovery:
spec:
  enableGpuDiscovery: true
This is only available with cluster-scoped operators (namespaceRestriction.enabled=false) as it requires cluster-wide node access permissions.
Configuration#
DGDR Configuration Structure#
All profiler configuration goes under spec.profilingConfig.config:
apiVersion: nvidia.com/v1alpha1
kind: DynamoGraphDeploymentRequest
metadata:
  name: my-deployment
spec:
  model: "Qwen/Qwen3-0.6B"
  backend: vllm

  profilingConfig:
    profilerImage: "nvcr.io/nvidia/ai-dynamo/vllm-runtime:0.9.0"
    configMapRef:                  # Optional: base DGD config
      name: my-config
      key: disagg.yaml

    config:
      sla: { ... }
      hardware: { ... }
      sweep: { ... }
      planner: { ... }

  deploymentOverrides:
    workersImage: "nvcr.io/nvidia/ai-dynamo/vllm-runtime:0.9.0"
SLA Configuration (Required)#
sla:
  isl: 3000      # Average input sequence length (tokens)
  osl: 150       # Average output sequence length (tokens)
  ttft: 200.0    # Target Time To First Token (milliseconds)
  itl: 20.0      # Target Inter-Token Latency (milliseconds)
ISL/OSL: Based on your expected traffic patterns
TTFT: First token latency target (lower = more GPUs needed, affects prefill engine)
ITL: Token generation latency target (lower = more GPUs needed, affects decode engine)
Trade-offs: Tighter SLAs require more GPU resources
Hardware Configuration (Optional)#
hardware:
  minNumGpusPerEngine: 2      # Auto-determined from model size and VRAM if not provided
  maxNumGpusPerEngine: 8      # Maximum GPUs to test
  numGpusPerNode: 8           # GPUs per node (for multi-node MoE)
  gpuType: h200_sxm           # GPU type hint (informational, auto-detected)
minNumGpusPerEngine: Skip small TP sizes if your model is large
maxNumGpusPerEngine: Limit search space or work around constraints (e.g., AIC attention heads)
numGpusPerNode: Determine the upper bound of GPUs per node for dense models and configure Grove for multi-node MoE engines
gpuType: Informational only, auto-detected by the controller. For AI Configurator, use
aicSystemin the sweep configuration instead
Tip
If you don’t specify hardware constraints, the controller auto-detects based on your model size and available cluster resources.
Sweep Configuration (Optional)#
sweep:
  useAiConfigurator: false              # Use real profiling (default)
  prefillInterpolationGranularity: 16   # Samples for prefill TTFT curve
  decodeInterpolationGranularity: 6     # Samples for decode ITL curve
useAiConfigurator: Set to
truefor 20-30 second profiling (TensorRT-LLM only)prefillInterpolationGranularity: Samples for prefill TTFT curve (lower = faster but less accurate)
decodeInterpolationGranularity: Samples for decode ITL curve. Since ITL interpolation is 3D and takes longer, we default to fewer samples. Increasing this value may quadratically increase profiling time.
AI Configurator Configuration#
Required if useAiConfigurator: true:
sweep:
  useAiConfigurator: true
  aicSystem: h200_sxm              # h100_sxm, h200_sxm, b200_sxm, gb200_sxm, a100_sxm
  aicHfId: Qwen/Qwen3-32B         # HuggingFace model ID
  aicBackendVersion: "0.20.0"      # TensorRT-LLM version
Planner Configuration (Optional)#
Pass arguments to the SLA planner:
planner:
  planner_min_endpoint: 2                    # Minimum endpoints to maintain
  planner_adjustment_interval: 60            # Adjustment interval (seconds)
  planner_load_predictor: linear             # Load prediction method
Note
Planner arguments use planner_ prefix. See SLA Planner documentation for full list.
Model Cache PVC (Advanced)#
For large models, use a pre-populated PVC containing model weights instead of downloading from HuggingFace:
deployment:
  modelCache:
    pvcName: "model-cache"
    pvcPath: "hub/models--deepseek-ai--DeepSeek-R1"
    mountPath: "/opt/model-cache"
Requirements:
The PVC must exist in the same namespace as the DGDR
The model weights must be accessible at
{mountPath}/{pvcPath}
Engine Configuration (Auto-configured)#
The controller automatically injects these from high-level fields:
# You specify:
spec:
  model: "Qwen/Qwen3-0.6B"
  backend: vllm

# Controller auto-injects:
profilingConfig:
  config:
    deployment:
      model: "Qwen/Qwen3-0.6B"
    engine:
      backend: vllm
      config: /path/to/configmap
You should not manually set deployment.model or engine.backend in profilingConfig.config.
Using Existing DGD Configs (ConfigMap)#
Reference an existing DGD config via ConfigMap:
kubectl create configmap my-config \
  --from-file=disagg.yaml=/path/to/your/disagg.yaml \
  --namespace $NAMESPACE \
  --dry-run=client -o yaml | kubectl apply -f -
profilingConfig:
  configMapRef:
    name: my-config
    key: disagg.yaml
The profiler uses the DGD config as a base template, then optimizes it based on your SLA targets.
CLI Arguments#
Argument |
Type |
Default |
Description |
|---|---|---|---|
|
string |
- |
Inference backend: vllm, sglang, trtllm |
|
string |
- |
Path to DGD YAML config file |
|
string |
- |
HuggingFace model ID |
|
float |
- |
Target TTFT in milliseconds |
|
float |
- |
Target ITL in milliseconds |
|
int |
- |
Average input sequence length |
|
int |
- |
Average output sequence length |
|
int |
auto |
Minimum GPUs per engine |
|
int |
8 |
Maximum GPUs per engine |
|
flag |
false |
Use offline AI Configurator |
|
flag |
false |
Launch interactive WebUI |
|
int |
8000 |
Port for WebUI |
Note
CLI arguments map to DGDR config fields: --min-num-gpus = hardware.minNumGpusPerEngine, --max-num-gpus = hardware.maxNumGpusPerEngine, --use-ai-configurator = sweep.useAiConfigurator. See DGDR Configuration Structure for all field mappings.
Integration#
With SLA Planner#
The Profiler generates interpolation data that the SLA Planner uses for autoscaling decisions.
Prefill Interpolation (selected_prefill_interpolation/raw_data.npz):
prefill_isl: 1D array of input sequence lengths testedprefill_ttft: 1D array of TTFTs (ms) at each ISLprefill_thpt_per_gpu: 1D array of throughput (tokens/s/GPU) at each ISL
Decode Interpolation (selected_decode_interpolation/raw_data.npz):
max_kv_tokens: Total KV tokens capacity in decode enginex_kv_usage: 1D array of active KV usage percentages [0, 1]y_context_length: 1D array of average context lengths testedz_itl: 1D array of ITLs (ms) at each (KV usage, context length) pointz_thpt_per_gpu: 1D array of throughput (tokens/s/GPU) at each point
With Dynamo Operator#
When using DGDR, the Dynamo Operator:
Creates profiling jobs automatically
Stores profiling data in ConfigMaps (
planner-profile-data)Generates optimized DGD configurations
Deploys the DGD with SLA Planner integration
The generated DGD is tracked via labels:
metadata:
  labels:
    dgdr.nvidia.com/name: my-deployment
    dgdr.nvidia.com/namespace: your-namespace
With Observability#
Monitor profiling jobs:
kubectl logs -f job/profile-<dgdr-name> -n $NAMESPACE
kubectl describe dgdr <name> -n $NAMESPACE
Advanced Topics#
Manual Deployment Control#
Disable auto-deployment to review the generated DGD before applying:
spec:
  autoApply: false
Then manually extract and apply:
# Extract generated DGD from DGDR status
kubectl get dgdr my-deployment -n $NAMESPACE -o jsonpath='{.status.generatedDeployment}' | kubectl apply -f -

# Or save to file for review
kubectl get dgdr my-deployment -n $NAMESPACE -o jsonpath='{.status.generatedDeployment}' > my-dgd.yaml
Mocker Deployment#
Deploy a mocker deployment that simulates engines without GPUs:
spec:
  model: <model-name>
  backend: trtllm
  useMocker: true    # Deploy mocker instead of real backend
  autoApply: true
Profiling still runs against the real backend to collect performance data. The mocker uses this data to simulate realistic timing behavior. Useful for large-scale experiments, testing Planner behavior, and validating configurations.
Accessing Profiling Artifacts#
By default, profiling data is stored in ConfigMaps. For detailed artifacts (plots, logs, raw data), attach a PVC:
profilingConfig:
  outputPVC: "dynamo-pvc"
ConfigMaps (always created):
dgdr-output-<name>: Generated DGD configurationplanner-profile-data: Profiling data for Planner (JSON)
PVC artifacts (optional):
Performance plots (PNGs)
DGD configurations for each profiled deployment
AIPerf profiling artifacts
Raw profiling data (
.npzfiles)Profiler logs
Access PVC results:
kubectl apply -f deploy/utils/manifests/pvc-access-pod.yaml -n $NAMESPACE
kubectl wait --for=condition=Ready pod/pvc-access-pod -n $NAMESPACE --timeout=60s
kubectl cp $NAMESPACE/pvc-access-pod:/data ./profiling-results
kubectl delete pod pvc-access-pod -n $NAMESPACE
Output Performance Plots#
The profiler generates plots to visualize performance data:
Parallelization Mapping Sweep Plots:
prefill_performance.png: TTFT vs Parallelization Mapping sizedecode_performance.png: ITL vs Parallelization Mapping size and in-flight requests
In-Depth Profiling Plots:
selected_prefill_interpolation/prefill_ttft_interpolation.png: TTFT vs ISLselected_prefill_interpolation/prefill_throughput_interpolation.png: Throughput vs ISLselected_decode_interpolation/decode_itl_interplation.png: ITL vs KV usage and context lengthselected_decode_interpolation/decode_throughput_interpolation.png: Throughput vs KV usage and context length
Runtime Profiling (SGLang)#
SGLang workers expose profiling endpoints for runtime performance analysis:
# Start profiling
curl -X POST http://localhost:9090/engine/start_profile \
  -H "Content-Type: application/json" \
  -d '{"output_dir": "/tmp/profiler_output"}'

# Run inference requests...

# Stop profiling
curl -X POST http://localhost:9090/engine/stop_profile
View traces using Chrome’s chrome://tracing, Perfetto UI, or TensorBoard.
Troubleshooting#
Profiling Takes Too Long#
Solution 1: Use AI Configurator for rapid profiling (TensorRT-LLM only):
sweep:
  useAiConfigurator: true
Solution 2: Reduce search space:
hardware:
  minNumGpusPerEngine: 4  # Skip TP1, TP2
  maxNumGpusPerEngine: 8  # Don't test beyond TP8
SLA Cannot Be Met#
Symptoms: Profiler reports no configuration meets targets
Solutions:
Relax SLA targets (increase TTFT/ITL)
Add more GPU resources
Try a different backend
Use a smaller model
AI Configurator: Attention Head Constraint Error#
Symptoms: Profiling fails with error:
AssertionError: num_heads <N> should be divisible by tp_size <M> and the division result should be >= 4
Cause: AI Configurator requires ≥4 attention heads per GPU. Small models with few heads cannot use high TP sizes.
Affected Models:
Qwen3-0.6B (16 heads): Max TP = 4
GPT-2 (12 heads): Max TP = 3
Most models <1B parameters: May hit this constraint
Solution: Limit maxNumGpusPerEngine:
hardware:
  maxNumGpusPerEngine: 4  # For Qwen3-0.6B (16 heads / 4 = max TP of 4)
Calculate Max TP: max_tp = num_attention_heads / 4
Note
This is an AI Configurator limitation. Online profiling doesn’t have this constraint.
Image Pull Errors#
Symptoms: ErrImagePull or ImagePullBackOff
Solution: Ensure image pull secrets are configured:
kubectl create secret docker-registry nvcr-imagepullsecret \
  --docker-server=nvcr.io \
  --docker-username='$oauthtoken' \
  --docker-password=<NGC_API_KEY> \
  --namespace <your-namespace>
Out of Memory During Profiling#
Symptoms: OOM errors in profiling jobs
Solutions:
Reduce
gpu_memory_utilizationin engine configReduce
--max-context-lengthSkip larger TP configurations
Use fewer GPUs per test
Unsupported Parallelization Mapping in Backend#
Symptoms: Startup/runtime error in the backend (e.g., prime number of attention heads constraining TP to 1, or backend not supporting different TP sizes for prefill and decode).
Solutions:
Contact the backend to add support and bump backend version in Dynamo
Constrain the max and min number of GPUs per engine to the supported range
See Also#
Profiler Examples - Complete DGDR YAML examples
SLA Planner Guide - End-to-end deployment workflow
SLA Planner Architecture - How the Planner uses profiling data
DGDR API Reference - DGDR specification
Profiler Arguments Reference - Full CLI reference