Dynamo Logging#
Overview#
Dynamo provides structured logging in both text as well as JSONL. When
JSONL is enabled, logs support trace_id and span_id fields for
distributed tracing. Span creation and exit events can be optionally
enabled via the DYN_LOGGING_SPAN_EVENTS environment variable.
Environment Variables#
Variable |
Description |
Default |
Example |
|---|---|---|---|
|
Enable JSONL logging format |
|
|
|
Enable span entry/close event logging ( |
|
|
|
Log levels per target |
|
|
|
Use local timezone for timestamps (default is UTC) |
|
|
|
Path to custom TOML logging configuration |
none |
|
|
Service name for trace and span information |
|
|
|
Enable OTLP trace exporting |
|
|
|
OTLP exporter endpoint |
|
|
Getting Started Quickly#
Start Observability Stack#
For collecting and visualizing logs with Grafana Loki (Kubernetes), or viewing trace context in logs alongside Grafana Tempo, start the observability stack. See Observability Getting Started for instructions.
Enable Structured Logging#
Enable structured JSONL logging:
export DYN_LOGGING_JSONL=true
export DYN_LOG=debug

# Start your Dynamo components (default port 8000, override with --http-port or DYN_HTTP_PORT env var)
python -m dynamo.frontend &
python -m dynamo.vllm --model Qwen/Qwen3-0.6B --enforce-eager &
Logs will be written to stderr in JSONL format with trace context.
Available Logging Levels#
Logging Levels (Least to Most Verbose) |
Description |
|---|---|
ERROR |
Critical errors (e.g., unrecoverable failures, resource exhaustion) |
WARN |
Unexpected or degraded situations (e.g., retries, recoverable errors) |
INFO |
Operational information (e.g., startup/shutdown, major events) |
DEBUG |
General debugging information (e.g., variable values, flow control) |
TRACE |
Very low-level, detailed information (e.g., internal algorithm steps) |
Example Readable Format#
Environment Setting:
export DYN_LOG="info,dynamo_runtime::system_status_server:trace"
export DYN_LOGGING_JSONL="false"
Resulting Log format:
2025-09-02T15:50:01.770028Z  INFO main.init: VllmWorker for Qwen/Qwen3-0.6B has been initialized
2025-09-02T15:50:01.770195Z  INFO main.init: Reading Events from tcp://127.0.0.1:21555
2025-09-02T15:50:01.770265Z  INFO main.init: Getting engine runtime configuration metadata from vLLM engine...
2025-09-02T15:50:01.770316Z  INFO main.get_engine_cache_info: Cache config values: {'num_gpu_blocks': 24064}
2025-09-02T15:50:01.770358Z  INFO main.get_engine_cache_info: Scheduler config values: {'max_num_seqs': 256, 'max_num_batched_tokens': 2048}
Example JSONL Format#
Environment Setting:
export DYN_LOG="info,dynamo_runtime::system_status_server:trace"
export DYN_LOGGING_JSONL="true"
Resulting Log format:
{"time":"2025-09-02T15:53:31.943377Z","level":"INFO","target":"log","message":"VllmWorker for Qwen/Qwen3-0.6B has been initialized","log.file":"/opt/dynamo/venv/lib/python3.12/site-packages/dynamo/vllm/main.py","log.line":191,"log.target":"main.init"}
{"time":"2025-09-02T15:53:31.943550Z","level":"INFO","target":"log","message":"Reading Events from tcp://127.0.0.1:26771","log.file":"/opt/dynamo/venv/lib/python3.12/site-packages/dynamo/vllm/main.py","log.line":212,"log.target":"main.init"}
{"time":"2025-09-02T15:53:31.943636Z","level":"INFO","target":"log","message":"Getting engine runtime configuration metadata from vLLM engine...","log.file":"/opt/dynamo/venv/lib/python3.12/site-packages/dynamo/vllm/main.py","log.line":220,"log.target":"main.init"}
{"time":"2025-09-02T15:53:31.943701Z","level":"INFO","target":"log","message":"Cache config values: {'num_gpu_blocks': 24064}","log.file":"/opt/dynamo/venv/lib/python3.12/site-packages/dynamo/vllm/main.py","log.line":267,"log.target":"main.get_engine_cache_info"}
{"time":"2025-09-02T15:53:31.943747Z","level":"INFO","target":"log","message":"Scheduler config values: {'max_num_seqs': 256, 'max_num_batched_tokens': 2048}","log.file":"/opt/dynamo/venv/lib/python3.12/site-packages/dynamo/vllm/main.py","log.line":268,"log.target":"main.get_engine_cache_info"}
Logging of Trace and Span IDs#
When DYN_LOGGING_JSONL is enabled, all logs include trace_id and span_id fields, and spans are automatically created for requests. This is useful for short debugging sessions where you want to examine trace context in logs without setting up a full tracing backend and for correlating log messages with traces.
The trace and span information uses the OpenTelemetry format and libraries, which means the IDs are compatible with OpenTelemetry-based tracing backends like Tempo or Jaeger if you later choose to enable trace export.
Note: This section has overlap with Distributed Tracing with Tempo. For trace visualization in Grafana Tempo and persistent trace analysis, see Distributed Tracing with Tempo.
Configuration for Logging#
To see trace information in logs:
export DYN_LOGGING_JSONL=true
export DYN_LOG=debug  # Set to debug to see detailed trace logs

# Start your Dynamo components (e.g., frontend and worker) (default port 8000, override with --http-port or DYN_HTTP_PORT env var)
python -m dynamo.frontend &
python -m dynamo.vllm --model Qwen/Qwen3-0.6B --enforce-eager &
This enables JSONL logging with trace_id and span_id fields. Traces appear in logs but are not exported to any backend.
Example Request#
Send a request to generate logs with trace context:
curl -H 'Content-Type: application/json' \
-H 'x-request-id: test-trace-001' \
-d '{
  "model": "Qwen/Qwen3-0.6B",
  "max_completion_tokens": 100,
  "messages": [
    {"role": "user", "content": "What is the capital of France?"}
  ]
}' \
http://localhost:8000/v1/chat/completions
Check the logs (stderr) for JSONL output containing trace_id, span_id, and x_request_id fields.
Trace and Span Information in Logs#
This section shows how trace and span information appears in JSONL logs. These logs can be used to understand request flows even without a trace visualization backend.
Example Disaggregated Trace in Grafana#
When viewing the corresponding trace in Grafana, you should be able to see something like the following:
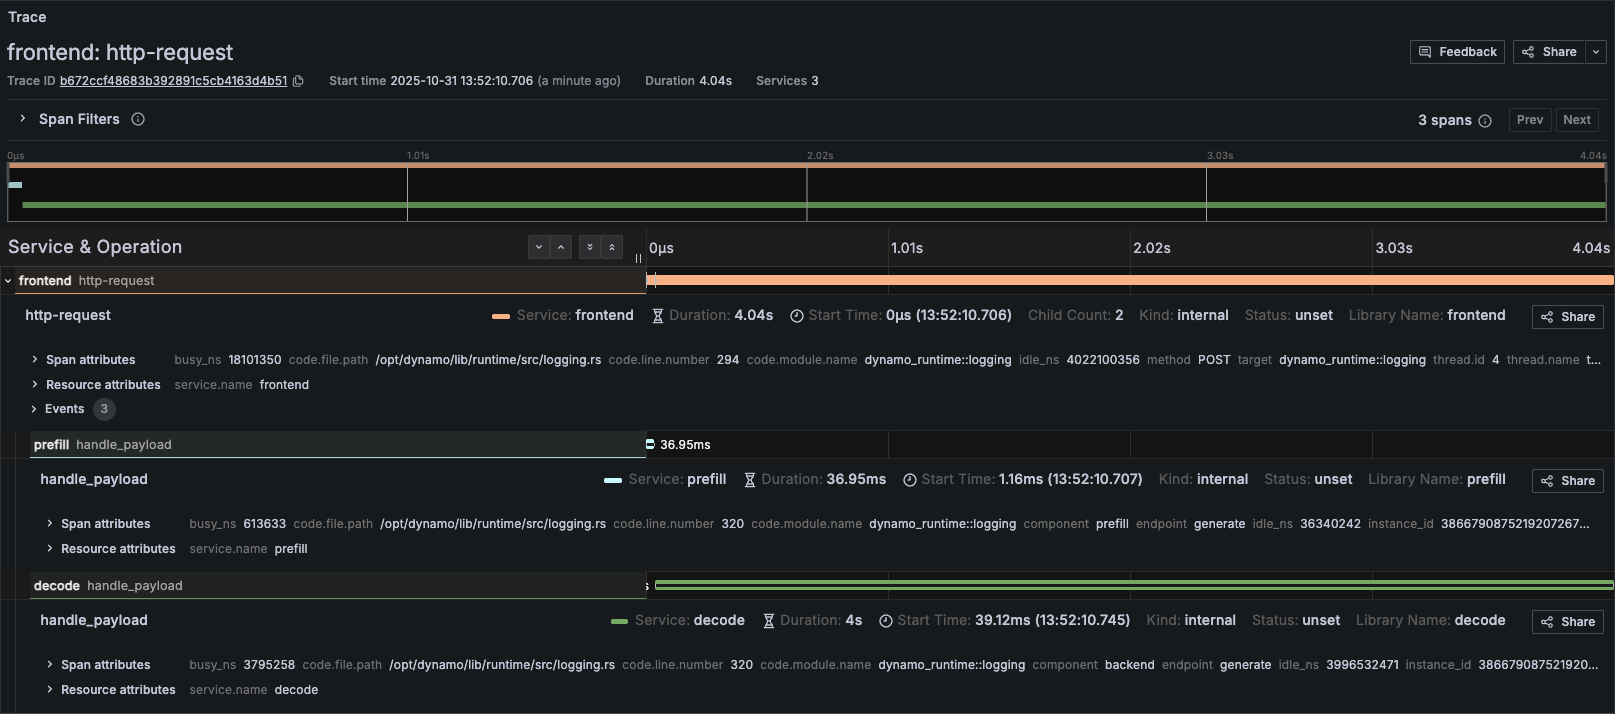
Trace Overview#
Attribute |
Value |
|---|---|
Trace ID |
b672ccf48683b392891c5cb4163d4b51 |
Start Time |
2025-10-31 13:52:10.706 |
Duration |
4.04s |
Request |
|
Root Span (Frontend): http-request#
Attribute |
Value |
|---|---|
Service |
frontend |
Span ID |
5c20cc08e6afb2b7 |
Duration |
4.04s |
Start Time |
13:52:10.706 |
Status |
unset |
Method |
POST |
URI |
|
HTTP Version |
HTTP/1.1 |
Parent ID |
(none) |
Child Count |
2 |
Busy Time |
18,101,350 ns (18.10ms) |
Idle Time |
4,022,100,356 ns (4.02s) |
Child Span (Prefill): handle_payload#
Attribute |
Value |
|---|---|
Service |
prefill |
Duration |
39.65ms |
Start Time |
13:52:10.707 |
Status |
unset |
Component |
prefill |
Endpoint |
generate |
Namespace |
vllm-disagg |
Instance ID |
3866790875219207267 |
Trace ID |
b672ccf48683b392891c5cb4163d4b51 |
Parent ID |
5c20cc08e6afb2b7 |
Busy Time |
613,633 ns (0.61ms) |
Idle Time |
36,340,242 ns (36.34ms) |
Child Span (Decode): handle_payload#
Attribute |
Value |
|---|---|
Service |
decode |
Duration |
4s |
Start Time |
13:52:10.745 |
Status |
unset |
Component |
backend |
Endpoint |
generate |
Namespace |
vllm-disagg |
Instance ID |
3866790875219207263 |
Trace ID |
b672ccf48683b392891c5cb4163d4b51 |
Parent ID |
5c20cc08e6afb2b7 |
Busy Time |
3,795,258 ns (3.79ms) |
Idle Time |
3,996,532,471 ns (3.99s) |
Frontend Logs with Trace Context#
The following shows the JSONL logs from the frontend service for the same request. Note the trace_id field (b672ccf48683b392891c5cb4163d4b51) that correlates all logs for this request, and the span_id field that identifies individual operations:
{"time":"2025-10-31T20:52:07.707164Z","level":"INFO","file":"/opt/dynamo/lib/runtime/src/logging.rs","line":806,"target":"dynamo_runtime::logging","message":"OTLP export enabled","endpoint":"http://tempo.tm.svc.cluster.local:4317","service":"frontend"}
{"time":"2025-10-31T20:52:10.707164Z","level":"DEBUG","file":"/opt/dynamo/lib/runtime/src/pipeline/network/tcp/server.rs","line":230,"target":"dynamo_runtime::pipeline::network::tcp::server","message":"Registering new TcpStream on 10.0.4.65:41959","method":"POST","span_id":"5c20cc08e6afb2b7","span_name":"http-request","trace_id":"b672ccf48683b392891c5cb4163d4b51","uri":"/v1/chat/completions","version":"HTTP/1.1"}
{"time":"2025-10-31T20:52:10.745264Z","level":"DEBUG","file":"/opt/dynamo/lib/llm/src/kv_router/prefill_router.rs","line":232,"target":"dynamo_llm::kv_router::prefill_router","message":"Prefill succeeded, using disaggregated params for decode","method":"POST","span_id":"5c20cc08e6afb2b7","span_name":"http-request","trace_id":"b672ccf48683b392891c5cb4163d4b51","uri":"/v1/chat/completions","version":"HTTP/1.1"}
{"time":"2025-10-31T20:52:10.745545Z","level":"DEBUG","file":"/opt/dynamo/lib/runtime/src/pipeline/network/tcp/server.rs","line":230,"target":"dynamo_runtime::pipeline::network::tcp::server","message":"Registering new TcpStream on 10.0.4.65:41959","method":"POST","span_id":"5c20cc08e6afb2b7","span_name":"http-request","trace_id":"b672ccf48683b392891c5cb4163d4b51","uri":"/v1/chat/completions","version":"HTTP/1.1"}
Custom Request IDs in Logs#
You can provide a custom request ID using the x-request-id header. This ID will be attached to all spans and logs for that request, making it easier to correlate traces with application-level request tracking.
Example Request with Custom Request ID#
curl -X POST http://localhost:8000/v1/chat/completions \
  -H 'Content-Type: application/json' \
  -H 'x-request-id: 8372eac7-5f43-4d76-beca-0a94cfb311d0' \
  -d '{
    "model": "Qwen/Qwen3-0.6B",
    "messages": [
      {
        "role": "user",
        "content": "Explain why Roger Federer is considered one of the greatest tennis players of all time"
      }
    ],
    "stream": false,
    "max_tokens": 1000
  }'
All spans and logs for this request will include the x_request_id attribute with value 8372eac7-5f43-4d76-beca-0a94cfb311d0.
Frontend Logs with Custom Request ID#
Notice how the x_request_id field appears in all log entries, alongside the trace_id (80196f3e3a6fdf06d23bb9ada3788518) and span_id:
{"time":"2025-10-31T21:06:45.397194Z","level":"DEBUG","file":"/opt/dynamo/lib/runtime/src/pipeline/network/tcp/server.rs","line":230,"target":"dynamo_runtime::pipeline::network::tcp::server","message":"Registering new TcpStream on 10.0.4.65:41959","method":"POST","span_id":"f7e487a9d2a6bf38","span_name":"http-request","trace_id":"80196f3e3a6fdf06d23bb9ada3788518","uri":"/v1/chat/completions","version":"HTTP/1.1","x_request_id":"8372eac7-5f43-4d76-beca-0a94cfb311d0"}
{"time":"2025-10-31T21:06:45.418584Z","level":"DEBUG","file":"/opt/dynamo/lib/llm/src/kv_router/prefill_router.rs","line":232,"target":"dynamo_llm::kv_router::prefill_router","message":"Prefill succeeded, using disaggregated params for decode","method":"POST","span_id":"f7e487a9d2a6bf38","span_name":"http-request","trace_id":"80196f3e3a6fdf06d23bb9ada3788518","uri":"/v1/chat/completions","version":"HTTP/1.1","x_request_id":"8372eac7-5f43-4d76-beca-0a94cfb311d0"}
{"time":"2025-10-31T21:06:45.418854Z","level":"DEBUG","file":"/opt/dynamo/lib/runtime/src/pipeline/network/tcp/server.rs","line":230,"target":"dynamo_runtime::pipeline::network::tcp::server","message":"Registering new TcpStream on 10.0.4.65:41959","method":"POST","span_id":"f7e487a9d2a6bf38","span_name":"http-request","trace_id":"80196f3e3a6fdf06d23bb9ada3788518","uri":"/v1/chat/completions","version":"HTTP/1.1","x_request_id":"8372eac7-5f43-4d76-beca-0a94cfb311d0"}