
RAG Retrieval Performance Results#
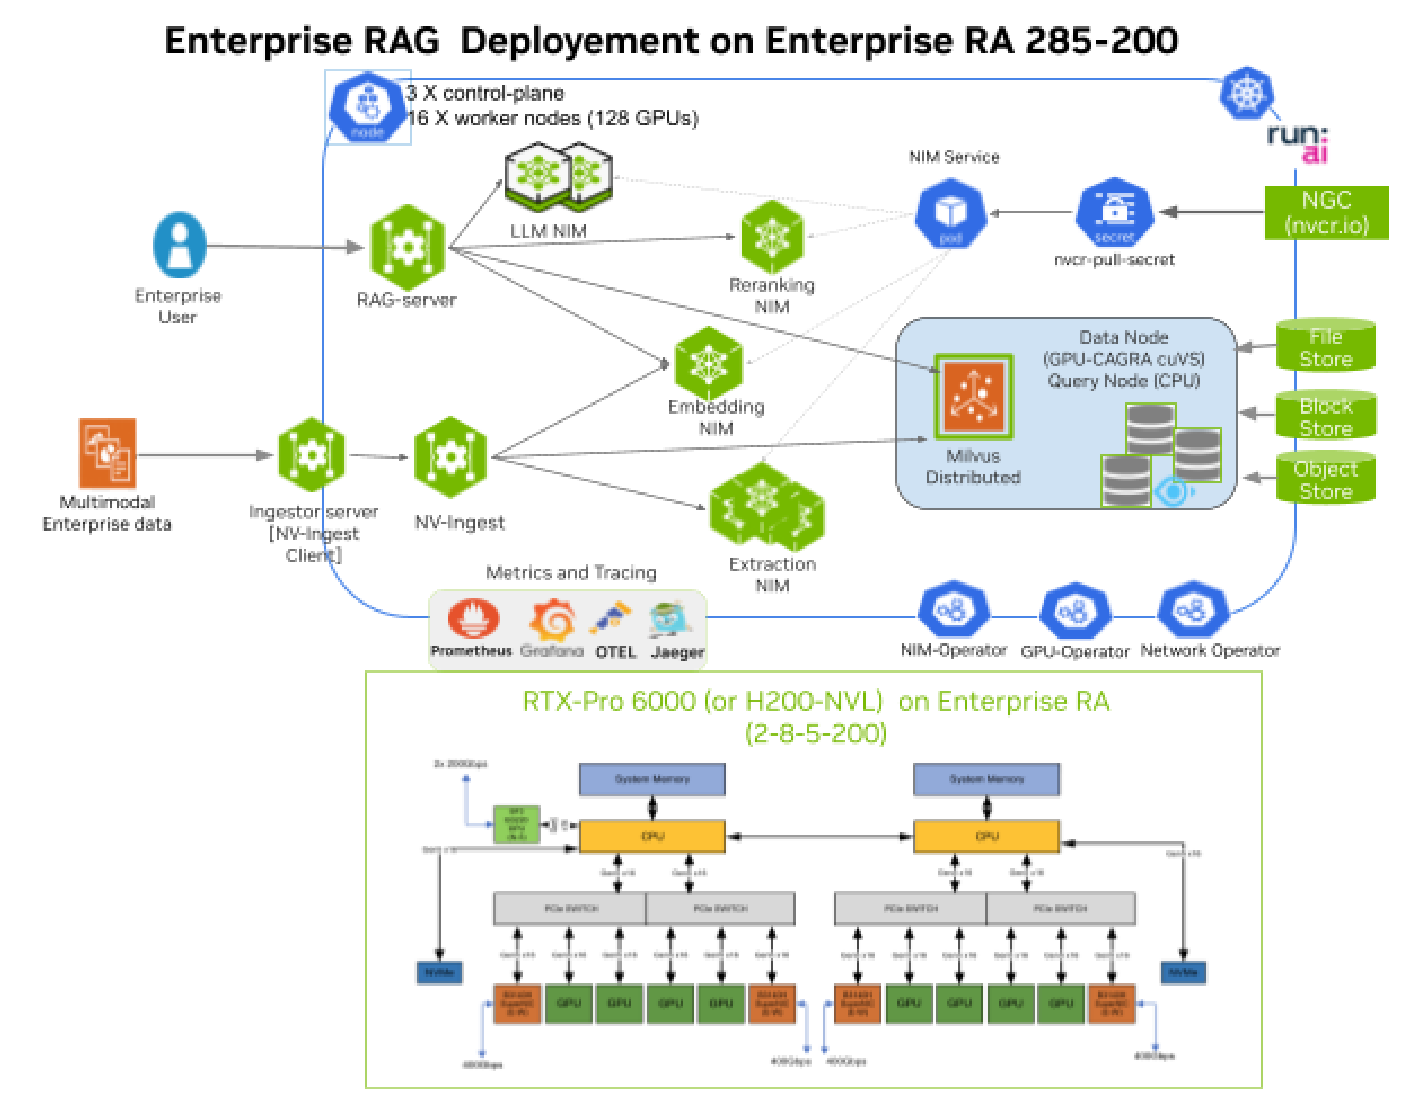
Figure 23 Enterprise RAG Deployment on Enterprise RA 285-200#
For RAG Retrieval performance the performance benchmarking was performed on ERA 285-200 on RTX PRO 6000 and H200 NVL.
RAG Chat (128/128) Retrieval Performance#
Usecase - Reranker ON, VDB TopK=10, Reranker TopK=4
Benchmark RAG Chat (128/128) on Enterprise RA 2-8-5-200
GPU - RTX PRO 6000 and H200 NVL
RAG Scale 1X (2.75 GPUs, 1 Node) to Scale 96X (109.25 GPUs, 14 Nodes) based on the RAG benchmarking test plan:
LLM NIM scale from 1X to 96X (96 GPUs), 1:1 ratio
LLM NIM - Model: llama-3.3-nemotron-super-49b-v1.5
RTX PRO 6000: vLLM, NVFP4, TP1, throughput
H200 NVL: vLLM, FP8, TP1, throughput
Reranking NIM scale from 1X (1 GPU) to 12X (12 GPUs), 1:8 ratio
Embedding NIM Scale from 1X (0.5 GPU) to 2X (1 GPU), 1:50 ratio
Milvus Vector DB scale - Query node scale from 2X to 6X, 1:16 ratio, scale based on expected query rate
Query node (CPU) (16 vCPU, 40 GiB)
RAG server scale from 1X to 12X, 1:8 ratio
RAG server (64 workers, 16 vCPU, 64 GiB)
For the RAG Chat (128/128) use case need to determine Concurrency and Throughput for Low Latency (TTFT <3s), Balanced Performance (TTFT <6s) and Max Throughput (TTFT <10s) constraints.
Below is a snapshot of the LLM dashboard when benchmarking RAG Chat(128/128) at Scale 2X, LLM 2X, Reranker 1X, Embed 1X, RAG server 1X, Milvus 1 Query node.
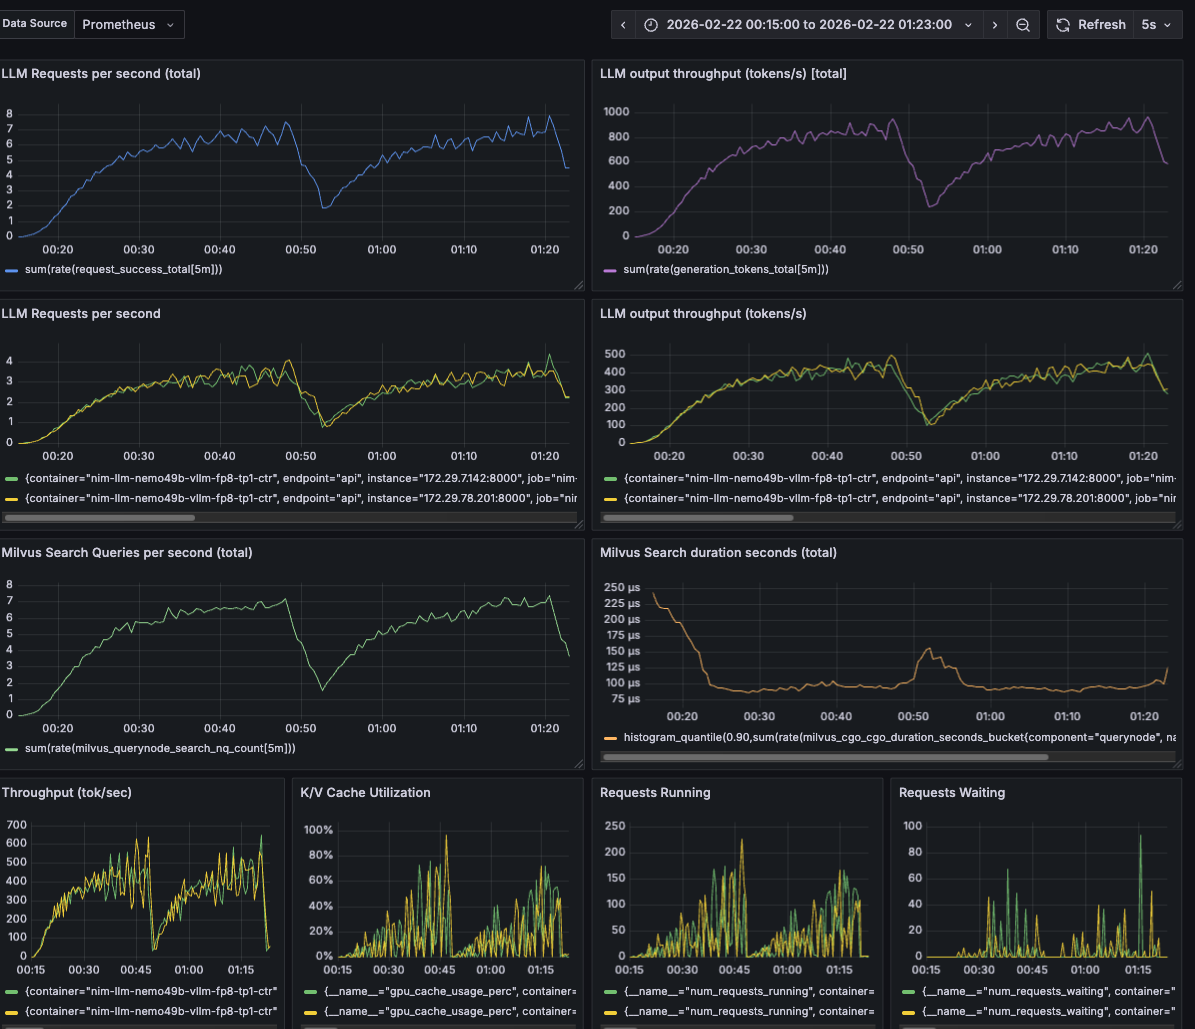
Figure 24 LLM Dashboard - RAG Chat(128/128) Scale 2X#
Below is a snapshot of the Reranking and Embedding NIM dashboard when benchmarking RAG Chat(128/128) at Scale 2X, LLM 2X, Reranker 1X, Embed 1X.
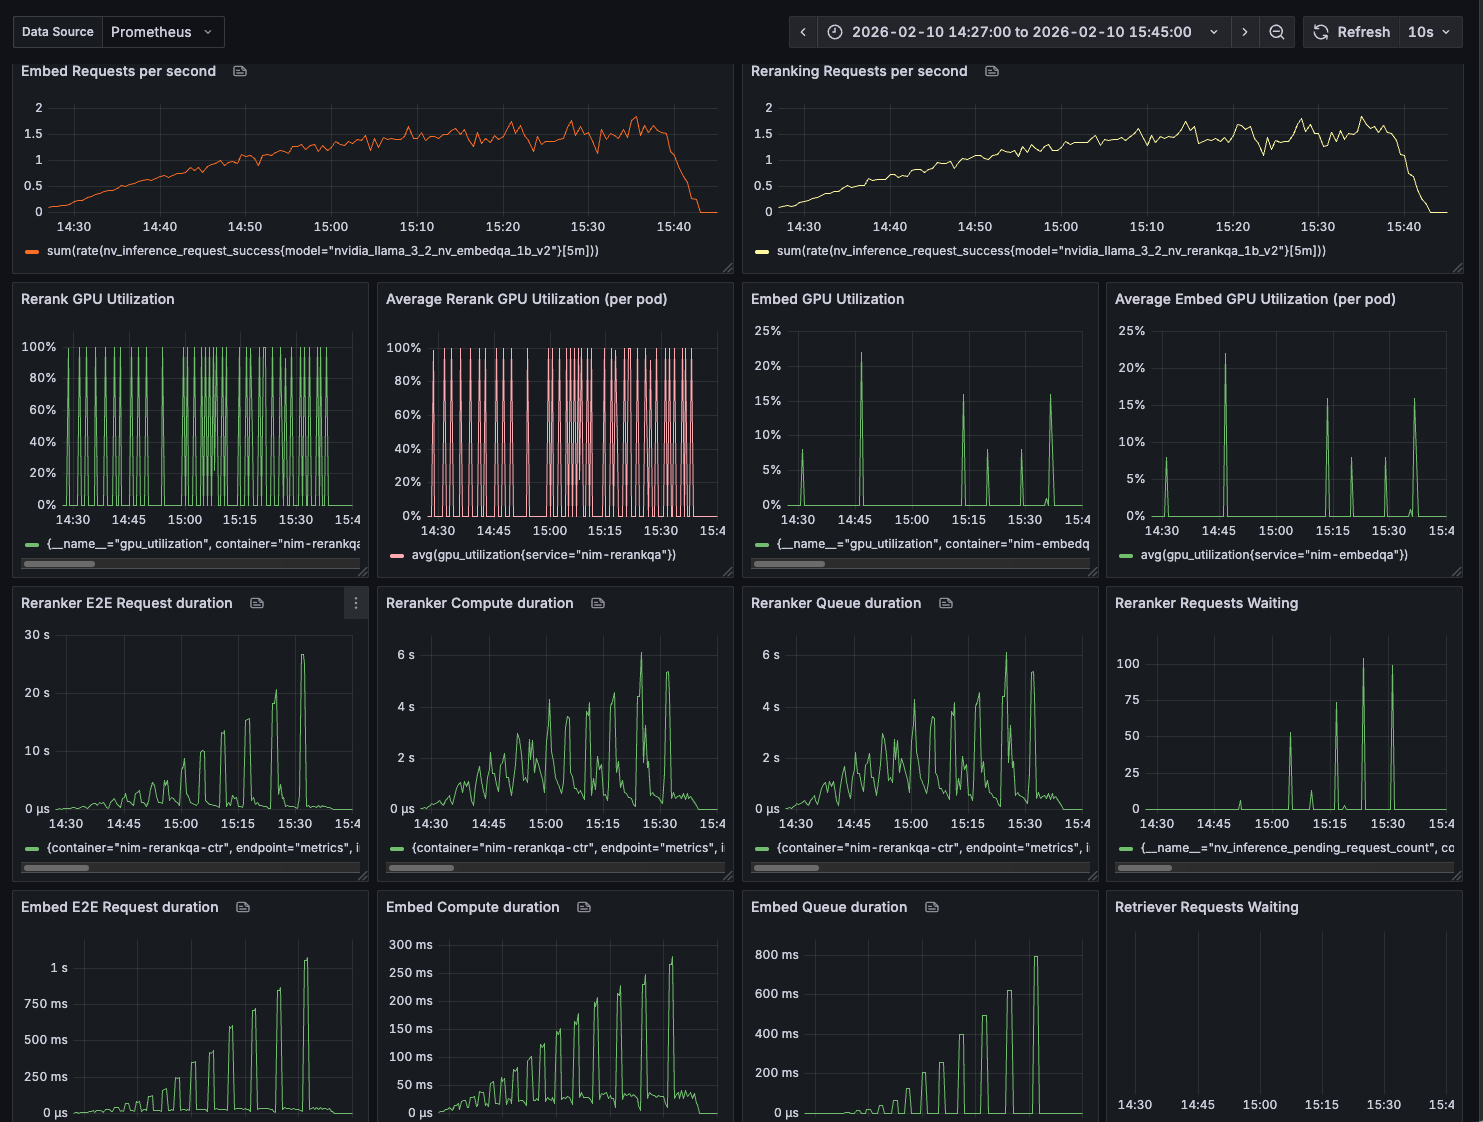
Figure 25 Reranking and Embedding NIM Dashboard - RAG Chat(128/128) Scale 2X#
Below is a snapshot of the LLM dashboard when benchmarking RAG Chat(128/128) at Scale 96X, LLM 96X, Reranker 12X, Embed 2X, RAG server 12X.
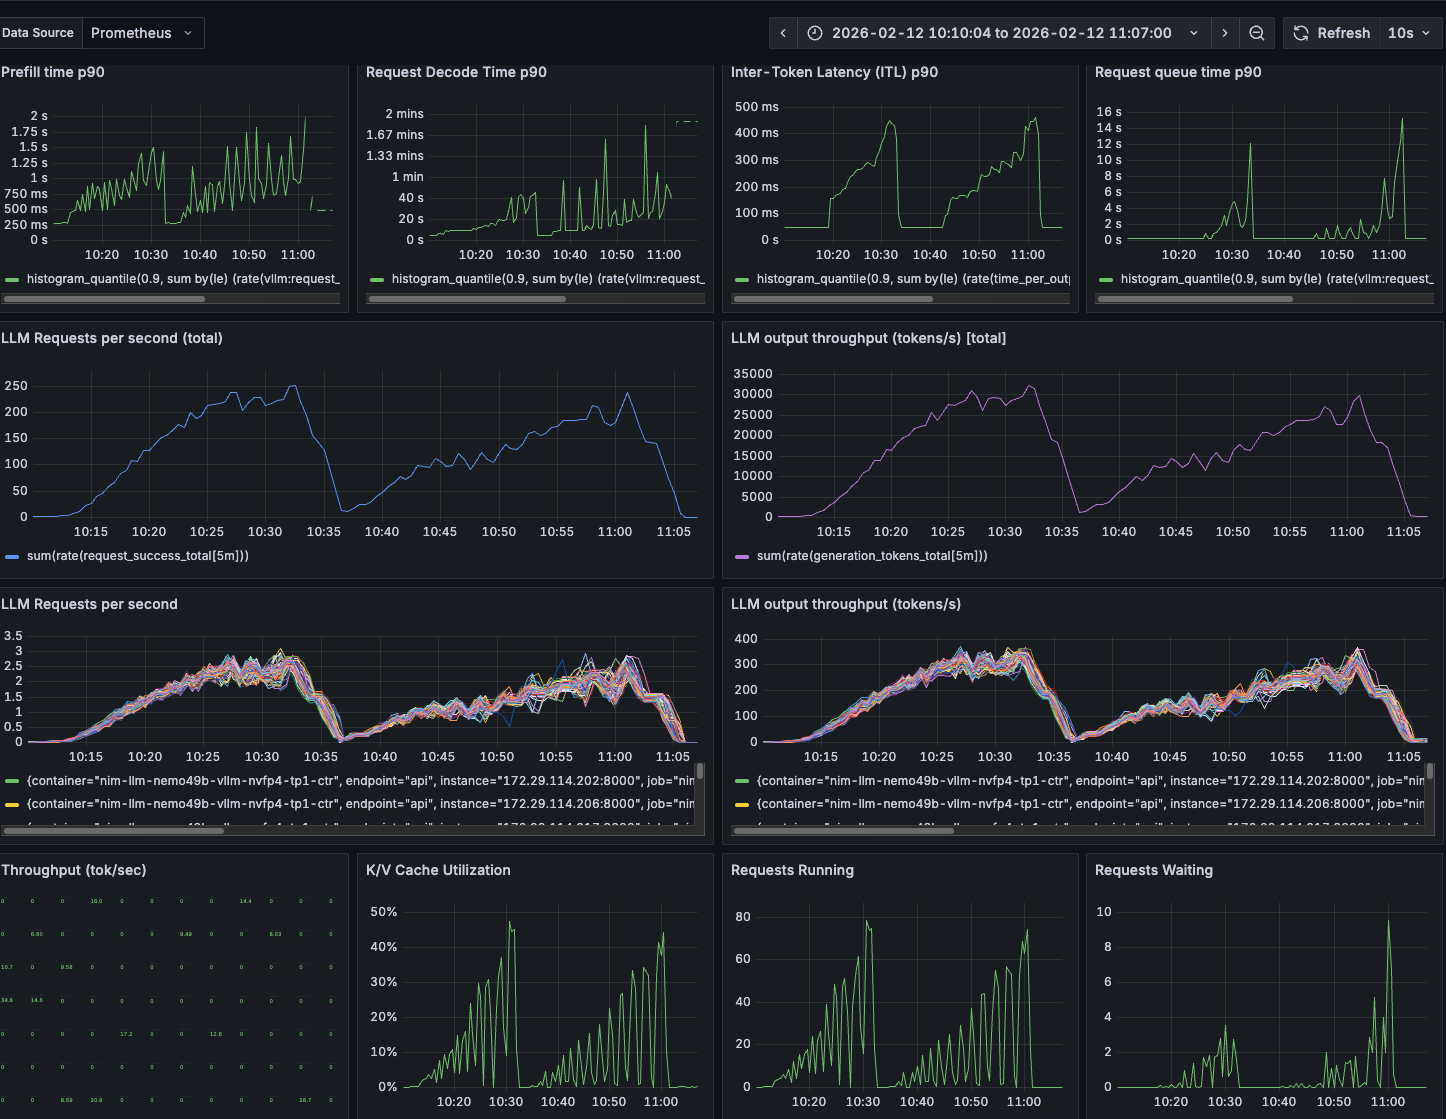
Figure 26 LLM Dashboard - RAG Chat(128/128) Scale 96X#
RAG Chat Balanced Performance Scale 1X - 96X#
Balanced Performance is measured by plotting Output Throughput (TPS) against user responsiveness, Per User Throughput (TPS), while scaling RAG Scale 1X to 96X.
Balanced Performance (maximize Output throughput X Per User throughput) is observed at the knee with Balanced Performance at Concurrent Requests CR =~32. For Chat(128/128), select the Balanced Performance concurrency range of 20-50 Peak users.
The first chart below shows Balanced performance for RAG Chat from Scale 1X to 20X on RTX PRO 6000. The second chart shows Balanced performance for RAG Chat from Scale 16X to 96X on RTX PRO 6000.
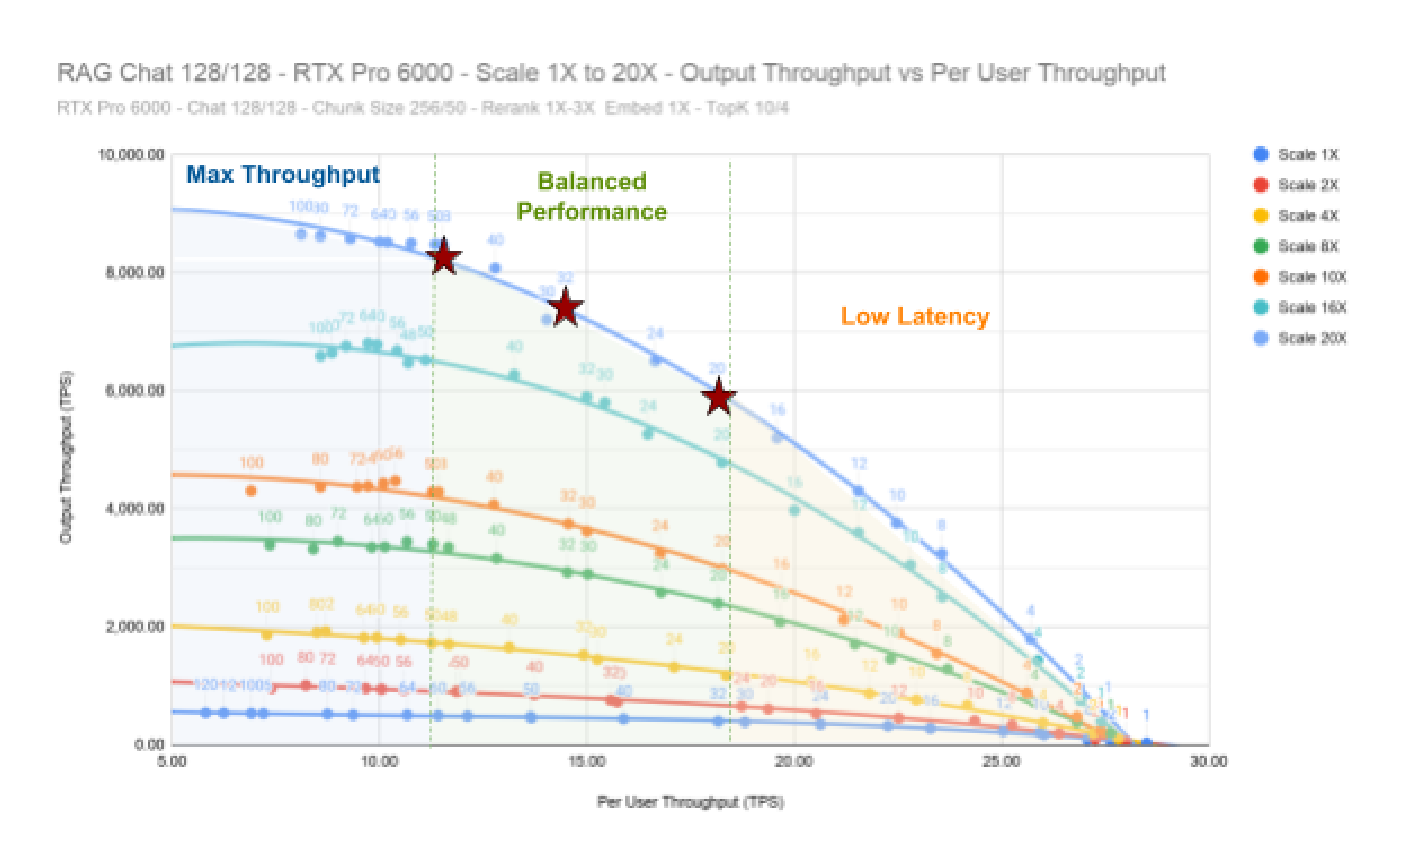
Figure 27 RAG Chat Balanced Performance Scale 1X to 20X on RTX PRO 6000#
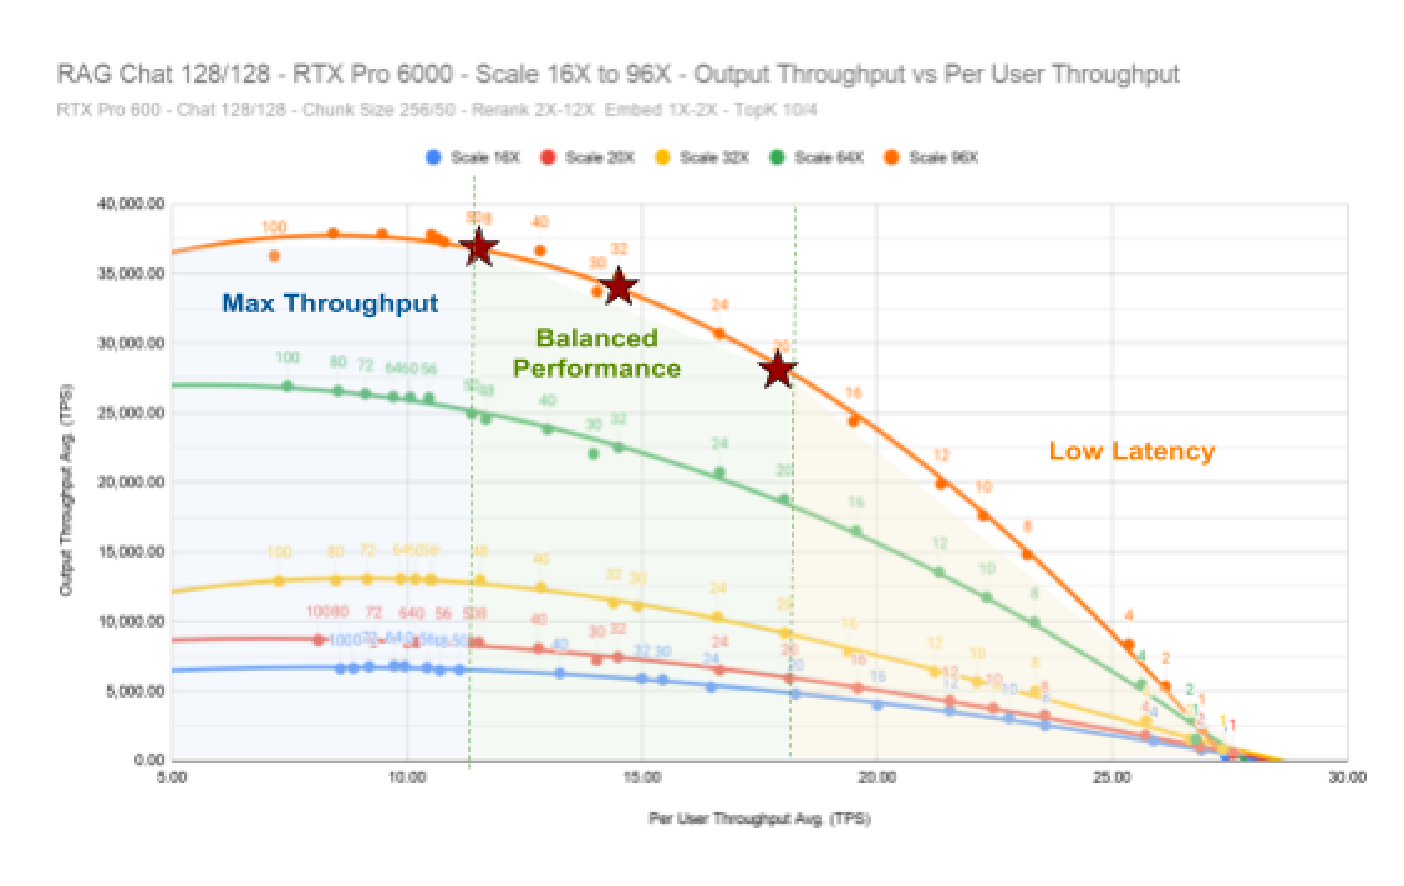
Figure 28 RAG Chat Balanced Performance Scale 16X to 96X on RTX PRO 6000#
The chart below shows Balanced performance for RAG Chat from Scale 1X to 20X on H200 NVL.
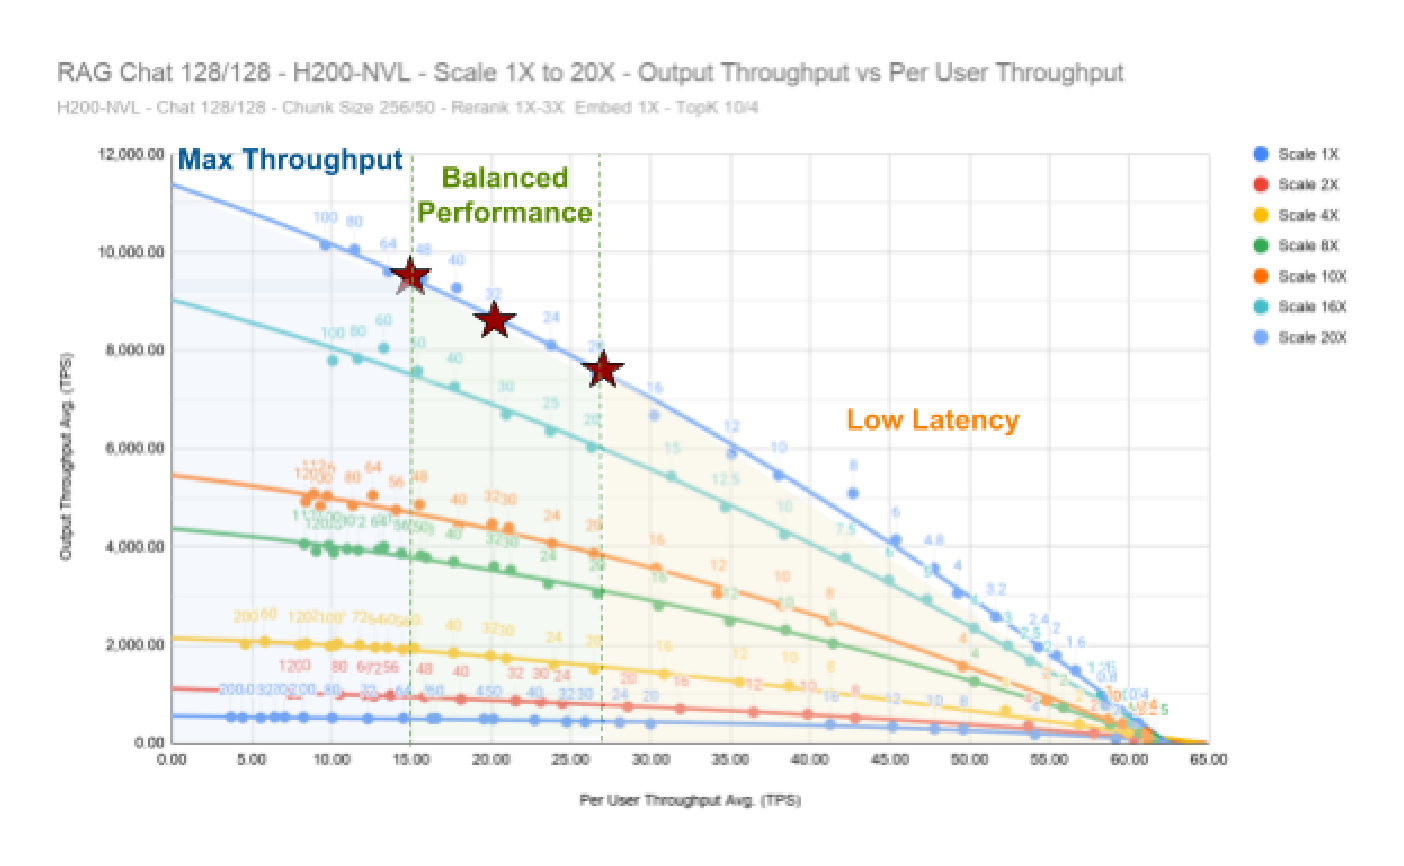
Figure 29 RAG Chat Balanced Performance Scale 1X to 20X on H200 NVL#
The chart below compares Balanced performance for RAG Chat from Scale 10X and 20X on RTX PRO 6000 vs H200 NVL. The chart shows a much steeper curve for RTX PRO 6000 compared to H200 NVL.
For the same concurrency the H200 NVL not only has better performance (output throughput TPS) but also better user experience (per user throughput TPS). For lower concurrency CR<=20 the per user throughput is 1.5 X to 2X better with H200 NVL, this implies lower per user latency and makes the H200 NVL a better option for latency sensitive Chat applications.
With Balanced Performance, Concurrency CR=30-50, the output throughput from RTX PRO 6000 (NVFP4) approaches H200NVL (FP8) and RTX PRO 6000 provides a more cost effective option for RAG Chat applications where low latency is not a hard requirement.
At higher concurrencies CR=80-120, in the Max Throughput range, H200NVL provides stable performance while RTX PRO 6000 shows instability (high latency) and performance starts to degrade at CR>80.
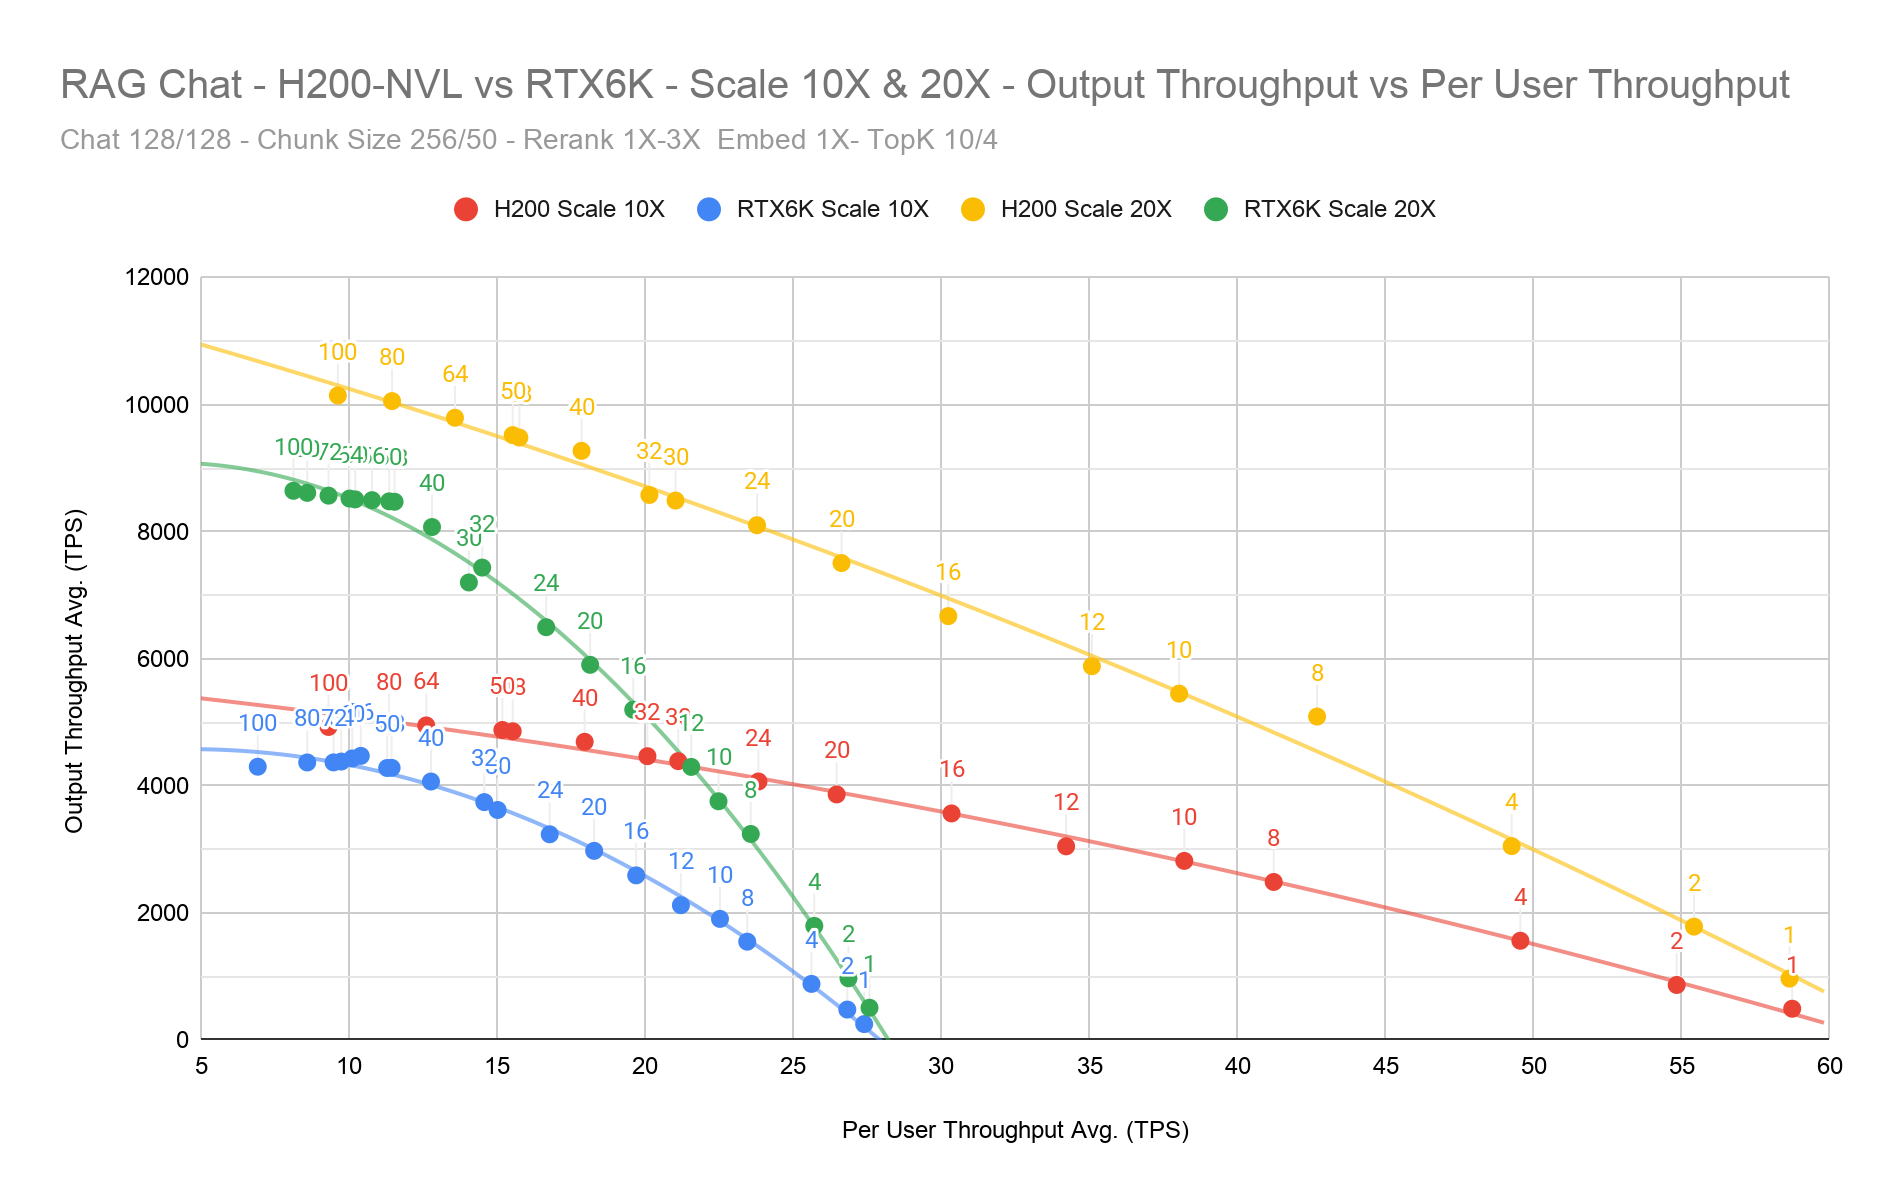
Figure 30 Balanced Performance Comparison: RTX PRO 6000 vs H200 NVL at Scale 10X and 20X#
RAG Chat Time to First Token Latency#
RAG Chat (128/128) - TTFT - RTX PRO 6000 - Scale 1X - 96X#
The chart below shows Time to First Token (TTFT) latency for RAG Chat from Scale 1X to 96X on RTX PRO 6000. The chart plots TTFT(ms) against Concurrency (CR) per LLM instance (replica), where:
For Low Latency Chat, TTFT <=3s and CR <=20, the TTFT is fairly stable for Scale 1X - 96X.
For Balanced Performance, TTFT <=6s and CR <=50, the TTFT starts to diverge especially for higher Scale 16X and beyond. This implies the Scaling Efficiency will not be as linear for higher Scale 16X and beyond.
For Max Throughput, TTFT <=10s, CR <=80, the TTFT starts to fan out and for CR>80 the fan out gets wider and more unpredictable (high latency spikes). This can result in throughput degradation or drop off for CR >80.
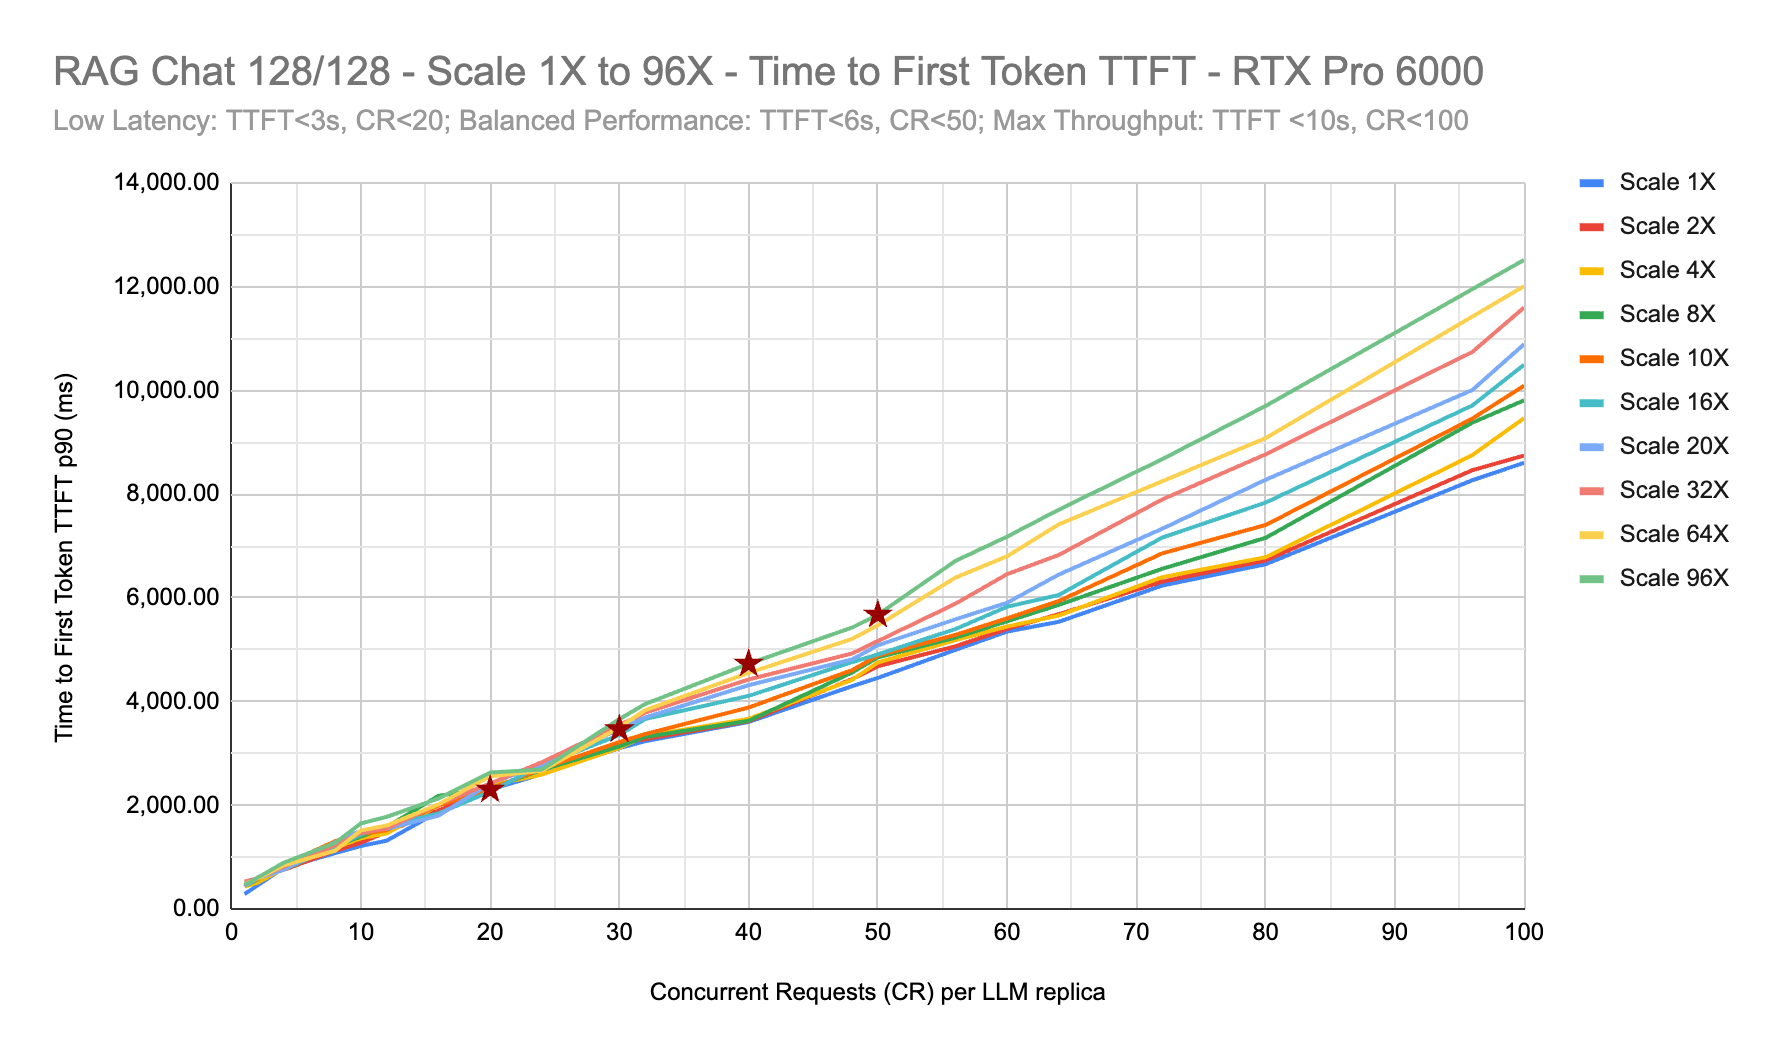
Figure 31 RAG Chat (128/128) - TTFT - RTX PRO 6000 - Scale 1X to 96X#
RAG Chat (128/128) - TTFT - H200 NVL - Scale 1X - 20X#
The chart below shows Time to First Token (TTFT) latency for RAG Chat from Scale 1X to 20X on H200 NVL. The chart below plots TTFT(ms) against Concurrency (CR) per LLM instance (replica).
H200 NVL shows more stable TTFT for Scale 1X to 20X, no significant divergence in TTFT for each Concurrency (CR) per LLM.
For Low Latency Chat, TTFT <3s, set concurrency CR <20 for stable TTFT and linear efficient scaling for Scale 1X to 20X.
At Balanced Performance, TTFT <6s and CR <50, the TTFT is stable with linear scaling for Scale 1X to 20X.
For Max Throughput, TTFT <10s, set concurrency CR <96 for stable TTFT and linear efficient scaling for Scale 1X to 20X.
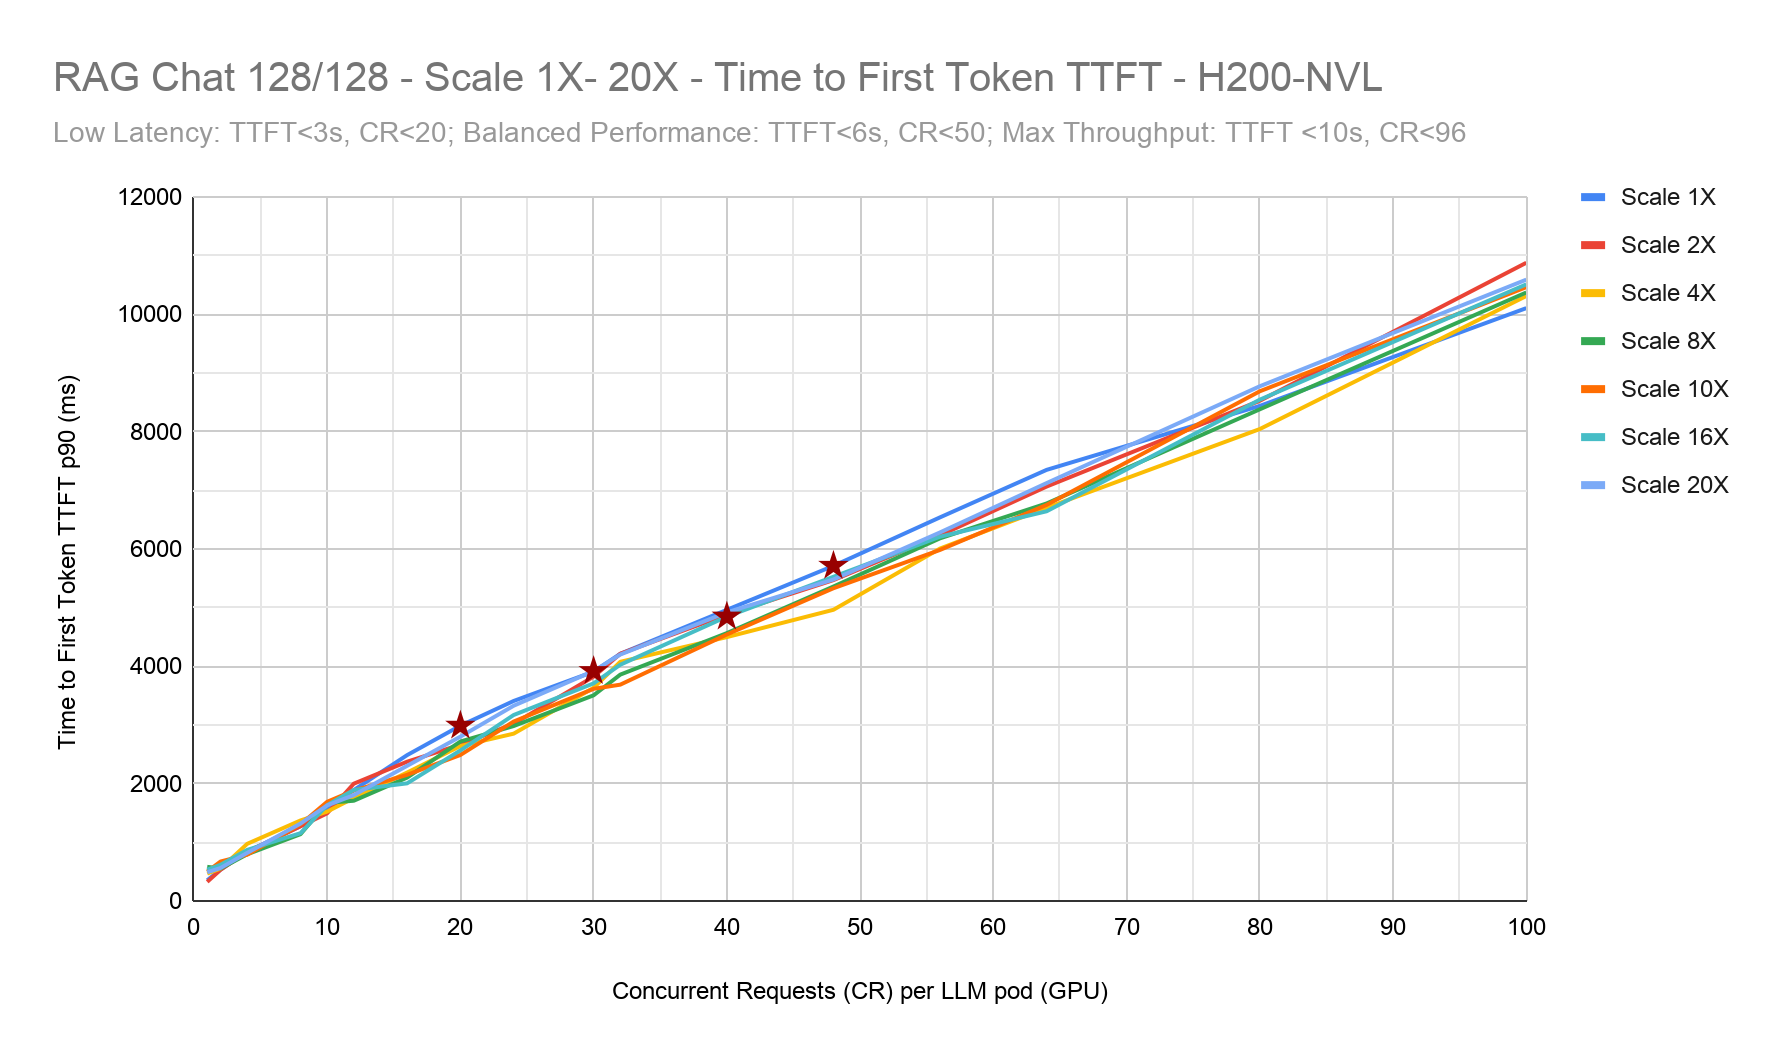
Figure 32 RAG Chat (128/128) - TTFT - H200 NVL - Scale 1X to 20X#
RAG Chat Latency Constraints#
Use the Balanced Performance and TTFT Latency charts above to help define the Latency constraints for RAG Chat (128/128) Retrieval use case examples listed below:
Customer Service Chat: Low Latency, TTFT p90 <3s
Bug query and triage Chat: Balanced Performance TTFT avg. <=6s
User email and document Chat: Max Throughput TTFT avg. <=10s
If strict Latency is not a hard requirement, then leveraging higher thresholds will yield higher concurrency and improved performance per $ (TCO).
Chat 128/128 Latency Constraint |
TTFT Threshold |
Concurrency per LLM (CR) |
|---|---|---|
RTX PRO 6000 |
||
Low Latency (TTFT p90) |
TTFT ≤ 3s |
CR ≤ 20 |
Balanced Performance |
TTFT ≤ 6s |
20 < CR ≤ 50 |
Max Throughput |
TTFT ≤ 10s |
50 < CR ≤ 80 |
H200 NVL |
||
Low Latency |
TTFT ≤ 3s |
CR ≤ 20 |
Balanced Performance |
TTFT ≤ 6s |
20 < CR ≤ 50 |
Max Throughput |
TTFT ≤ 10s |
50 < CR ≤ 100 |
RAG Chat Inter-Token Latency#
RAG Chat (128/128) - ITL - RTX PRO 6000 - Scale 1X - 96X#
The chart below shows Inter Token Latency (ITL) against Concurrency (CR) per LLM replica for RAG Chat from Scale 1X to 96X on RTX PRO 6000.
For RTX PRO 6000, at Concurrency CR>30, the ITL exceeds 100ms and starts diverging and spreading with Scale 10X and beyond. This will result in higher E2E latency with Scale 10X and beyond.
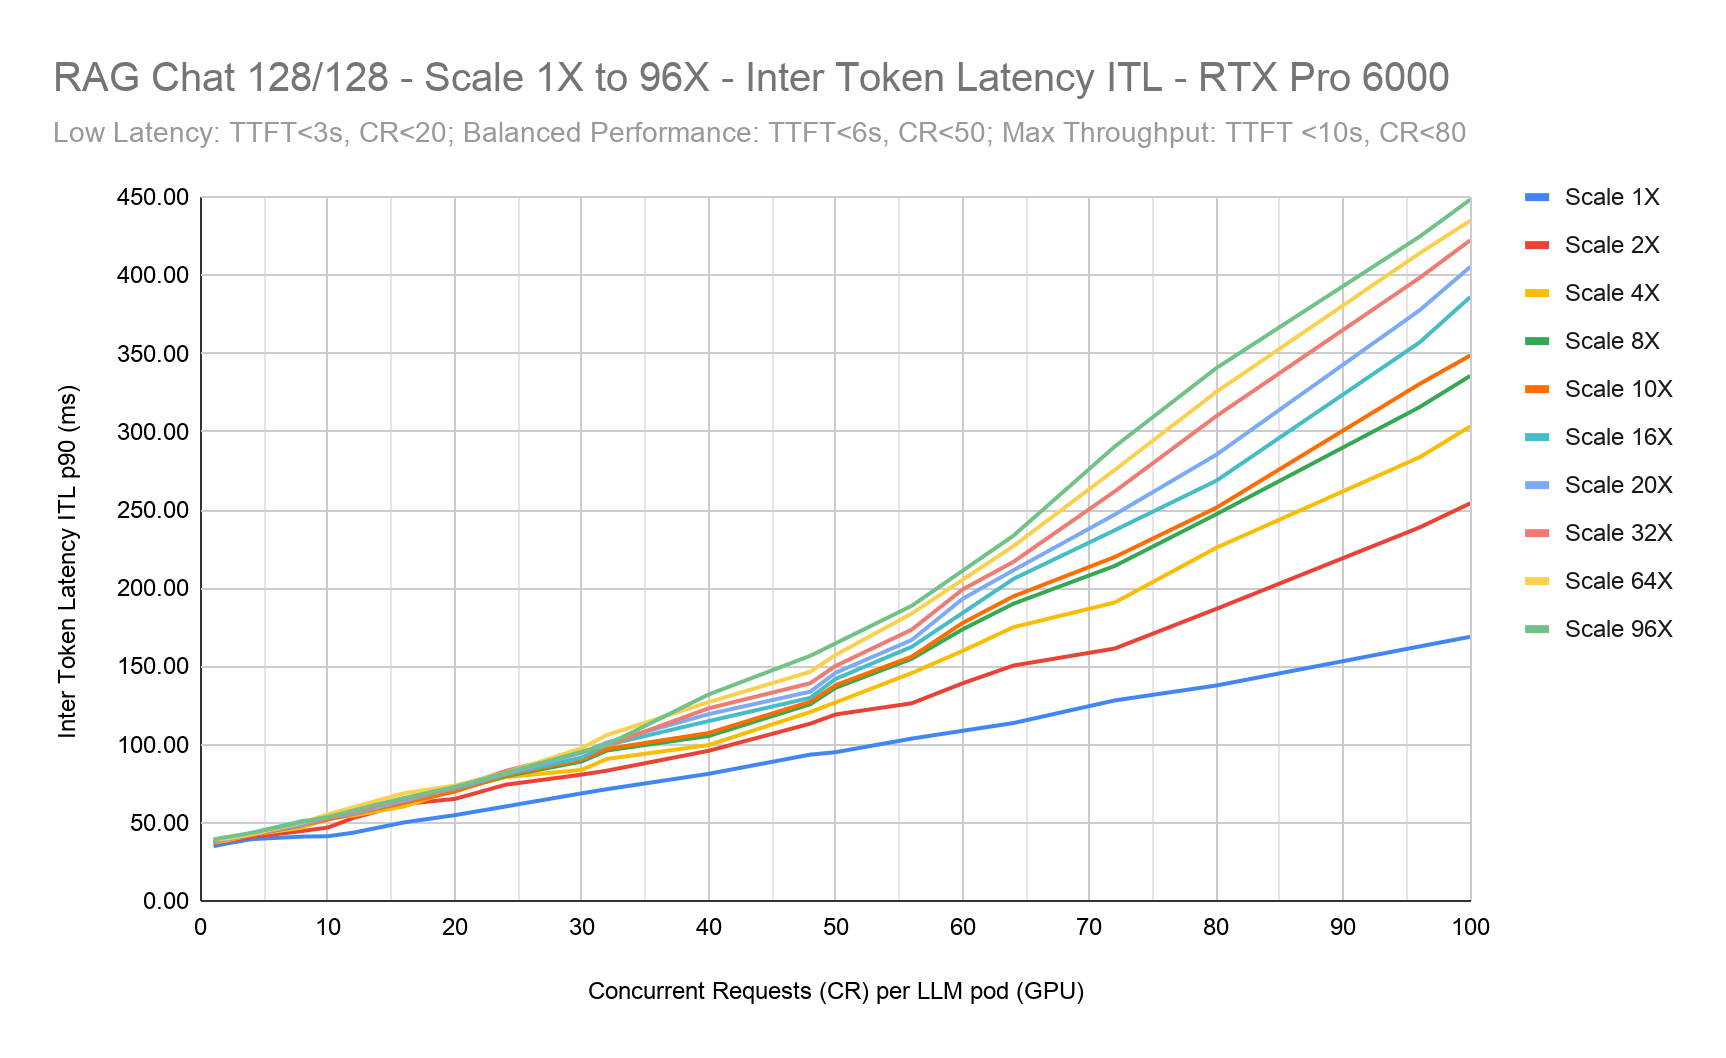
Figure 33 RAG Chat (128/128) - ITL - RTX PRO 6000 - Scale 1X to 96X#
RAG Chat (128/128) - ITL - H200 NVL - Scale 1X - 20X#
The chart below shows Inter Token Latency (ITL) against Concurrency (CR) per LLM replica for RAG Chat from Scale 1X to 20X on H200 NVL.
H200 NVL shows more stable ITL for Scale 1X to 20X, no significant divergence in ITL for Concurrency CR= 72. ITL starts to diverge with CR>72 for Scale 10X and beyond. The ITL exceeds 100ms for CR >35.
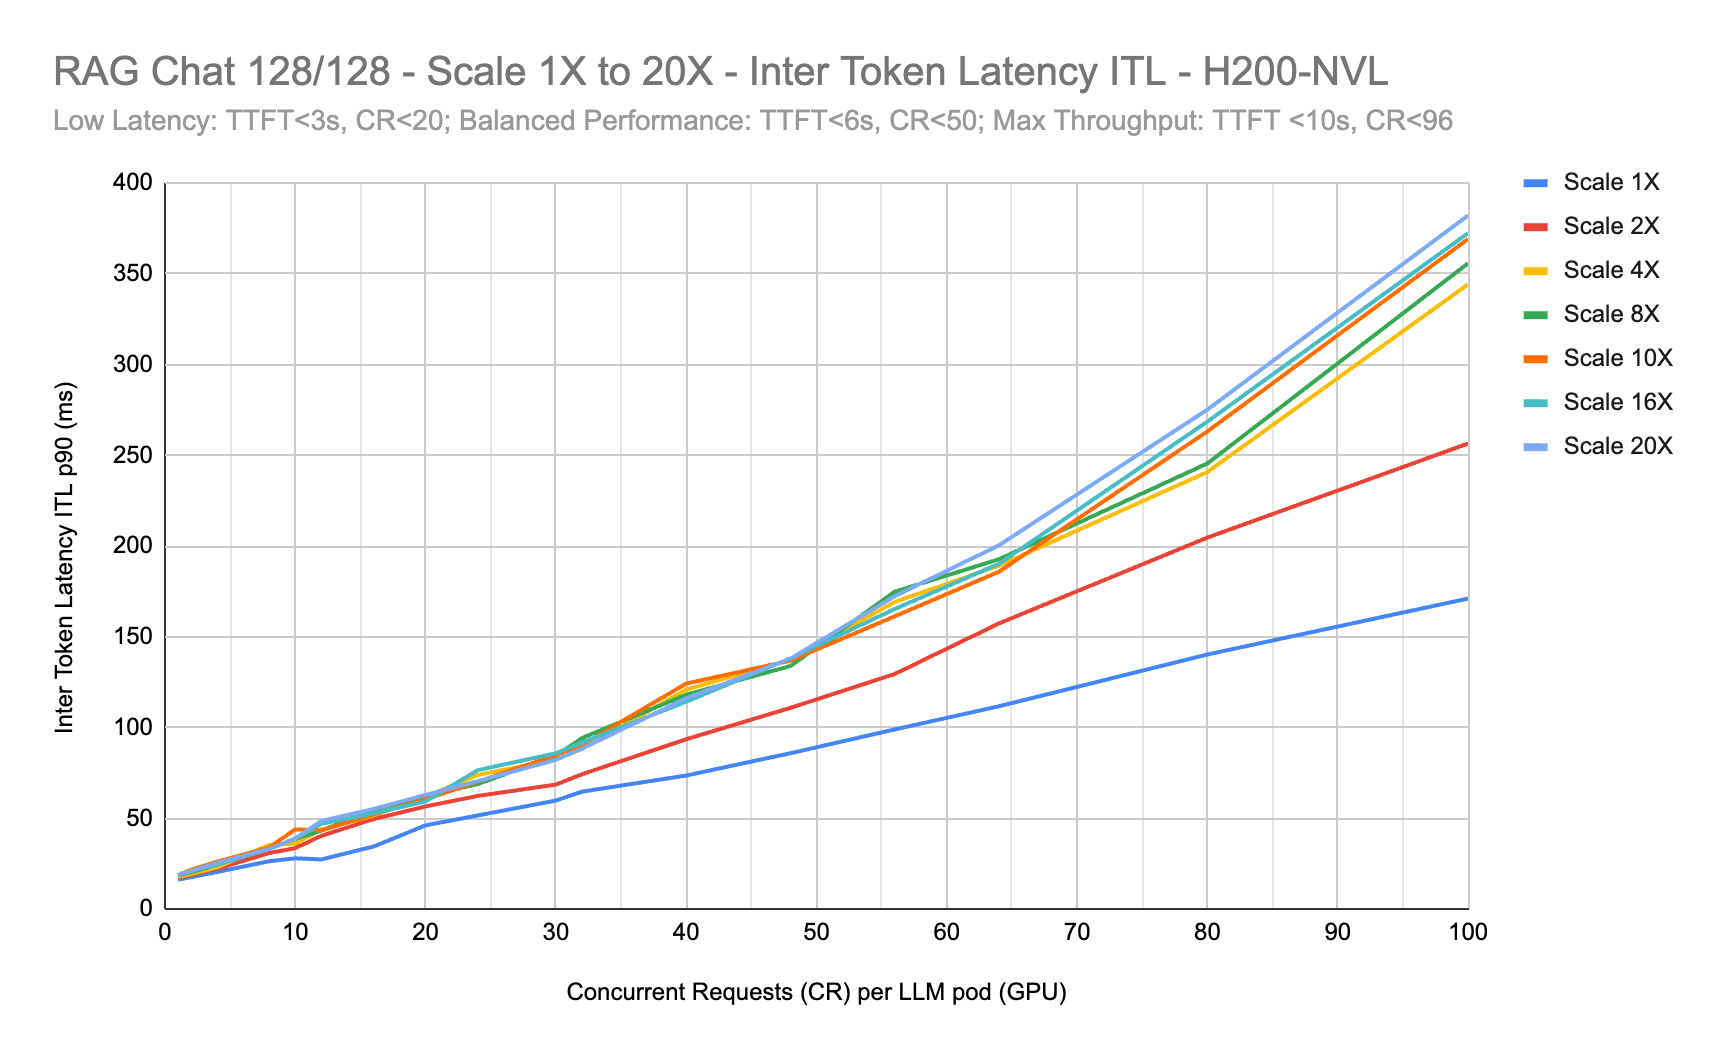
Figure 34 RAG Chat (128/128) - ITL - H200 NVL - Scale 1X to 20X#
RAG Chat E2E Request Latency#
RAG Chat (128/128) - E2E Request Latency - RTX PRO 6000 - Scale 1X - 96X#
The chart below shows E2E Request Latency against Concurrency (CR) per LLM replica for RAG Chat from Scale 1X to 96X on RTX PRO 6000.
For RTX PRO 6000, at Concurrency CR>50, the E2E latency starts diverging and spreading with Scale 10X and beyond.
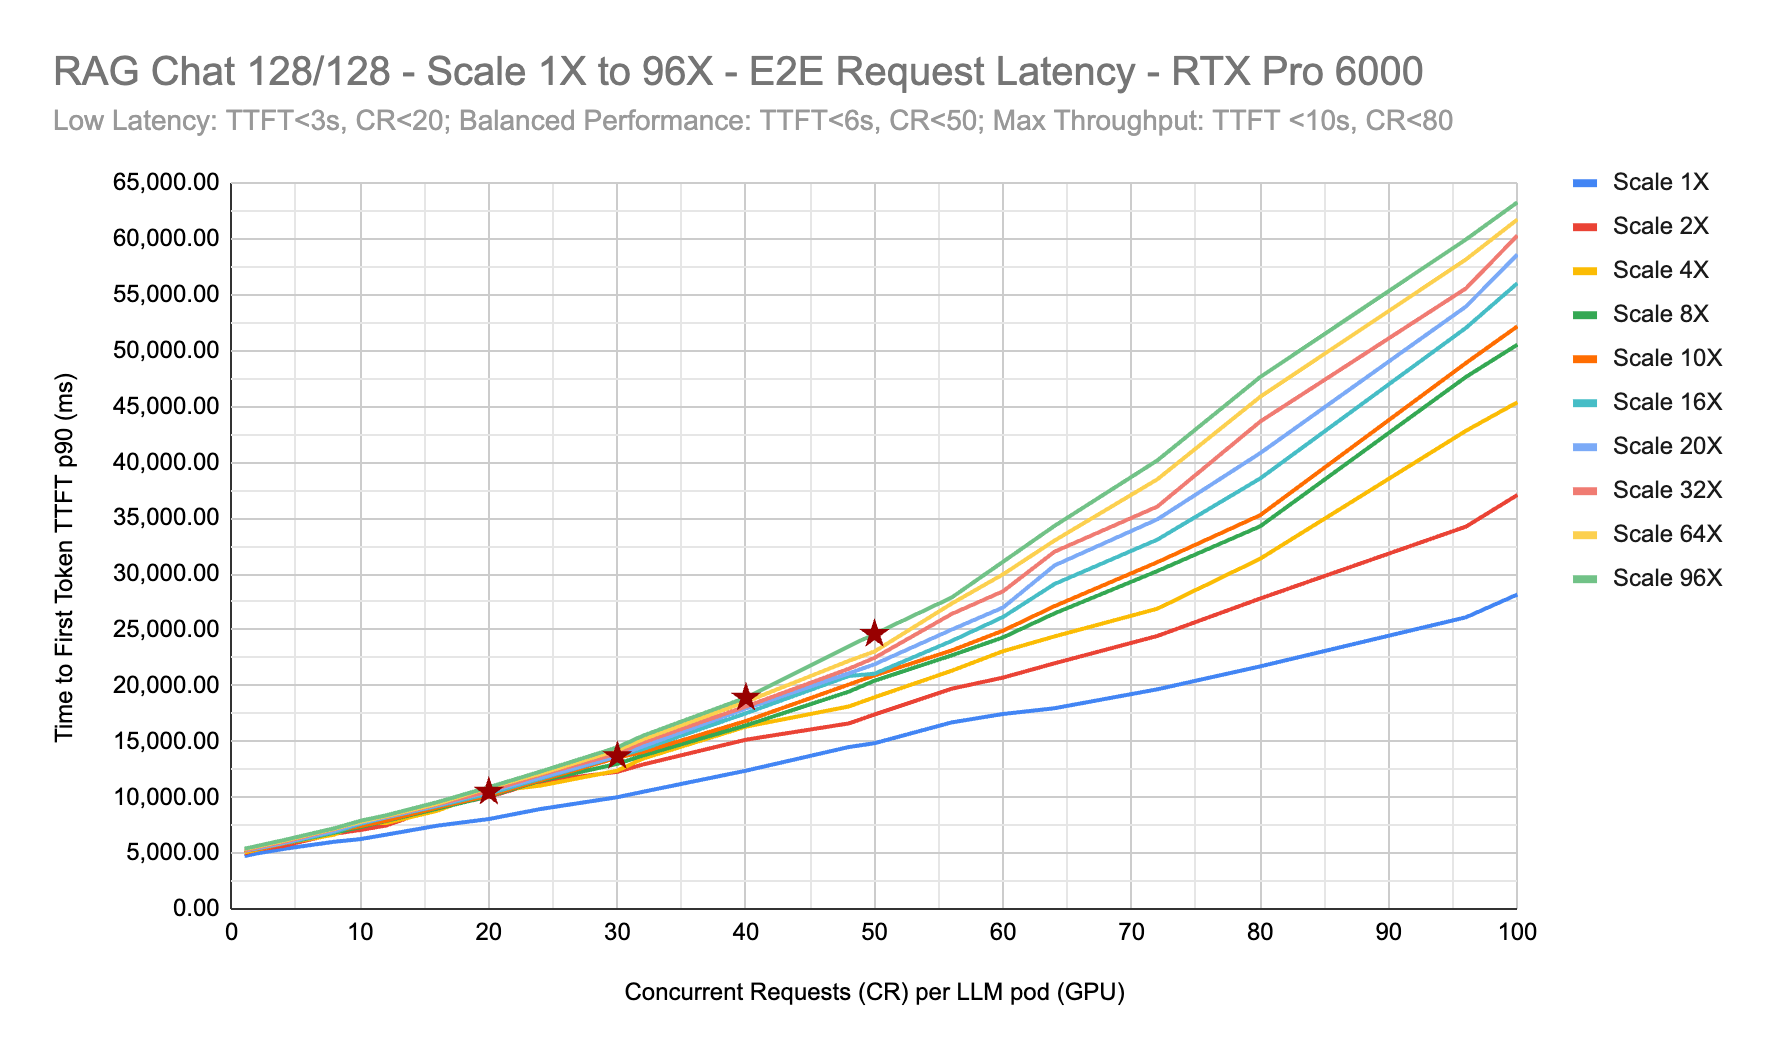
Figure 35 RAG Chat (128/128) - E2E Request Latency - RTX PRO 6000 - Scale 1X to 96X#
RAG Chat (128/128) - E2E Request Latency - H200 NVL - Scale 1X - 20X#
The chart below shows E2E Request Latency against Concurrency (CR) per LLM replica for RAG Chat from Scale 1X to 20X on H200 NVL.
H200 NVL shows more stable E2E Latency for Scale 1X to 20X, till Concurrency CR=60. E2E latency starts to diverge with CR>60 for Scale 10X and beyond.
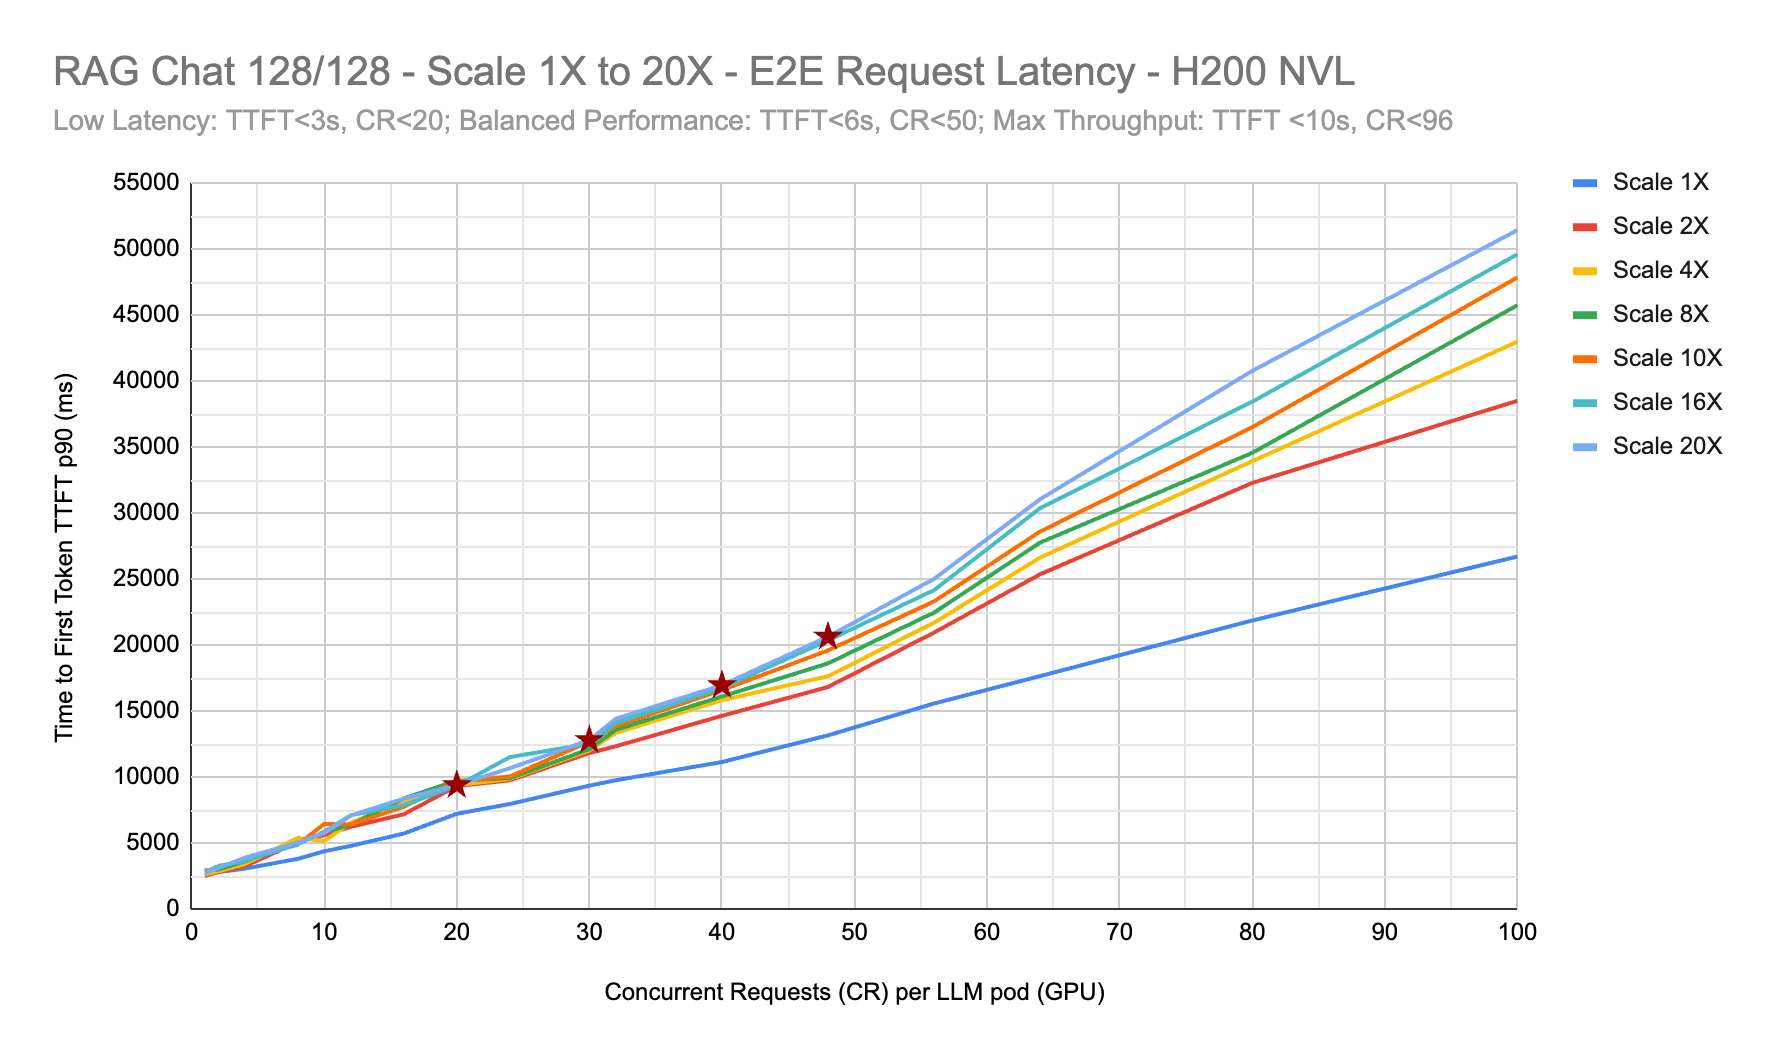
Figure 36 RAG Chat (128/128) - E2E Request Latency - H200 NVL - Scale 1X to 20X#
RAG E2E Latency Degradation with Scale#
RAG E2E Request Latency degradation is observed at higher Scale 16X and beyond since the TTFT and ITL fan out and diverge from RAG Baseline Scale 1X. Scaling out adds overhead from Kubernetes load balancing which can result in uneven distribution of requests across LLM replicas. Some replicas get 50% more of expected load and if there is no memory capacity this results in queuing and long tails. Kubernetes L4 load balancing uses basic hashing (kubeproxy ipvs) to spread load across replicas. It does not load balance based on LLM load. Smart inference routing based on KV-Cache load on each LLM is needed to ensure more even spread of RAG requests between replicas.
Latency degradation at Scale 16X and higher is more pronounced in RTX PRO 6000 GPUs due to limited memory available compared to H200 NVL. This results in unpredictable latency spikes and reduces linear scaling efficiency by 10-15%.
With Kubernetes L4 hashing, the request load evens out (on average) with equal number of requests per LLM instance but the intermediate request spikes can cause temporary bottlenecks with queueing and higher latencies, ITL, TTFT and increased Prefill and Decode time. This especially affects RTX PRO 6000 when scaling out LLM since there is limited memory on the GPU (compared to H200 NVL).
The chart below for RAG Chat benchmarking on RTX PRO 6000 compares LLM Requests Running and Requests waiting in queue for Scale 1X vs Scale 2X for different concurrencies.
For Scale 2X there is an uneven distribution of RAG requests across LLM replicas, for example when CR= 240 Requests, LLM1(yellow) has ~150 requests running while LLM2(green) has only ~50.
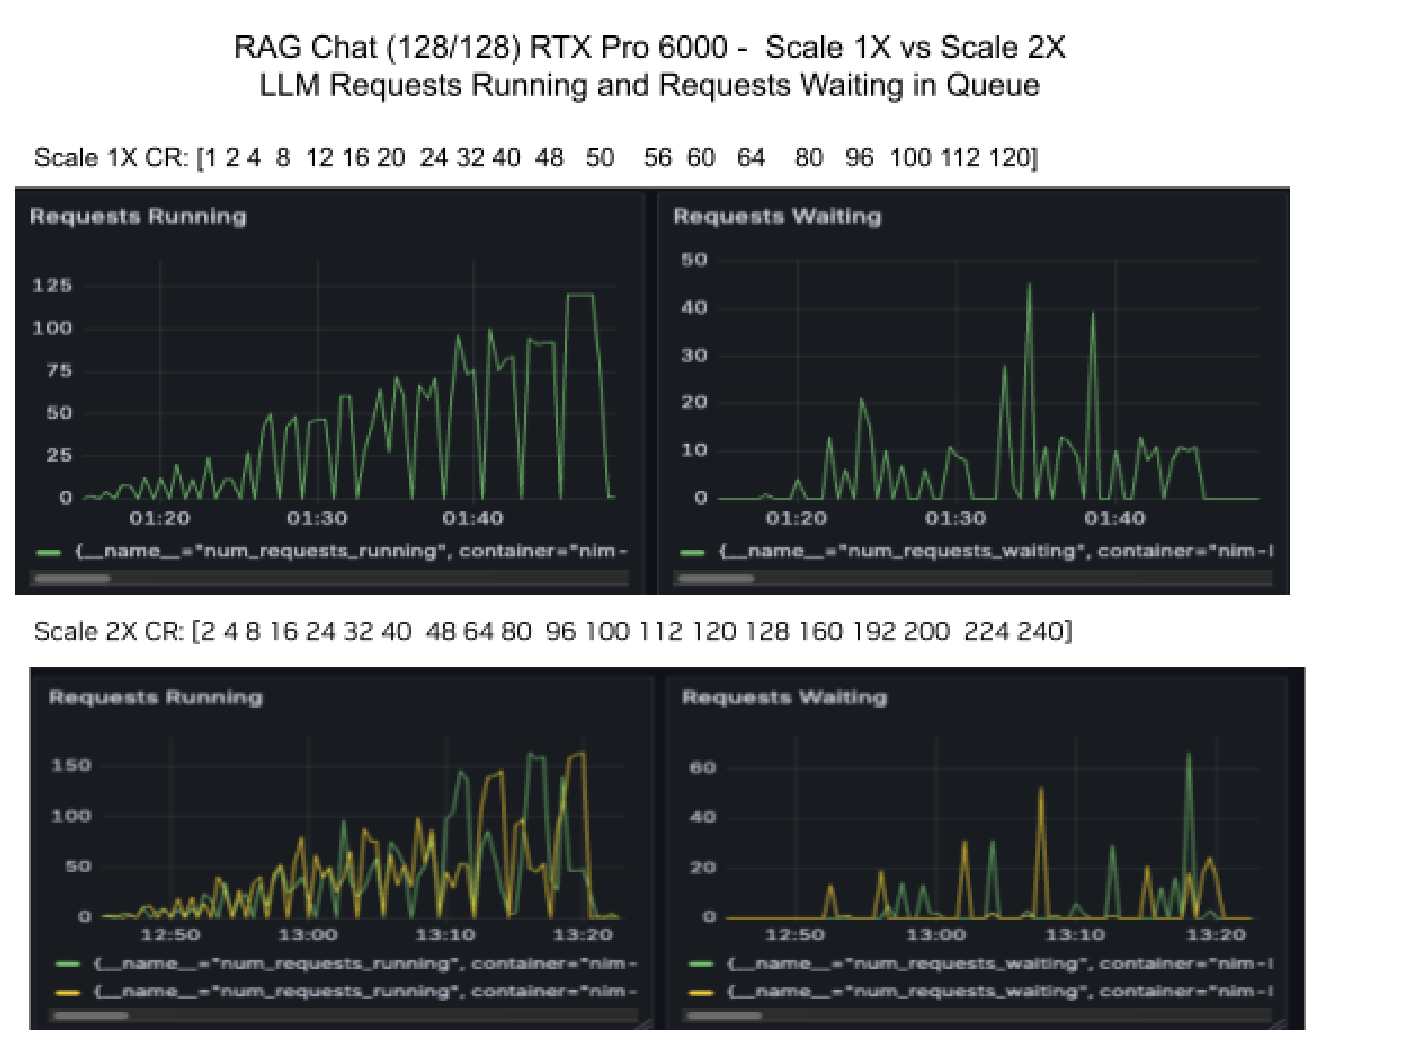
Figure 37 RAG Chat - LLM Requests Running and Waiting in Queue - Scale 1X vs Scale 2X on RTX PRO 6000#
RAG Chat TCO and Scaling Efficiency#
RAG Chat (128/128) - TCO - RTX PRO 6000 - Scale 1X - 96X#
For the RAG Chat (128/128) on RTX PRO 6000 the table below shows maximum throughput for Latency Thresholds selected for the Chat use case. For these Latency thresholds calculate the Scaling Efficiency and TCO cost per Million tokens.
Latency threshold |
Throughput (TPS) or (RPS) |
Scaling Efficiency (%) |
TCO Cost per Million tokens |
|
|---|---|---|---|---|
RTX PRO 6K Scale 1X (GPUs: 2.75) |
||||
Low Latency TTFT <= 3s, Concurrency <=20 (per LLM) |
TTFT ≤ 3s |
321 TPS, 2.59 RPS |
NA |
$2.59 |
Balanced Perf. TTFT <= 6s, CR <=50 |
TTFT ≤ 6s |
472 TPS, 4.17 RPS |
NA |
$1.76 |
Max Throughput TTFT <= 10s, CR <= 80 |
TTFT ≤ 10s |
519 TPS, 5.10 RPS |
NA |
$1.60 |
RTX PRO 6K Scale 10X (GPUs: 12.75) |
||||
Low Latency TTFT <= 3s, CR <=20 |
TTFT ≤ 3s |
2,974 TPS, 23.24 RPS |
92.54% |
$1.30 |
Balanced Perf. TTFT < 6s, CR <=50 |
TTFT < 6s |
4,278 TPS, 33.42 RPS |
90.58% |
$0.90 |
Max Throughput TTFT <= 10s, CR <= 80 |
TTFT ≤ 10s |
4,365 TPS, 34.11 RPS |
84% |
$0.88 |
RTX PRO 6K Scale 20X (GPUs: 23.75) |
||||
Low Latency TTFT < 3s, CR <=20 |
TTFT < 3s |
5,903 TPS, 46.12 RPS |
91.83% |
$1.22 |
Balanced Perf. TTFT <= 6s, CR <=50 |
TTFT ≤ 6s |
8,476 TPS, 66.22 RPS |
90.58% |
$0.85 |
Max Throughput TTFT <= 10s, CR <= 80 |
TTFT ≤ 10s |
8,610 TPS, 67.26 RPS |
82.82% |
$0.86 |
The chart below shows RAG Chat Output throughput as Requests per second (RPS) scaling linearly with RAG Scale from 1X(2.75 GPUs) to 96X (109.25 GPUs) on RTX PRO 6000. The graphs are plotted for 2 Latency constraints: Low Latency (TTFT <3s, CR=20) and Balanced Performance (TTFT <6s, CR=50).
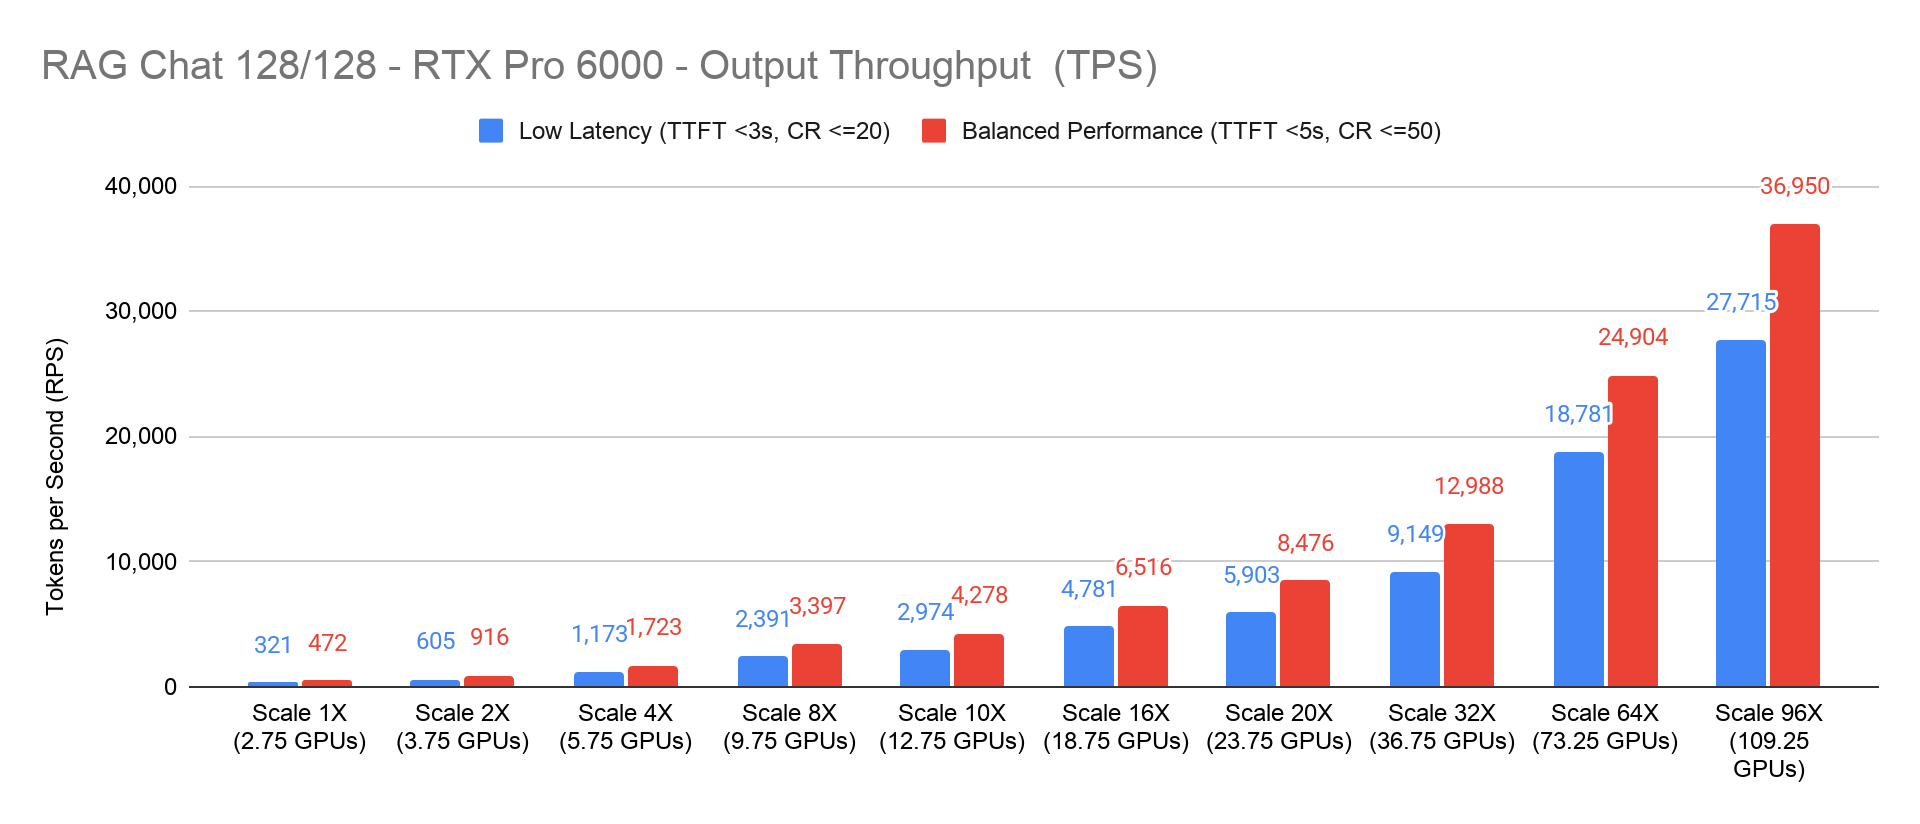
Figure 38 RAG Chat Output Throughput (RPS) - Linear Scaling 1X to 96X on RTX PRO 6000#
The chart below shows RAG TCO as Cost per Million Tokens with RAG Scale from 1X(2.75 GPUs) to 96X (109.25 GPUs) on RTX PRO 6000. The graphs are plotted for 2 Latency constraints: Low Latency (TTFT <3s, CR=20) and Balanced Performance (TTFT <6s, CR=50). The TCO drops significantly from Scale 1X to Scale 16X after which it remains fairly constant.
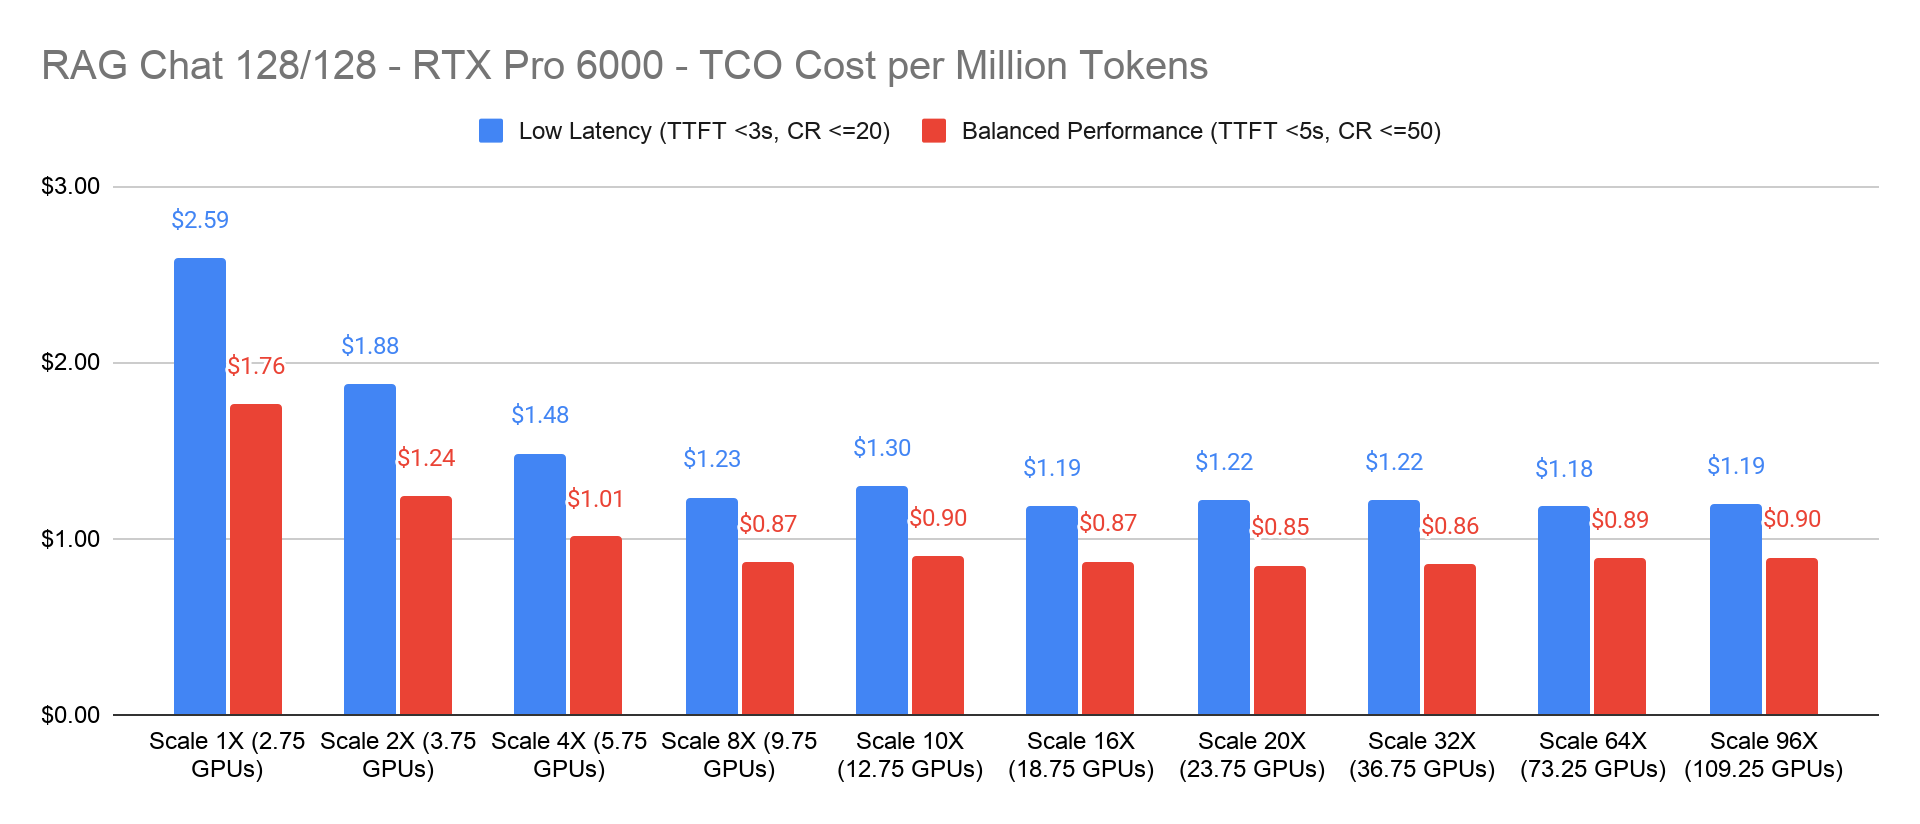
Figure 39 RAG Chat TCO (Cost per Million Tokens) - Scale 1X to 96X on RTX PRO 6000#
RAG Chat (128/128) - TCO - H200 NVL - Scale 1X - 20X#
RAG scaling for Chat 128/128 with Low Latency and Balanced Performance:
RAG Scale |
GPUs |
Latency SLA |
TTFT Threshold |
Max. Concurrent Requests CR |
Max Throughput (TPS) |
Max Requests (RPS) |
Efficiency |
|---|---|---|---|---|---|---|---|
1X |
2.75 |
Low Latency |
< 3s |
≤ 25 |
386.30 |
3.02 |
NA |
1X |
2.75 |
Balanced Performance |
3s - 5s |
25 < CR ≤ 50 |
533.34 |
4.17 |
NA |
8X |
9.75 |
Low Latency |
< 3s |
≤ 200 |
3,290.85 |
25.71 |
106.49% |
8X |
9.75 |
Balanced Performance |
3s - 5s |
240 < CR ≤ 400 |
4,287.30 |
33.49 |
100.48% |
16X |
18.75 |
Low Latency |
< 3s |
≤ 400 |
6,510.71 |
50.86 |
105.34% |
16X |
18.75 |
Balanced Performance |
3s - 5s |
480 < CR ≤ 800 |
8,593.48 |
67.14 |
100.70% |
20X |
23.75 |
Low Latency |
< 3s |
≤ 1000 |
15,675.72 |
122.47 |
101.45% |
20X |
23.75 |
Balanced Performance |
3s - 5s |
1200 < CR ≤ 2000 |
21,833.70 |
170.58 |
102.34% |
The chart below shows RAG Chat Output throughput as Requests per second (RPS) scaling linearly with RAG Scale from 1X(2.75 GPUs) to 20X (23.75 GPUs) on H200 NVL. The graphs are plotted for 2 Latency constraints: Low Latency (TTFT <=3s, CR=20) and Balanced Performance (TTFT <=6s, CR=50).
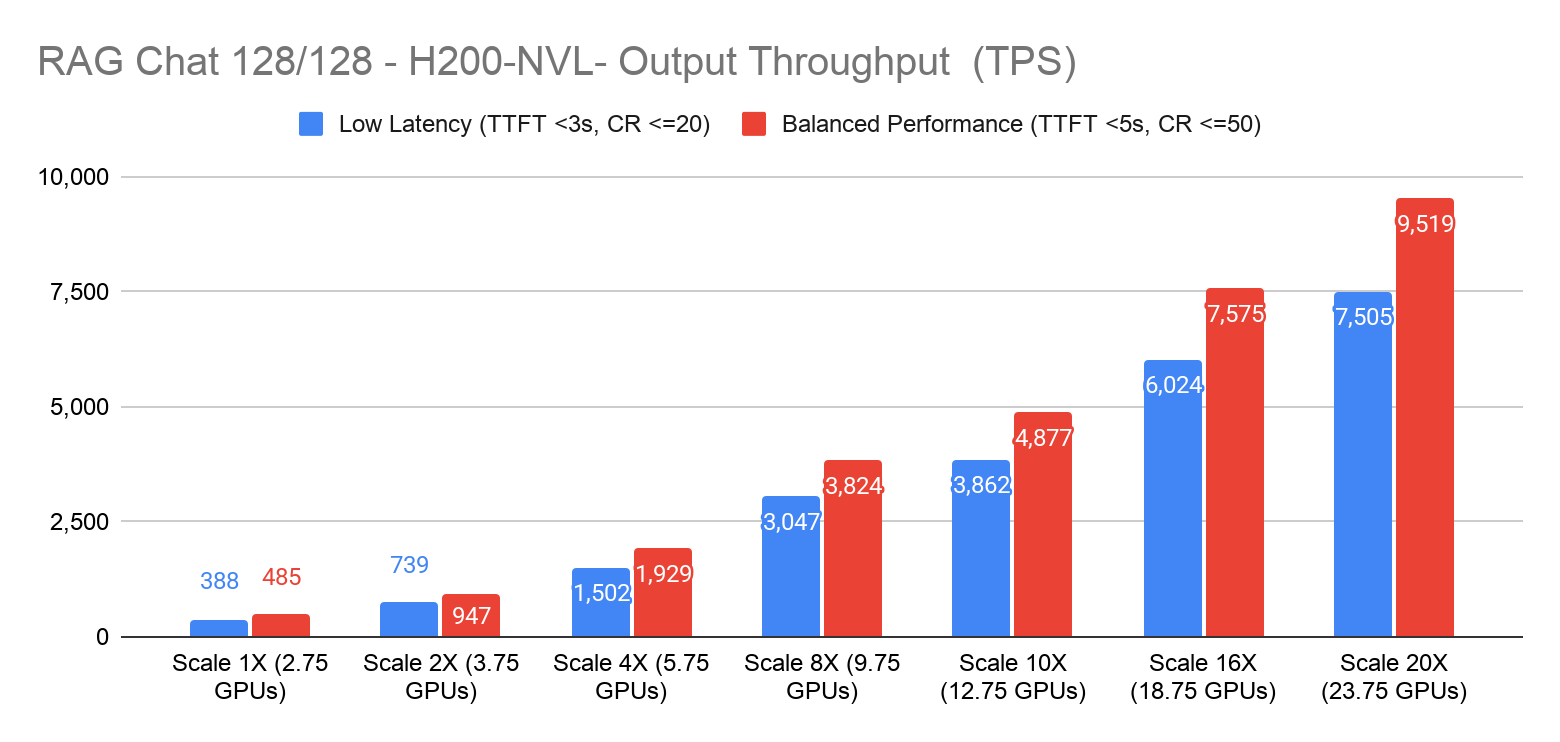
Figure 40 RAG Chat Output Throughput (RPS) - Linear Scaling 1X to 20X on H200 NVL#
RAG Summarization (1024/512) Performance#
RAG Summarization - TCO - H200 NVL - Scale 1X - 20X#
RAG scaling for Summarization 1024/512 with Low Latency and Balanced Performance:
RAG Scale |
GPUs |
Latency Bucket |
TTFT Threshold |
Concurrent Requests CR |
Max Throughput (TPS) |
Max Requests (RPS) |
Efficiency |
|---|---|---|---|---|---|---|---|
1X |
2.75 |
Balanced Performance |
9s - 15s |
30 < CR ≤ 50 |
470.17 |
0.92 |
NA |
1X |
2.75 |
Max. Throughput |
< 200s |
CR ≤ 100 |
521.05 |
1.02 |
NA |
8X |
9.75 |
Balanced Performance |
10s - 20s |
240 < CR ≤ 400 |
3,566.97 |
6.97 |
94.30% |
8X |
9.75 |
Max. Throughput |
< 200s |
CR ≤ 800 |
3,855.63 |
7.53 |
92.5% |
16X |
18.75 |
Balanced Performance |
15s - 30s |
480 < CR ≤ 800 |
7,422.78 |
14.5 |
98.67% |
16X |
18.75 |
Max. Throughput |
< 200s |
CR ≤ 1,600 |
8,436.85 |
16.48 |
101.20% |
20X |
23.75 |
Balanced Performance |
35s - 60s |
1200 < CR ≤ 2,000 |
18,606.96 |
36.34 |
98.94% |
20X |
23.75 |
Max. Throughput |
< 200s |
CR ≤ 4,000 |
20,942.12 |
40.9 |
100.48% |
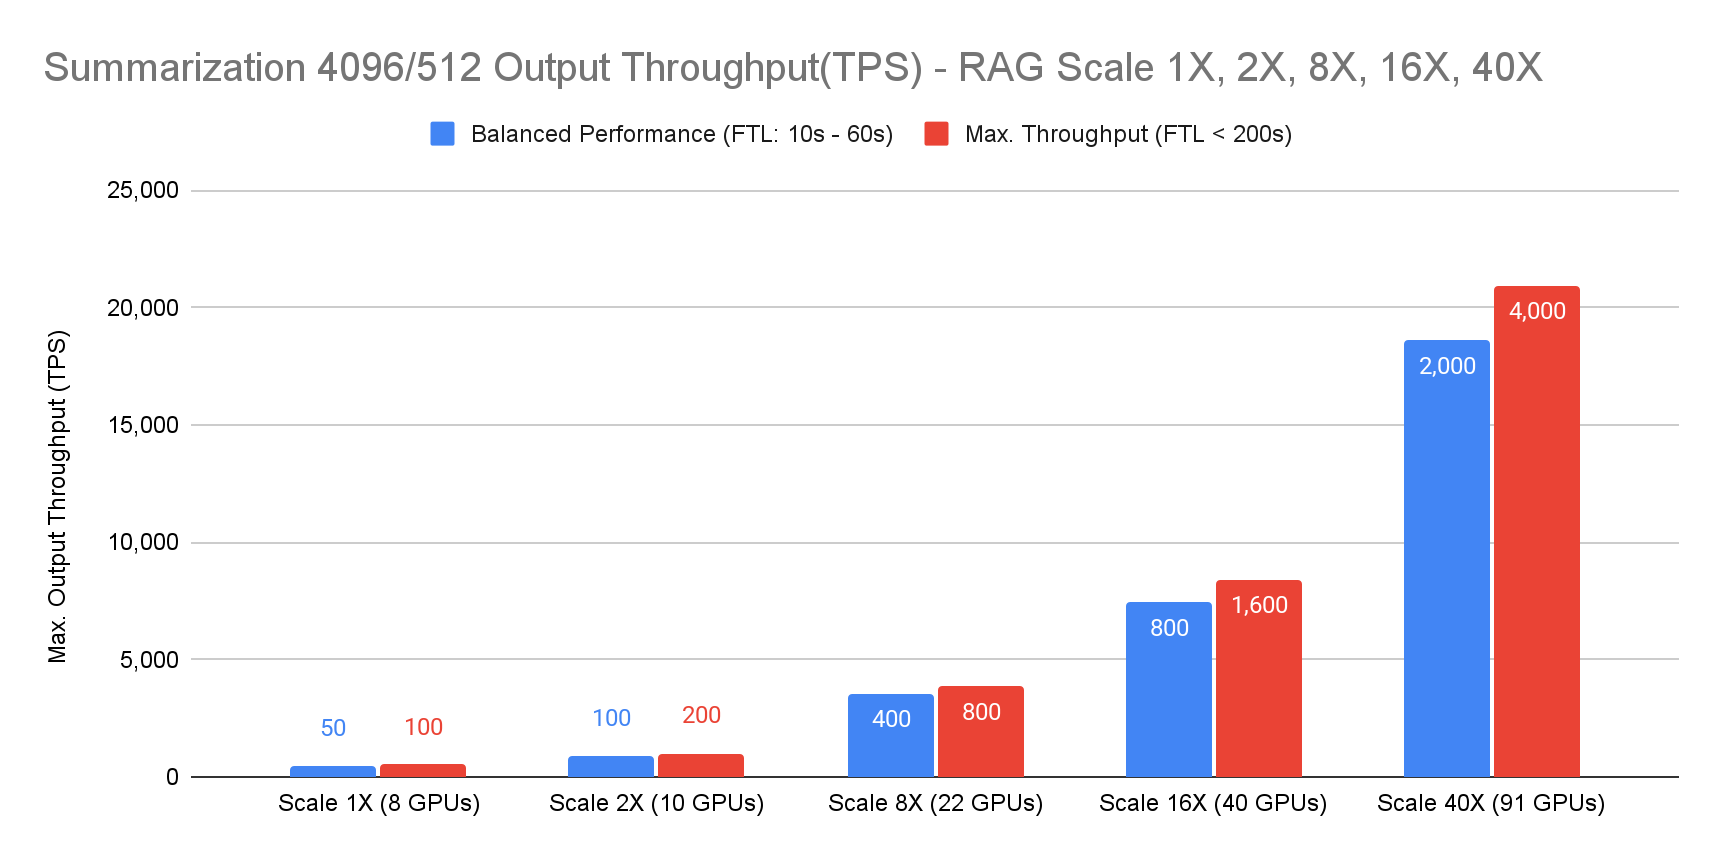
Figure 41 RAG Summarization (1024/512) Output Throughput - Linear Scaling 1X to 20X on H200 NVL#