

Summary - Enterprise RAG Retrieval#
Enterprise RAG retrieval is the runtime path that determines whether a RAG system can deliver accurate, grounded, and context-relevant responses at production scale. This guide covers how to size, tune, and scale the retrieval pipeline so enterprise deployments can support large numbers of concurrent users while meeting use-case-specific goals for accuracy, latency, throughput, and cost.
The retrieval pipeline includes the RAG server, embedding NIM, Milvus vector database, reranker, and LLM NIM. Each component must be scaled based on workload characteristics such as input/output sequence length, concurrent requests, TopK, chunk size, reranker usage, and target latency SLAs. Because retrieved context increases the input sequence length sent to the LLM, retrieval tuning has a direct impact on time to first token, end-to-end request latency, throughput, and cost per million tokens.
For production deployments, scale RAG services independently and validate performance with benchmark data, metrics, and tracing. Use balanced performance, throughput per user, latency thresholds, and TCO as the primary sizing criteria rather than raw maximum throughput or accuracy alone. Any production ready enterprise RAG solution must deliver SLA on all 3 pillars - Accuracy (Recall p95), Performance (throughput and/or latency) and TCO (cost per million tokens). This approach helps enterprises build a predictable, cost-efficient RAG for AI factories that can scale from focused chat use cases to high-concurrency, multi-use-case deployments.
Scaling Best Practices#
Baseline Configuration - Scale 1X#
The Scale 1X baseline uses 2.75 GPUs total and serves as the reference point for all linear scaling ratios and throughput benchmarks. Assign full GPUs to LLM NIM and Reranking NIM for Scale 8X and beyond.
Baseline Retrieval |
Resources |
Configuration |
|---|---|---|
LLM NIM (llama-3.3-nemotron-super-49b-v1.5) |
1 GPU (TP1) |
RTX PRO 6000 - vLLM, TP1, NVFP4. H200 NVL - vLLM, TP1, FP8. Drives TTFT and ITL. |
Reranking NIM (llama-nemotron-rerank-1b-v2) |
1 GPU (BP16) |
Recommended for multi-collection |
Embedding NIM (llama-nemotron-embed-1b-v2) |
0.5 GPU (Run:ai/MIG) |
Query encoding at request time. 2048 dims X FP32 |
Milvus Vector DB |
1 Data Node (cuVS GPU-CAGRA). 1 Query node (4M vectors) |
Data node - 0.25 GPU (Run:ai/MIG). Query node - 16 vCPU, 40 GiB. 1 Query node per 4M vectors; Query node is CPU only |
RAG Server (NVIDIA Blueprint RAG server) |
64 workers; 16 vCPU, 64 GiB |
Orchestrates pipeline; scales 1:8 vs LLM NIM |
Total Scale-1X Baseline |
2.75 GPUs, 50 vCPU, 144 GiB |
1 LLM + 1 Reranker + 0.5 Embed + 0.25 Milvus |
Linear Scaling Ratios#
RAG services scale at different rates relative to the LLM NIM. These ratios define how many LLM instances are needed before you need to add another replica of a dependent component. Reranker ratios differ between Chat (low ISL) and Summarization(high ISL) workloads because ISL strongly affects LLM throughput.
Scale RAG server earlier with Generation (long OSL), these queries last 2X longer than Summarization and 2X more Workers are needed.
The Embedding NIM (1:40 ratio) can serve 40 LLM GPUs before needing a second replica – it is almost never the bottleneck. Monitor GPU utilization for each NIM separately and scale out when sustained utilization exceeds 80%.
Component |
Scale Ratio (Chat) |
Scale Ratio (Summarization/Generation) |
Scaling details |
|---|---|---|---|
LLM NIM (llama-3.3-nemotron-super-49b-v1.5) |
1 : 1 |
1 : 1 |
Reference - add 1 LLM GPU for every scale unit |
Reranker NIM (llama-nemotron-rerank-1b-v2) |
1 : 8 (1 per 8 LLM GPUs) |
Summarization 1 : 4 (1 per 4 LLM) |
Summarization needs 2X more Reranker capacity due to higher ISL |
Embedding NIM (llama-nemotron-embed-1b-v2) |
1 : 50 (1 per 50 LLM GPUs) |
1 : 40 |
Embedding is rarely a bottleneck - Chat queries are short (128 tokens) |
Milvus Query Node |
1 per 4M vectors |
1 per 4M vectors |
Scale query nodes to match collection size, not concurrency |
RAG Server |
1 : 8 (1 per 8 LLM GPUs) |
Generation 1 : 4 (1 per 4 LLM) |
Lightweight orchestrator; each pod handles ~8 concurrent sessions |
RAG Scaling Table - 1X to 96X#
The table below shows full-system GPU counts for Chat and Summarization workloads at each scale tier, based on the linear ratios above.
Scale 96X represents enterprise-scale deployment serving 2000 (Low Latency) and 5000 (Balanced Performance) concurrent users.
The Milvus GPU column (0.25 GPU for Milvus Data node) is fixed – scale Milvus Query Nodes (CPU-only) separately based on collection size (1 Query node per 4-5M vectors). For 10M vectors, scale to at least 2 Query nodes regardless of LLM scale.
Scale |
LLM GPUs |
Reranker GPUs (Chat) |
Reranker GPUs (Sum) |
Embed GPUs |
Milvus GPU |
Total (Chat) |
Total (Sum) |
|---|---|---|---|---|---|---|---|
1X |
1 |
1 |
1 |
0.5 |
0.25 |
2.75 |
2.75 |
2X |
2 |
1 |
1 |
0.5 |
0.25 |
3.75 |
3.75 |
4X |
4 |
1 |
1 |
0.5 |
0.25 |
5.75 |
5.75 |
8X |
8 |
1 |
2 |
0.5 |
0.25 |
9.75 |
10.75 |
16X |
16 |
2 |
4 |
0.5 |
0.25 |
18.75 |
20.75 |
24X |
24 |
3 |
6 |
0.5 |
0.25 |
27.75 |
30.75 |
32X |
32 |
4 |
8 |
1 |
0.25 |
37.25 |
41.25 |
48X |
48 |
6 |
12 |
1 |
0.25 |
55.25 |
61.25 |
64X |
64 |
8 |
16 |
1.5 |
0.25 |
73.75 |
81.75 |
96X |
96 |
12 |
24 |
2 |
0.25 |
110.25 |
122.25 |
Scaling Efficiency#
Scaling efficiency measures how close to linear a scale-out is. The target efficiency is >= 80% – below this threshold, scaling is wasteful and indicates a bottleneck in one of the pipeline components (typically the Reranker or RAG server at high concurrency).
Efficiency formula:
For example for RAG Scale8X:
To achieve Linear Scaling with RAG (Efficiency >80%) ensure that core services are scaled when required and remain within the Latency threshold:
LLM Latency > 80%-90% of TTFT
Reranker < 10% of TTFT
Retriever Embedder < 5% of TTFT
Milvus Search (Query node) CPU < 2% of TTFT
Note
Milvus Vector DB Query nodes needs to be scaled based on data ingested and Vector DB collection size to hold data in memory (RAM).
RAG Chat Scale |
RTX PRO 6000 Output TPS (CR=30) |
Scaling Efficiency |
Status |
|---|---|---|---|
1X (Baseline) |
~386 TPS |
100% (reference) |
Baseline |
2X |
~726 TPS |
~94.0% |
Excellent |
4X |
~1,442 TPS |
~93.4% |
Excellent |
8X |
~2,889 TPS |
~93.5% |
Excellent |
16X |
~5,797 TPS |
~93.9% |
Excellent |
32X |
~11,067 TPS |
~89.6% |
Good |
64X |
~22,056 TPS |
~89.3% |
Good |
96X |
~33,704 TPS |
~91.0% |
Good |
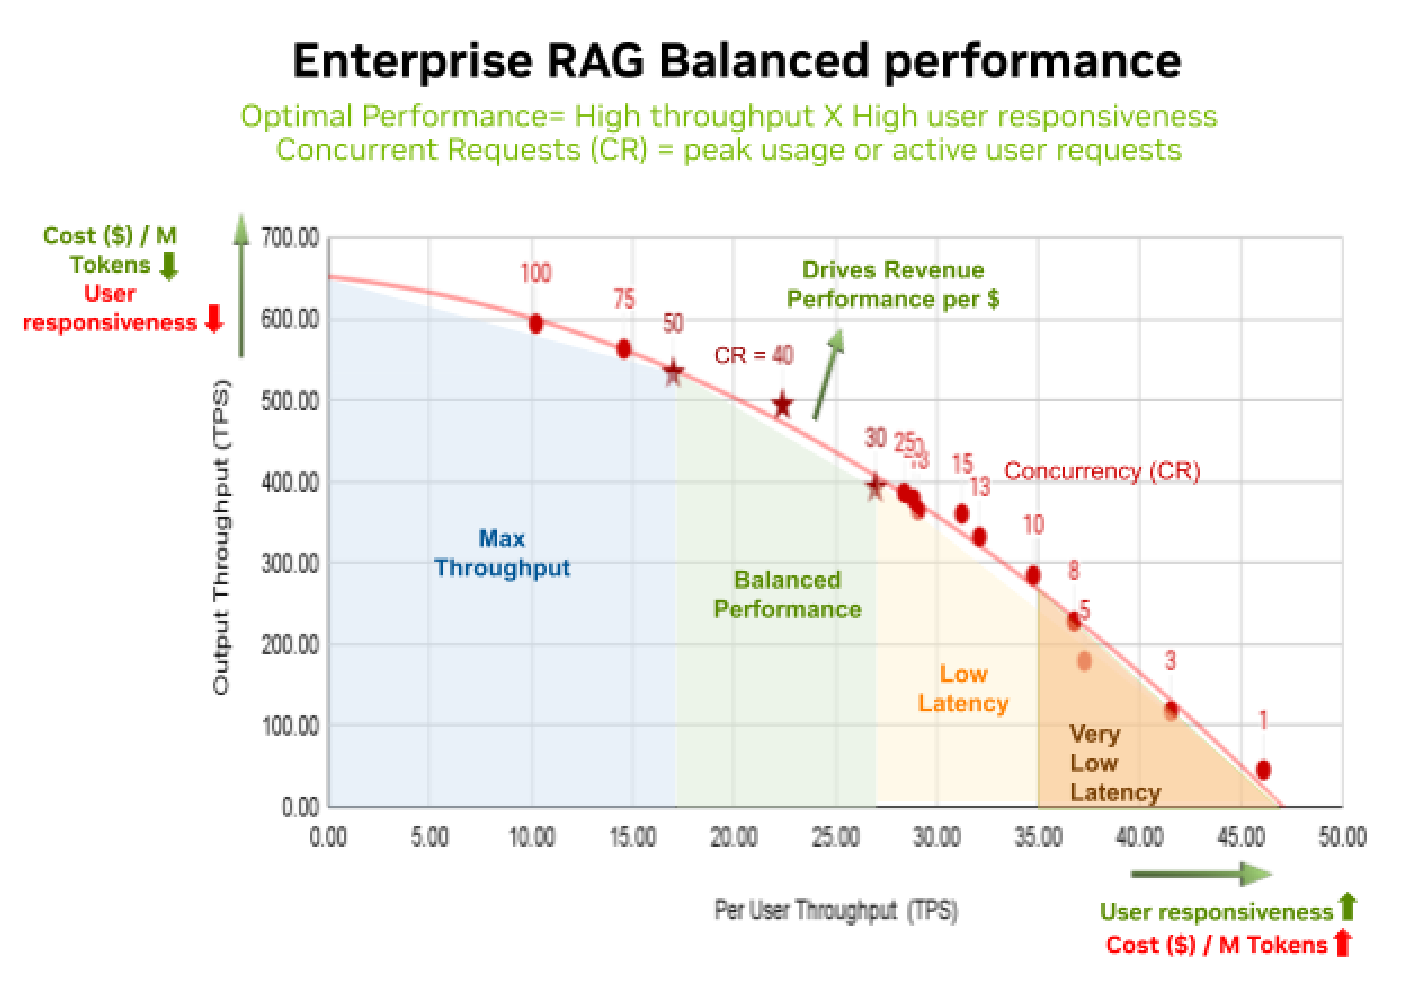
Figure 42 RAG Chat Scaling Efficiency - RTX PRO 6000 Scale 1X to 96X#
Balanced Performance#
Majority of AI inference workloads should use Balanced Performance for RAG Retrieval, this is when found by maximizing product of Output Throughput (TPS) X User Throughput (TPS).
Balance throughput with latency => output throughput (Tokens per second) and user responsiveness (Per-user tokens per second). Balanced Performance drives revenue and increases TCO performance per $ (Cost).
Autoscaling with HPA#
Enable Kubernetes Horizontal Pod Autoscaler (HPA) for scaling RAG services using NVIDIA NIM GPU utilization or LLM KV-Cache or running requests metrics exposed via Prometheus. Different metrics are appropriate for different NIM types.
LLM Autoscaling Metric: Use
gpu_cache_usage_perc(KV-cache utilization) as the HPA metric for LLM NIM. Scale out when KV-cache exceeds 60%.NIM Autoscaling Metric: Use
gpu_utilizationas the HPA metric for Embedding and Reranking NIM microservices. Scale out at 70% GPU utilization.RAG server and Milvus Query Node: Enable HPA with CPU and memory utilization targets (80%). Enable with
hpa.enabled: truein the Milvus Helm values.
NIM Component |
HPA Metric |
Scale-Out Threshold |
Auto Scaling Tips |
|---|---|---|---|
LLM NIM (llama-3.3-nemotron-super-49b-v1.5) |
gpu_cache_usage_perc |
>60% |
KV cache pressure indicates LLM is approaching concurrency limit. Scale out before cache fills to avoid request queuing. |
Reranker NIM (llama-nemotron-rerank-1b-v2) |
gpu_utilization |
>70% |
Reranker is scaled at 1:8 of LLM or 1:4 for Summarization – scale out if latency exceeds 10% of TTFT. |
Embedding NIM (llama-nemotron-embed-1b-v2) |
gpu_utilization |
>70% |
Embedding is rarely the bottleneck (1:40 ratio). Scale out only if embedding p90 latency exceeds 200 ms or 5% of TTFT. |
RAG Server |
request_rate or CPU utilization |
>80% CPU or > 800 requests (CR) per replica. > 400 CR for Generation |
Lightweight pod; scale with LLM to maintain 1:8 ratio or 1:4 ratio for Generation. |
Milvus Query Node |
query rate or CPU/Memory utilization |
>80% CPU or Memory or > 250 Queries per second QPS |
Milvus Query Node will be scaled out when 1 or more large collections are loaded for Search. 1 Query node per 4-5M vectors. |
Additional autoscaling considerations:
Metric endpoint - NIM pods expose Prometheus metrics at
/metricson port 8000 (HTTP) or/v1/metrics(varies by NIM version). Scrape with Prometheus and use Kubernetes custom metrics adapter (KEDA or prometheus-adapter) for HPA.Scale-out delay - Even with NIM caching, scale out can take from 2-5mins, with LLM taking the longest time. Account for scale out time when setting Scale-out thresholds to provide sufficient time for NIM service to get ready.
Scale-in delay - Set a stabilization window of 5 minutes for scale-in to avoid flapping. LLM NIM instances take 60-120 seconds to initialize – premature scale-in and re-scale-out creates TTFT spikes during the warm-up period.
Node affinity - Pin LLM NIM pods to dedicated GPU nodes with
nvidia.com/gpu: 1resource requests. Avoid co-locating LLM NIMs with other GPU workloads – GPU memory contention causes unpredictable TTFT degradation.
Observability and Monitoring#
Enable full telemetry before benchmarking or before going to production. Retrieval pipeline latency is composed of multiple stages – only distributed tracing reveals where time is actually spent.
Prometheus + Grafana - Collect
gpu_cache_usage_perc(LLM KV cache fill),gpu_utilization(all NIMs),num_requests_waiting(LLM queue depth), and TTFT / ITL / E2E latency percentiles. Alert when p95 TTFT exceeds 1.2x the SLA target.OpenTelemetry / Jaeger - Enable distributed tracing in the RAG server to measure retrieval stage breakdown: query embedding time, Milvus search time, Reranker time, and LLM prefill + decode time. For Chat baseline (CR=32), expect: Milvus <50 ms, Embedding <30 ms, Reranker <100 ms, LLM prefill ~1,500 ms, LLM decode ~3,800 ms.
KV cache pressure dashboard - Build a Grafana panel tracking
gpu_cache_usage_percover time. If cache usage is consistently >80%, either reduce CR (add more LLM GPUs) or reduce ISL (smaller chunk size or lower TopK).Milvus query node metrics - Monitor Milvus search latency via Grafana Milvus dashboard. If Milvus search p95 > 200 ms, add more Query nodes or verify GPU CAGRA is enabled (IVF_SQ8 or GPU_IVF_SQ8 index type).
Metrics and Performance Targets#
The 3 main pillars for successful Enterprise RAG solution are:
Accuracy - is the responses grounded and based on context provided, no hallucinations
Performance - Does it meet the Latency and Throughput requirements for the use case Chat, Summarization, Generation etc.
Efficiency or Performance per $ (TCO) - what is the output per cost investment
Key Performance Targets#
Three latency metrics define RAG retrieval performance. Each has distinct drivers and must be measured and optimized independently. RAG mainly affects TTFT since it adds context overhead to the user query.
For Summarization (long ISL) TTFT drives the E2E latency while for Generation (long OSL) ITL drives E2E Latency. In the case of Chat (short ISL and OSL) TTFT and ITL are equally responsible for E2E latency.
RTX PRO 6000 has 1.5X -2X higher ITL (decode time) compared to H200 NVL, especially at lower concurrencies (CR <30) and at higher concurrencies (CR>72). This makes RTX PRO less suited for Generation (high OSL) and latency sensitive applications.
At Concurrency CR > 80, ITL degrades sharply for RTX PRO 6000, wide fanout especially at higher scale, resulting in unpredictable latency spikes. For H200 NVL ITL degrades at CR>100 at a slower pace.
Metric |
Definition |
Primary Driver |
Acceptable Range |
|---|---|---|---|
TTFT (Time to First Token) |
Time from user query submission to receiving the first response token |
RAG context, Concurrent requests (CR) |
Chat: <= 3-5s; Summarization: <=10-20s |
ITL (Inter-Token Latency) |
Average time between successive output tokens after the first token |
OSL length, concurrent requests, KV cache pressure |
Chat: <=80 ms; Summarization: <=200 ms |
E2E Latency |
Total response time from query to last output token (TTFT + ITL x OSL) |
ISL, OSL, CR, and Reranker overhead combined |
Chat: <=10s; Summarization: <= 60s |
Latency Constraint Buckets#
Choose a deployment target that matches user experience requirements. Higher concurrent requests increase throughput but degrade per-user latency.
Balanced Performance is the recommended default for most enterprise RAG deployments. It maximizes the product of Output TPS x Per-User TPS and occurs at approximately CR ~= 32 for Chat (ISL=128 / OSL=128).
TTFT degrades sharply at Concurrency > 80 for RTX PRO 6000 and for H200 NVL TTFT degrades slowly at CR>100.
Latency SLA |
TTFT Target |
Concurrency (CR) |
Use Case |
|---|---|---|---|
Low Latency |
<= 3s |
CR <= 20 |
Interactive chat, customer service |
Balanced Performance |
3-5s or <= 5s |
CR <= 50 |
Internal knowledge base, Personal assistants, developer portals |
Max Throughput |
<=10s |
CR <= 100 |
Batch summarization, Code generation, Deep research, report generation |
GPU Comparison - RTX PRO 6000 vs H200 NVL#
At Scale 8X RAG Chat performance comparison for RTX PRO 6000 and H200 NVL:
Scale 8X at CR=10 |
Per-User TPS |
TTFT (s) |
ITL (ms) |
E2E Latency (s) |
Output Throughput TPS |
|---|---|---|---|---|---|
H200 NVL |
~39 TPS |
1.7 s |
~39 ms |
5.5 s |
~2298 TPS |
RTX PRO 6000 |
~22 TPS |
1.4 s |
~55 ms |
7.3 s |
~1455 TPS |
Scale 8X at CR=30 |
Per-User TPS |
TTFT (s) |
ITL (ms) |
E2E Latency (s) |
Output Throughput TPS |
|---|---|---|---|---|---|
H200 NVL |
~21 TPS |
~3.5 s |
~80 ms |
11.6 s |
~3520 TPS |
RTX PRO 6000 |
~15 TPS |
~3.3 s |
~90 ms |
13 s |
~2889 TPS |
GPU comparison recommendations:
H200 NVL for Low Latency apps - H200 NVL delivers 1.5X-2X better output throughput and user responsiveness (per-user throughput) at low concurrency (CR <= 20). Preferred for latency-sensitive applications with Low latency SLAs (TTFT <3s, E2E Latency<10s). RTX PRO 6000 has slightly lower TTFT than H200 NVL but ITL is almost 2X that of H200 NVL, this affects per-user throughput and E2E latency.
RTX PRO 6000 for AI Inference apps (Balanced Performance) - RTX PRO 6000 approaches H200 NVL performance at Balanced Performance (CR = 20-50). TCO-optimized for enterprise deployments with moderate latency requirements.
H200 NVL for Generation apps (MAX Throughput) - At CR > 80, RTX PRO 6000 TTFT degrades sharply than H200 NVL due to KV cache pressure, lower memory bandwidth. H200 NVL provides better stability at high Concurrency CR =80-120 (MAX Throughput).
RTX PRO 6000 Latency degradation at scale - RAG E2E Request Latency degradation is observed at higher Scale 16X and beyond since the TTFT and ITL fan out and diverge from RAG Baseline Scale 1X. Scaling out adds overhead from Kubernetes load balancing which can result in uneven distribution of requests across LLM replicas. Some replicas get 50% more than expected load. RTX PRO 6000 with limited memory bandwidth sees more queuing and long latency tails. This results in unpredictable latency spikes and reduces linear scaling efficiency by 10-15%. Mitigate with KV-Cache aware routing to not only enable KV Cache reuse but also route request to LLM replicas based on existing load, KV Cache utilization to ensure more even spread of RAG requests between replicas.
RAG ISL - Context Overhead#
The RAG Input Sequence Length (ISL) is significantly larger than the raw user query because it includes retrieved context chunks, the system prompt, and query encoding. ISL is the single largest driver of TTFT and overall LLM throughput.
RAG ISL = User Query + [TopK x Avg_Chunk_Size] + SysPrompt. For Chat (128/128) with Average Chunk Size = 243:
Chat RAG ISL = 128 + [4 x 243] + 107 = 1,207 tokens
Summarization RAG ISL = 1,024 + [4 x 243] + 107 = 2,103 tokens
Why ISL matters - The LLM prefill phase is proportional to ISL. A 2X increase in ISL roughly doubles TTFT at low concurrency and increases KV cache memory pressure, compressing the effective concurrency ceiling.
ISL Increase |
TTFT Impact (Low Latency CR<=20) |
TTFT Impact (Balanced CR<=50) |
TTFT Impact (Max Throughput CR<=80) |
|---|---|---|---|
+ 1,000 tokens (e.g., chunk size 256->512) |
Up to 25% TTFT increase |
Up to 33% TTFT increase |
Up to 50% TTFT increase |
TopK 4->10 (+1,458 tokens at chunk 243) |
Throughput drops 36% |
Throughput drops 41% |
Throughput drops 46% |
Reranker ON (+~50 ms pipeline latency) |
~10% TTFT overhead |
~10% TTFT overhead |
~8% TTFT overhead |
KV-Cache aware routing and offload - to mitigate RAG ISL context overhead enable KV Cache reuse and KV Cache offload. RAG server sends queries to smart inference router to route requests to LLM replicas with existing KV-Cache for Vector DB chunks. For Summarization, Generation, multi-turn Chat or Agentic workflows with significant context, topK=10 or reading full documents, it would be more viable to perform once and reuse KV-cache by offloading to fast storage, CPU RAM or Local NVMe disk or remote storage.
Chunk Size - Select based on use case#
Chunk size is locked at ingestion time and has the largest single impact on both retrieval accuracy and LLM throughput. Chunk Size increases context (RAG ISL) and significantly impacts RAG Retrieval latency (TTFT), Throughput (TPS) and TCO. Choose based on Retrieval use case, not purely on Accuracy (improves 2-5%) or ingestion performance.
Chunk Size for Chat TopK=4 |
TTFT at CR=16 |
Best For |
Trade-off |
|---|---|---|---|
256 tokens |
~2.0 s |
RAG Chat - Low Latency TTFT <3s - interactive Q&A, Customer service |
Higher throughput at lower Latency SLAs. Ideal for Chat short request/response applications |
512 tokens |
~3.8 s |
RAG Summarization of emails, meetings, documents - moderate ISL, higher latency tolerance (TTFT <5-10s) |
Adds RAG ISL overhead of ~1000 tokens (TopK=4) vs Chunk=256; 1.5X - 2X higher TTFT. Reduces LLM throughput by 25-33% |
1,024 tokens |
~8.5 s+ |
Code Generation, Deep research, Reasoning Analysis. E2E Latency= 30-60s |
Not suitable for Chat (TTFT >5s). Recommended for reasoning/thinking use cases |
Chunk Size should be driven by the RAG Retrieval application/use case:
Chat (128/128) - short requests and short responses (ISL=128, OSL=128), with Low Latency SLAs (TTFT <3s) should use smaller Chunk Sizes 128-256 tokens.
Summarization (1024/512) - require more context (larger ISL=1024 and OSL=512) can have larger Chunk sizes of 256 to 512 tokens. The latency SLAs are not as stringent.
Generation (128/2048) - require significantly higher output context (OSL >1024) with reasoning/thinking tokens; can have a much larger Chunk size of 1024 tokens and even pull the full document for context. Latency is not a priority but details and accuracy are crucial.
TopK - Number of Retrieved Chunks#
TopK recommendation - For Chat (128/128) with tight latency SLAs (TTFT<=3s), select TopK = 4. Provides sufficient context with minimal ISL overhead (1,207 total tokens including system prompt). For Summarization and Generation where latency SLAs are not as strict and more context is required to improve accuracy and details in responses increase TopK=10.
Increasing TopK - TopK 4->10 increases ISL by ~1,458 tokens and drops LLM output throughput by 36-46% depending on the Latency SLAs and concurrency regime. Only increase TopK if retrieval recall benchmarks show insufficient accuracy at TopK=4.
Reranker as alternative - When querying multiple collections use Reranker to filter and avoid higher TopK to LLM. For 2 Collections, VDB TopK=4 (without Reranker) sends 8 Chunks to LLM. Enabling Reranker with TopK=4, sends only 4 chunks, outperforming without Reranker at ~1/2 ISL cost.
Reranker Strategy#
GPU Allocation – full vs fraction – Allocate full GPU to Reranking NIM with the intention to scale Retrieval pipeline to Scale 8X and beyond. For Chat with Scale 6X or lower, allocate 0.5 (50%) GPU (Run:ai or MIG) for Reranking NIM.
Single Collection – Disable: Vector DB retrieval alone provides sufficient accuracy for single-collection queries. Disabling the Reranker removes a full GPU call from every request and reduces RAG Retrieval baseline TCO by ~1/3.
Multi-Collection – Enable: Enable the Reranker for multi-collection or cross-source queries to filter to the most relevant chunks before LLM context injection. For Chat with 2-5 collections, set VDB-TopK/Reranker-TopK = 4/4, get 4 chunks from each collection but filter down to only 4 chunks sent to LLM.
Scaling – For Summarization (1024/512) scale Reranking NIM earlier (1:4 ratio, 1 per 4 LLM) instead of 1:8 (1 per 8 LLM) for Chat(128/128). Summarization increases ISL overhead (128 ->1024) with more context to match.
Sizing Guide - Chat and Summarization#
Chat Workload: 128 ISL / 128 OSL#
Chat sizing assumes concurrent users generating short queries with short responses. GPU count is for LLM NIM only; add Reranker, Embedding, and Milvus resources per the scaling ratios.
Enterprise Size |
Concurrent Users |
Target TTFT |
LLM GPUs |
GPUs (Nodes) |
Platform |
|---|---|---|---|---|---|
X-Small, 100-200 Users |
<=20 users |
<= 5 s, <= 3 s (Low Latency) |
1 |
~3 (1 Node) |
RTX PRO 6000 |
Small, 500 Users |
30-50 users |
<= 5 s, <= 3 s (Low Latency) |
1-2 |
~4-5 (1 Node) |
RTX PRO 6000 |
Medium, 1000 Users |
50-200 users |
<=5 s, <= 3 s (Low Latency) |
3-5 |
~6-10 (1-2 Nodes) |
RTX PRO 6000 |
Large, 5000 Users |
500-1000 users |
<=5 s, <= 3 s (Low Latency) |
16-30 |
~ 19 - 38 (3-5 Nodes) |
RTX PRO 6000 or H200 NVL |
X-Large, 10,000 Users |
1000-2000 users |
<=5 s, <= 3 s (Low Latency) |
40-80 |
~ 47-92 (6-12 Nodes) |
RTX PRO 6000 or H200 NVL |
Summarization Workload: 1024 ISL / 512 OSL#
Summarization assumes longer document inputs and longer generated summaries. The higher ISL increases TTFT significantly – budget more GPUs for the same user count.
Enterprise Size |
Concurrent Users |
Target TTFT (Balanced Perf) |
LLM GPUs |
GPUs (Nodes) |
Platform |
|---|---|---|---|---|---|
X-Small, 100-200 Users |
<=20 users |
<=10 s |
1 |
~3 (1 Node) |
RTX PRO 6000 |
Small, 500 Users |
30-50 users |
<=10 s |
2-4 |
~4-6 (1 Node) |
RTX PRO 6000 |
Medium, 1000 Users |
50-200 users |
<=10 s |
8-16 |
~11-21 (2-3 Nodes) |
RTX PRO 6000 |
Large, 5000 Users |
500-1000 users |
<=10 s |
24-48 |
~31-62 (4-8 Nodes) |
RTX PRO 6000 or H200 NVL |
X-Large, 10,000 Users |
1000-2000 users |
<=10 s |
64-96 |
~82-123 (10-16 Nodes) |
RTX PRO 6000 or H200 NVL |
Summarization requires roughly 2X the LLM GPU capacity of Chat for equivalent user counts. If your deployment serves both Chat and Summarization workloads, size for Summarization and use Chat as a headroom buffer.
RAG Performance - Chat and Summarization#
RAG scaling for Chat 128/128 with Low Latency and Balanced Performance for RTX PRO 6000:
RAG Scale |
GPUs |
Latency SLA |
TTFT Threshold |
Concurrent Requests per LLM CR |
Max Throughput (TPS) |
Max Requests (RPS) |
Efficiency |
|---|---|---|---|---|---|---|---|
1X |
2.75 |
Low Latency |
<= 3s |
<= 20 |
321 |
2.51 |
NA |
1X |
2.75 |
Balanced Performance |
3s - 5s |
<= 50 |
4472 |
3.69 |
NA |
10X |
12.75 |
Low Latency |
<= 3s |
<= 20 |
2,974 |
23.24 |
92.59% |
10X |
12.75 |
Balanced Performance |
3s - 5s |
<= 50 |
4,278 |
33.42 |
90.58% |
20X |
23.75 |
Low Latency |
<= 3s |
<= 20 |
5,903 |
46.12 |
91.87% |
20X |
23.75 |
Balanced Performance |
3s - 5s |
<= 50 |
8,476 |
66.42 |
89.72% |
96X |
109.25 |
Low Latency |
<= 3s |
<= 20 |
27,715 |
216.52 |
89.86% |
96X |
109.25 |
Balanced Performance |
3s - 5s |
<= 50 |
36,950 |
289 |
81.49% |
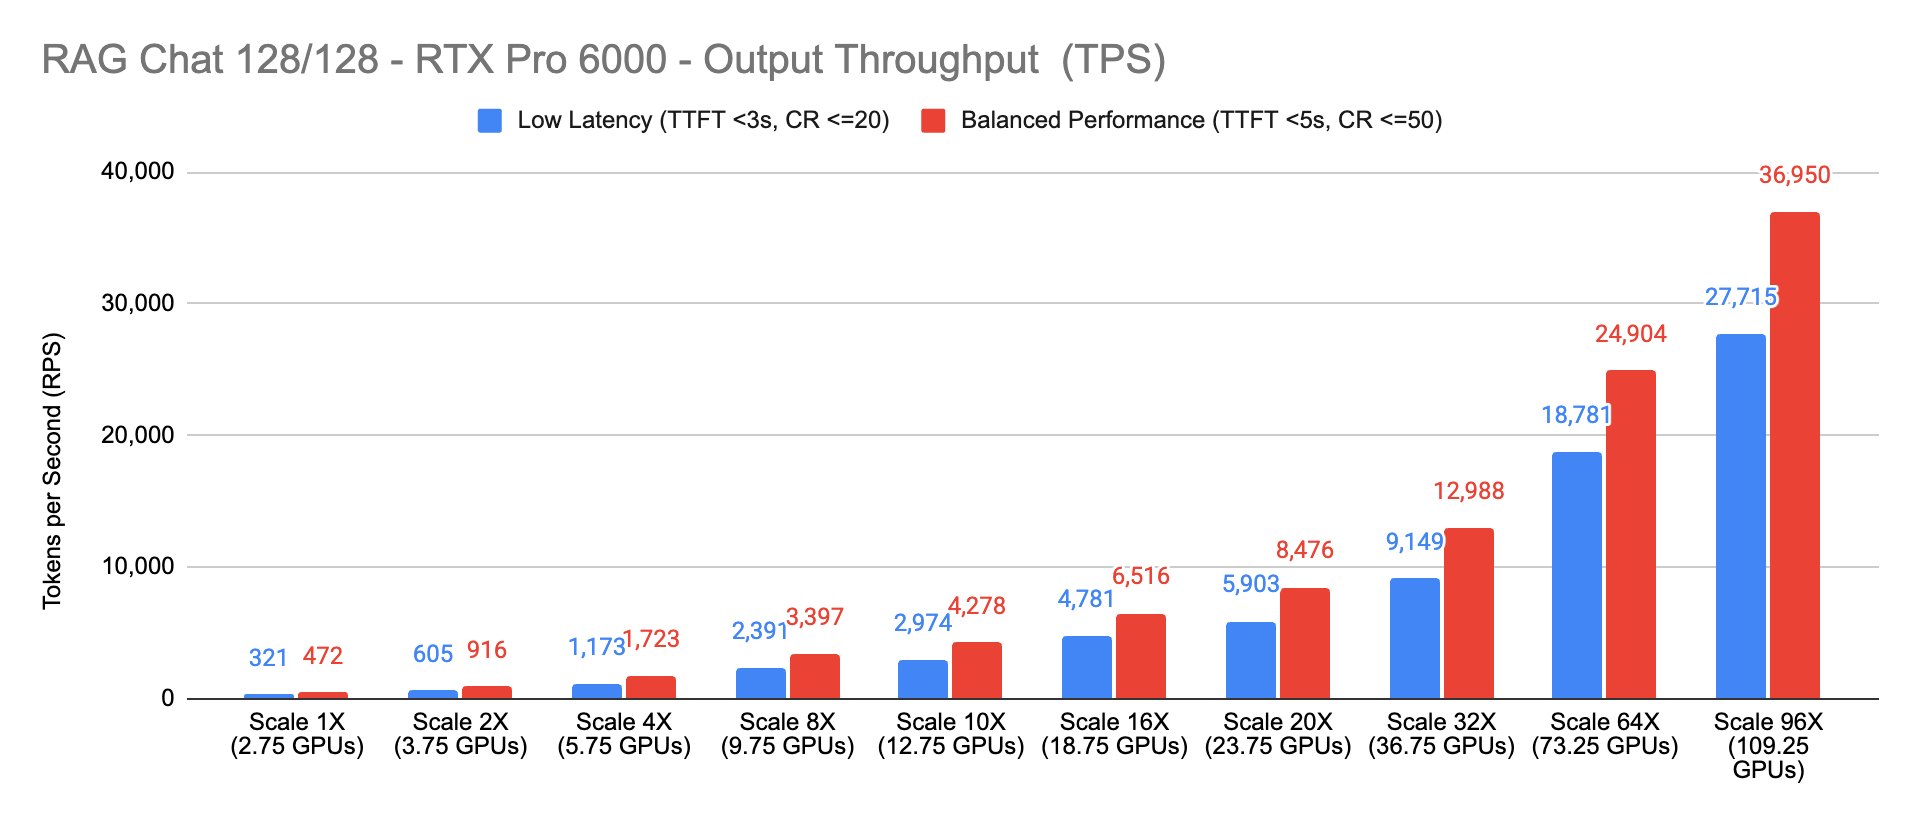
Figure 43 RAG Chat (128/128) - H200 NVL Performance at Scale 1X to 20X#
RAG scaling for Summarization with Balanced Performance and Max Throughput for H200 NVL:
RAG Scale |
GPUs |
Latency Bucket |
TTFT Threshold |
Concurrent Requests per LLM CR |
Max Throughput (TPS) |
Max Requests (RPS) |
Efficiency |
|---|---|---|---|---|---|---|---|
1X |
2.75 |
Balanced Performance |
9s - 15s |
<= 50 |
470.17 |
0.92 |
NA |
1X |
2.75 |
Max. Throughput |
< 200s |
<= 100 |
521.05 |
1.02 |
NA |
8X |
9.75 |
Balanced Performance |
10s - 20s |
240 < CR <= 400 |
3,566.97 |
6.97 |
94.30% |
8X |
9.75 |
Max. Throughput |
< 200s |
CR <= 800 |
3,855.63 |
7.53 |
92.5% |
16X |
18.75 |
Balanced Performance |
15s - 30s |
480 < CR <= 800 |
7,422.78 |
14.5 |
98.67% |
16X |
18.75 |
Max. Throughput |
< 200s |
CR <= 1,600 |
8,436.85 |
16.48 |
101.20% |
20X |
23.75 |
Balanced Performance |
35s - 60s |
1200 < CR <= 2,000 |
18,606.96 |
36.34 |
98.94% |
20X |
23.75 |
Max. Throughput |
< 200s |
CR <= 4,000 |
20,942.12 |
40.9 |
100.48% |
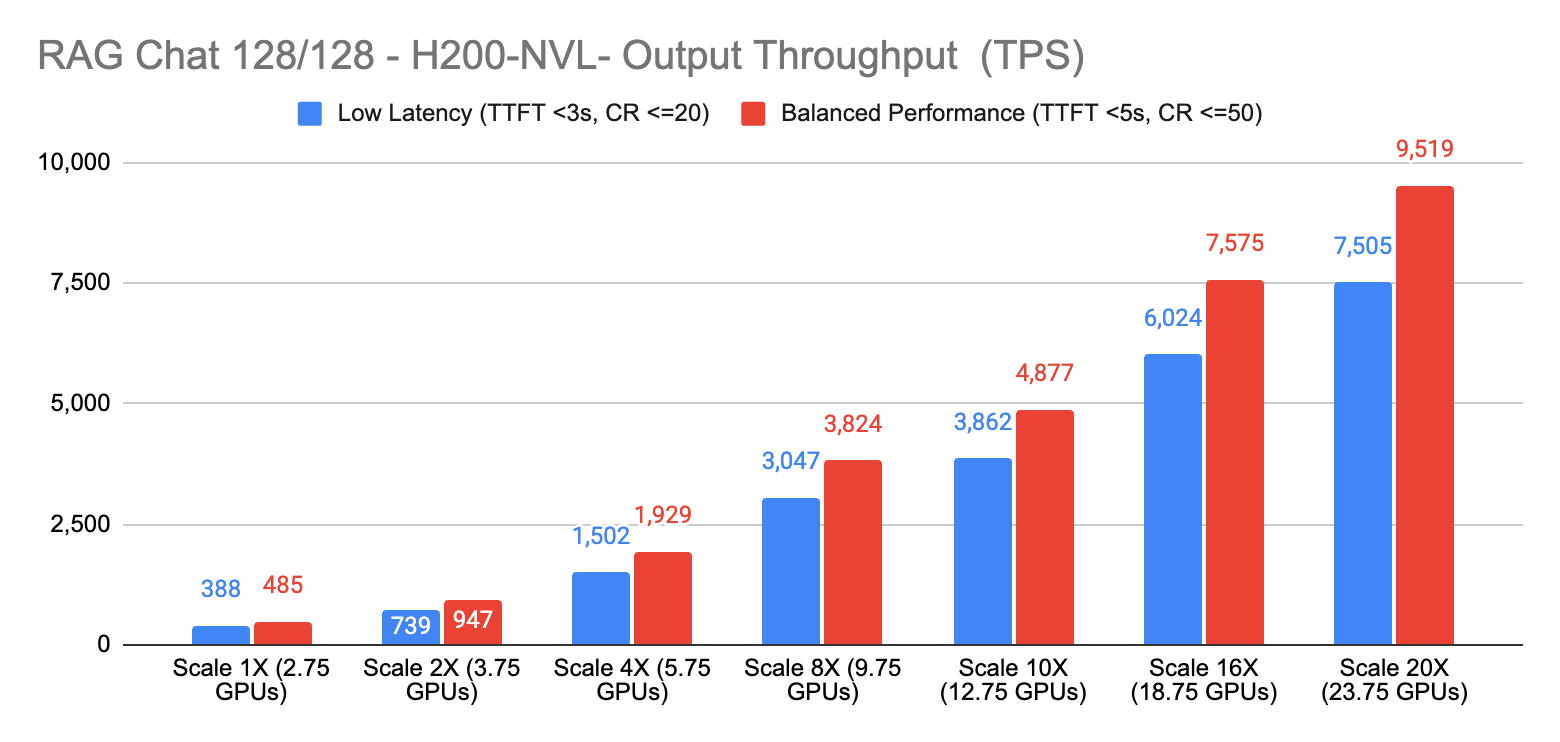
Figure 44 RAG Summarization (1024/512) - H200 NVL Performance at Scale 1X to 20X#
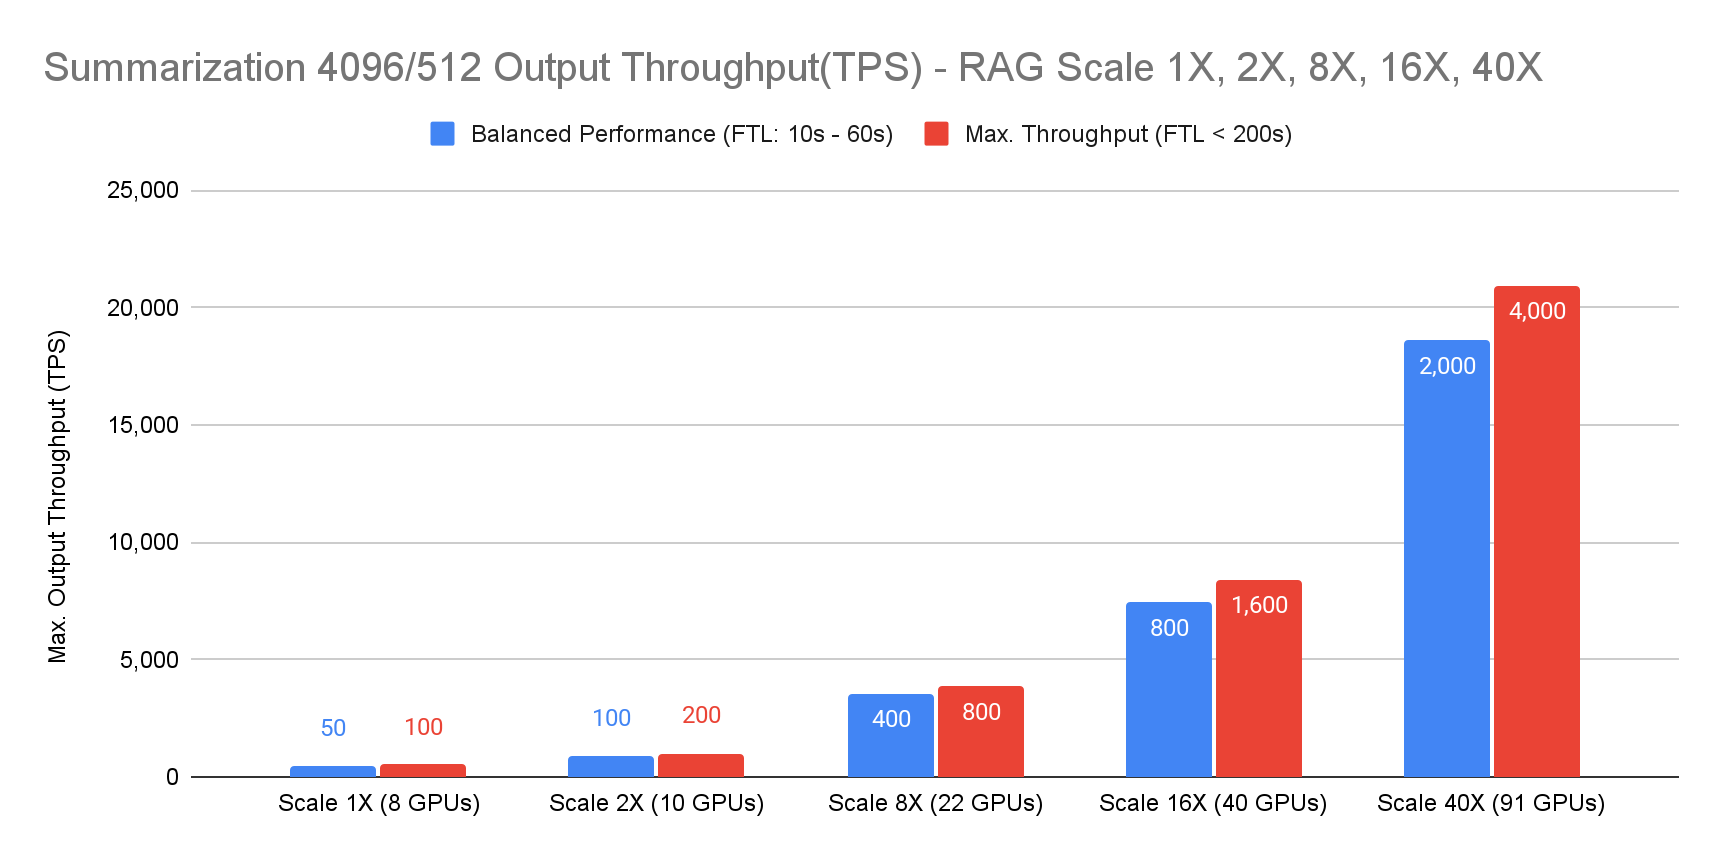
Figure 45 RAG Summarization - H200 NVL Scaling Performance Additional Detail#