
RAG Scaling Guidelines#
For the Linear scale of the RAG Service, the RAG retrieval pipeline needs to scale LLM along other components (RAG server, Reranking NIM, Embedding NIM, Vector DB Search nodes) if needed, to support more Peak Users (concurrent requests). When this guide refers to RAG Scale, it is referring to LLM scale + other components scale if needed. The LLM accounts for majority of the overhead but there is a need to scale the other components as well; Reranking NIM, Milvus Vector DB components, Embedding NIM and RAG server; to prevent them from becoming bottlenecks.
RAG Baseline Scale 1X#
For the RAG Retrieval the baseline scale RAG Scale 1X is shown below.
RAG Baseline Scale 1X - 2.75 GPUs, 64 vCPUs, 192 GiB => 1 Node
RAG server (64 workers, 16 vCPU, 64 GiB)
LLM NIM (1 GPU) - Model: llama-3.3-nemotron-super-49b-v1.5
RTX PRO 6000: vLLM, NVFP4, TP1, throughput
H200 NVL: vLLM, FP8, TP1, throughput
Reranking NIM (1 GPU) - Model: llama-nemotron-rerank-1b-v2
Embedding NIM (0.5 GPU with Run:ai or MIG) - Model: llama-nemotron-embed-1b-v2
Milvus Vector DB Scale 2X up to 10M vectors
1 Data node (cuVS Index) - only for RAG ingestion (0.25 GPU with Run:ai or MIG, 16 vCPU, 32 GiB)
2 Query node (CPU) 2X (16 vCPU, 40 GiB)
The RAG Retrieval baseline does not include NeMo Retriever (NV-Ingest) Ingestion pipeline, RAG Ingestor server, NV-Ingest and Extraction NIM microservices are not installed or scaled down.
RAG Scale nX - Scale 16X example#
RAG Scale nX implies LLM Scale nX + scaling other components (Milvus Vector DB Query nodes, Reranker, Embedder, RAG server) based on component Latency thresholds; where n=1,2,4,8,16,20 etc.
RAG Scale 16X - VDB 10M vectors - 18.75 GPUs, 80 vCPU, 256 GiB => 3 nodes
RAG server Scale 2X (16 vCPU, 64 GiB, 64 workers)
LLM Scale 16X (16 GPUs with TP1)
Reranking NIM Scale 2X (2 GPUs)
Embedding NIM Scale 1X (0.5 GPU)
Milvus Scale 2X at 10M vectors
1 Data/index (0.25 GPU, 16 vCPU, 32 GiB) (required only with ingestion)
2 X Query/Search (16 vCPU, 40 GiB)
The Speed of Light (SOL) goal is to achieve linear scale for the RAG Retrieval pipeline; where when RAG (or LLM) is scaled to 2X, 3X, 4X, 8X etc, the Output Throughput (TPS/RPS) and Peak Users or Concurrent Requests (CR) should scale proportionally for the same Latency constraints.
RAG Latency constraints#
This guide defines 3 Latency constraint buckets: Max. Throughput, Balanced Performance, Low Latency to help scale and size RAG service for different use cases. These Latency constraint buckets should be used as examples. Choose Latency constraint buckets with Latency ranges depending on the Enterprise use case requirements. It is recommended to choose at least 2 or 3 buckets and assign the use case to a Latency constraint bucket. There are some examples of this shown below.
Using the example RAG service Latency chart below for RAG Scale 1X, (the CR and TTFT values below are examples and values will differ for each use case and scale):
Usecase1: Summarization
For a summarization use case to create notes from meeting transcripts; where Latency is not as critical and Balanced Performance is ideal; allow for response time under 5s (TTFT <5s), then the RAG service shown below can support up to 50 Peak Users or 50 Concurrent Requests.
To support Peak Users or Concurrent Requests CR =100, then double the RAG Scale to 2X assuming linear scaling for the RAG Service.
Usecase2: Customer Service AI chatbot
For a Customer Service AI chatbot use case where Latency is critical; requiring Low Latency with first response in under a second, TTFT <3s, then the RAG service can support 20 Peak Users or 20 Concurrent Requests.
To support Peak Users or Concurrent Requests CR=40, with the same Latency constraint TTFT <3s, double the RAG Scale to 2X assuming linear scaling for the RAG Service.
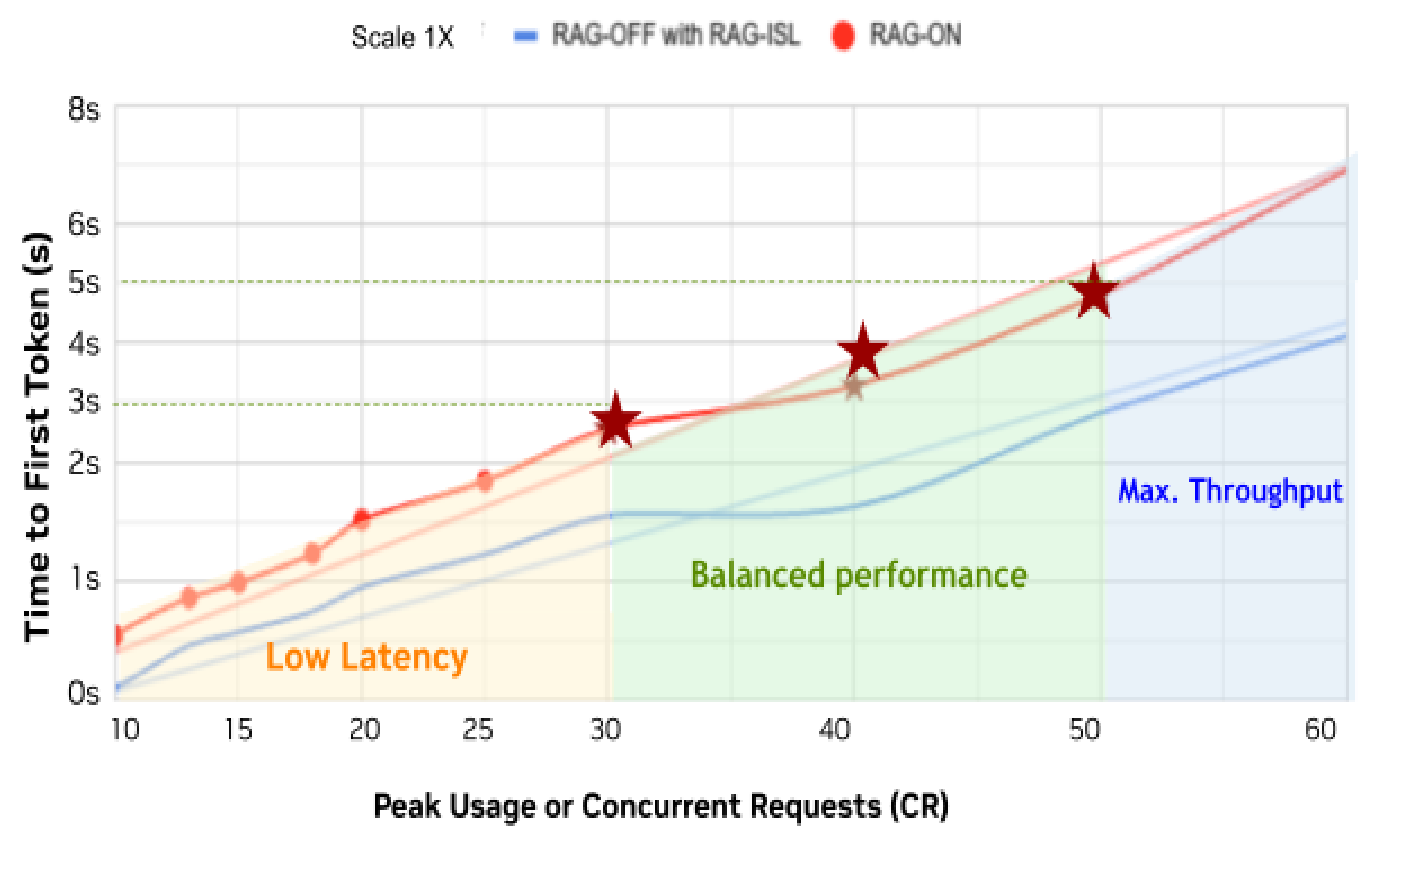
Figure 20 RAG Scale 1X - TTFT Latency with Latency Constraint Buckets (Low Latency, Balanced Performance, Max. Throughput)#
RAG Scaling Efficiency#
With linear scaling, the RAG pipeline performance needs to scale as the pipeline elements (LLM and others) are scaled out. For example RAG Scale 2X implies the performance in terms of throughput and concurrency should double for the same latency TTFT constraints.
To efficiently scale the RAG pipeline, design a scaling formula for scaling each RAG pipeline retrieval service (LLM, reranker, embedding, vector DB search/query) to ensure close to linear scaling with scaling efficiency >80%.
Formula: Scaling Efficiency E (%) > 80%
where:
Baseline (B) is RAG Scale 1X Throughput
Target (T) is the RAG Target Scale Throughput
SpeedUp (S) is the expected speed up for RAG linear scale
Example for calculating Efficiency(%) for RAG Chat (128/128) at Scale 10X:
Example RAG Chat (128/128) Scale 10X with Scaling Efficiency (%) linear vs non-linear:
Chat Scale (128/128) |
Concurrent Requests (CR) |
Latency SLA |
Throughput requests per second |
Scaling Efficiency (%) |
|---|---|---|---|---|
Chat 1X |
CR ≤ 50 |
TTFT ≤ 2s |
4.51 RPS |
NA |
Chat 10X |
CR ≤ 100 |
TTFT ≤ 2s |
40.5 RPS |
89.8% ✔ |
Chat 10X |
CR ≤ 100 |
TTFT ≤ 2s |
35.1 RPS |
77.82% ✖ |
Latency bottlenecks with metrics and tracing#
Enable tracing and observability metrics to gauge RAG pipeline service latencies and find bottlenecks. Enable tracing with Open Telemetry collector and visualization tools like Jaeger for RAG server, Ingestor server, NeMo Retriever Extraction, Milvus and NIM microservices.
Scale out bottlenecks first and then scale out other services based on latency threshold to achieve near linear scaling.
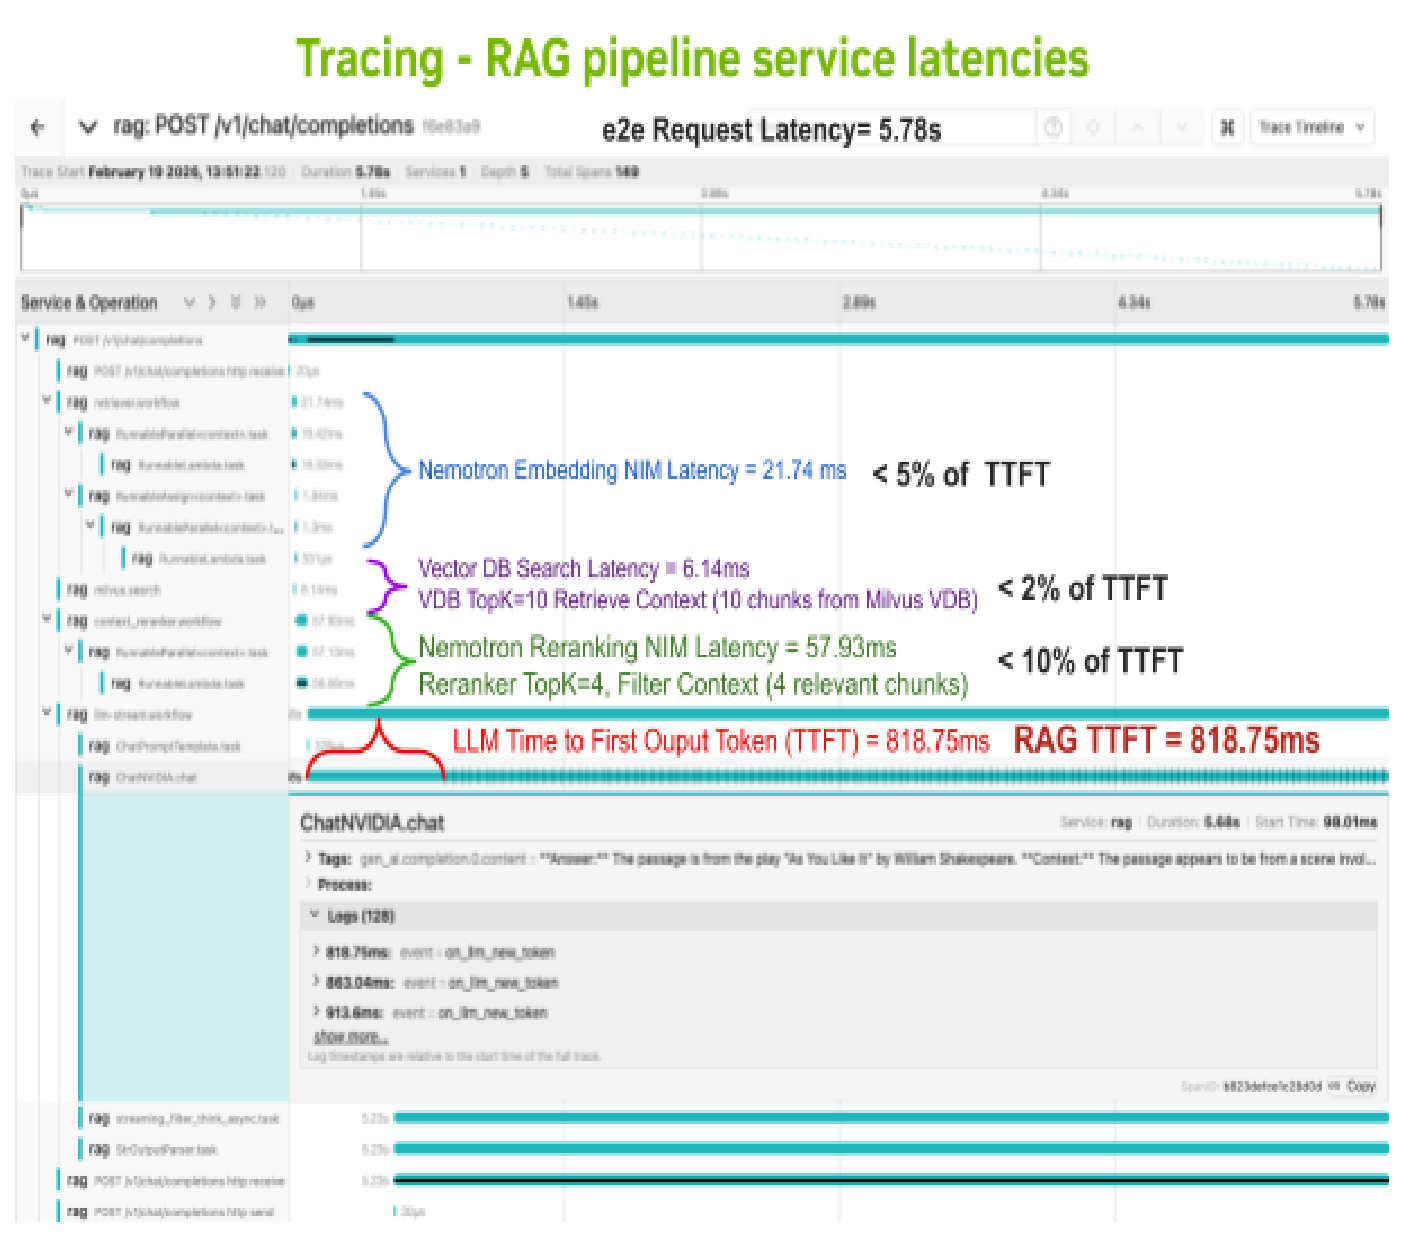
Figure 21 Tracing - RAG Pipeline Service Latencies#
From tracing observations, the Latency overhead for each component is shown below. The Latency overhead for Reranking, Embedding, Vector DB increases as concurrency increases and needs to be scaled out at some point to avoid impacting RAG TTFT significantly.
RAG service |
Latency range |
Latency threshold |
|---|---|---|
LLM |
70% - 90% of TTFT |
>80% of TTFT |
Reranking Latency |
5% - 20% of TTFT |
< 10% of TTFT |
Embedding Latency |
3% - 12% of TTFT |
< 5% of TTFT |
VDB Latency |
1% - 5% of TTFT |
< 2% of TTFT |
Table 18. RAG service Latency range and thresholds
To prevent Reranking, Embedding NIM and Milvus Vector DB (Query nodes) from becoming bottlenecks, maintain LLM Latency at 80% of TTFT or higher:
scale Reranking NIM if latency exceeds 10% of TTFT
scale Embedding NIM if latency exceeds 5% of TTFT
scale Milvus Query nodes if latency exceeds 2% of TTFT
RAG Linear scaling ratios and Latency thresholds#
The RAG retrieval pipeline adds overhead from the rag-server (langchain orchestrator), embedding (user query ISL + system prompt), vector DB search (adds context), reranker context filtering before hitting the LLM with bloated RAG ISL (user query + system prompt + vector DB filtered context).
The main contributor to the RAG First Output Token Latency (TTFT) is the LLM Prefill Latency (~80%) to process the RAG ISL. The other services Reranking NIM (~10%), Embedding NIM (~5%), Vector DB search (< 2%) and rag-server (< 2%) account for less <20% of the RAG TTFT.
For example, to scale RAG pipeline for Chat (128/128) use case from baseline Scale 1X with Concurrent Requests CR=20 for Low Latency SLA of TTFT p90 ≤ 3s:
first scale the LLM to 2X and then scale other services if needed
benchmark at 2X Concurrency; double Concurrent Requests from say 20 to 40 and measure TTFT;
Verify linear scaling; the output throughput (TPS) and Request rate (RPS) have doubled while maintaining latency SLA TTFT p90 ≤ 3s at 80% scaling efficiency
Note
If linear scaling is not achieved at 80% scaling efficiency, then other RAG pipeline services (reranking NIM, RAG server) may need to be scaled out in addition to LLM. Review NIM metrics (GPU utilization, queue depth) and tracing data to find latency bottlenecks.
To linearly scale the RAG pipeline with scaling efficiency >80%, first scale out NIM LLM followed by the RAG server, reranking NIM, embedding NIM and Vector DB search (Milvus Query nodes) when their latency exceeds the thresholds shown in table below.
Example RAG services scaling ratio for Chat (128/128) TopK 10/4:
RAG service |
Latency Threshold |
Linear Scale Ratio |
Scaling Recommendation |
|---|---|---|---|
NIM LLM |
> 80% of RAG TTFT |
1:1 (LLM:RAG) |
LLM Prefill latency varies; 70% - 90% of RAG TTFT. LLM Prefill Latency for RAG ISL is the main contributor to RAG First Output Token Latency (TTFT). When scaling LLM, requests are unevenly distributed across LLM instances due to Kubernetes load balancing and batching, causing increase in inter-token latency and E2E request latency. |
Nemotron Reranking NIM |
< 10% of RAG TTFT |
1:8 (Rerank: RAG). Summarization 1:4 |
Reranker latency varies; 10% - 25% of overall RAG TTFT. For linear scaling, ensure Reranker is <10% of RAG TTFT. For Summarization (1024/512) use cases, when ISL is larger 1024 vs 128 (Chat) and top-k is increased to 20/10 vs 10/4 (Chat); use a higher scaling ratio of 1:4. The higher ISL and top-k 20/10 results in higher load on the reranker with more request queueing, hence reranker needs to scale out earlier. |
Nemotron Embedding NIM |
< 5% of RAG TTFT |
1:40 (Embed:RAG) |
Embedding latency varies; 3% - 9% of RAG TTFT. For linear scaling, ensure Embedding is < 5% of RAG TTFT. For Embedding NIM, Chat (128/128) has highest request rate and Summarization (1024/512) has high ISL that impact scaling. |
Vector DB Search with CPU |
< 2% of RAG TTFT |
VDB Scale: Small VDB <10M vectors 1:1M (Vector DB Search: Vector embeddings). Medium VDB <40M vectors 1:4M. Large VDB <100M vectors 1:10M. Query Rate 1:16 (Chat) (Vector DB Search: RAG) up to 5 collections |
Vector DB search latency varies 1% - 5% of RAG TTFT. Milvus vector DB uses GPU for Data/Index nodes (CAGRA cuVS) and CPU for Query/Search nodes. Vector DB search (Milvus Query nodes) need to be scaled out when loading large vector DB collections (>1M vectors) and when bombarded with high query rate (>200 QPS queries per second). Scale with Vector DB Size: Scale Vector DB Query nodes with vector DB size in order to hold collection indexes in CPU memory (RAM) to reduce load latency. For Small VDB <10M vectors - scale 1 Query node (8vCPU, 10GiB) per 1M vectors; 1M vector size = ~10 GiB [1M embeddings X 2048 dim X 4B(FP32) + 20% metadata-overhead]. For Medium VDB <40M vectors - scale 1 Query node (16vCPU, 40GiB) per 4M vectors. For Large VDB <100M vectors - scale 1 Query node (32vCPU, 100GiB) per 10M vectors. Scale with High Query Rate: Scale Vector DB Search/Query nodes when receiving sustained high query rate. Chat (128/128) use cases querying multiple data sources with high concurrency (CR >1000) can result in high VDB query rates (>200 QPS). Chat (128/128) at Scale 16X, Concurrency CR=1280 (CR per LLM ~80 per LLM), request throughput=50 RPS; and querying 5 data sources; then Vector DB query rate=250 which exceeds >200 QPS; need to scale out the Query nodes. |
RAG server (16 vCPU, 64 GiB, 64 workers) |
< 2% of RAG TTFT |
1:8 (RAG server: RAG). Generation 1:4 |
RAG server latency is negligible <2% of TTFT. For benchmarking at scale allocate sufficient resources for high concurrency CR > 100. Allocate 16 vCPU, 64 GiB RAM with 64 worker threads. For Generation (128/2048) with longer OSL=2048 vs 128 (Chat), E2E request duration takes minutes. Set Scale ratio 1:4. It is recommended to scale out the RAG server to share the load and run on multiple nodes in the cluster. |
Table 5. RAG Chat Retrieval service latency with linear scaling ratio
RAG Linear Scaling Methodology#
The NIM LLM is the main component affecting performance. Scale LLM along with other services (RAG server, Reranking NIM, Embedding NIM, Milvus Query Node) based on the Linear scaling ratios defined above and summarized in the table below.
RAG Linear Scaling Ratio summary table#
RAG service |
Latency Threshold |
Linear Scale Ratio |
|---|---|---|
NIM LLM |
> 80% of RAG TTFT |
1:1 (LLM:RAG) |
Nemotron Reranking NIM |
< 10% of RAG TTFT |
1:8 (Rerank: RAG). Summarization 1:4 |
Nemotron Embedding NIM |
< 5% of RAG TTFT |
1:40 (Embed:RAG) |
Vector DB Search with CPU (Scale Milvus Small VDB <10M vectors Query node (8 vCPU, 10 GiB); Medium VDB <40M vectors Query node (16 vCPU, 40 GiB); Large VDB <100M vectors Query node (32 vCPU, 100 GiB)) |
< 2% of RAG TTFT |
VDB Scale: Small VDB <10M vectors 1:1M (Vector DB Search: Vector embeddings). Medium VDB < 40M vectors 1:4M. Large VDB <100M vectors 1:10M. Query Rate 1:16 (Chat) (Vector DB Search: RAG) up to 5 collections |
RAG server (16 vCPU, 64 GiB, 64 workers) |
< 2% of RAG TTFT |
1:8 (RAG server: RAG). Generation 1:4 |
The table below provides the RAG scale out configuration for Scale 1X - 96X using the linear scaling ratios summarized in the table above.
RAG Scaling Table Scale 1X to 96X#
RAG Scale |
LLM Scale |
RAG server |
Reranker Scale |
Embed Scale |
Milvus Scale |
GPUs |
Nodes |
|---|---|---|---|---|---|---|---|
Scale 1X |
1X GPU:1 |
1X |
1X GPU: 1 |
1X GPU: 0.5 |
Query 2X, Data 1X GPU: 0.25 Index only |
GPUs: 2.75 |
Nodes: 1 |
Scale 2X |
2X GPU: 2 |
1X |
1X GPU:1 |
1X GPU:0.5 |
Query 2X, Data 1X GPU:0.25 |
GPUs: 3.75 |
Nodes: 1 |
Scale 4X |
4X GPU: 4 |
1X |
1X GPU:1 |
1X GPU:0.5 |
Query 2X, Data 1X GPU:0.25 |
GPUs: 5.75 |
Nodes: 1 |
Scale 8X |
8X GPU: 8 |
1X |
1X GPU:1 |
1X GPU:0.5 |
Query 2X, Data 1X GPU:0.25 |
GPUs: 9.75, Summarization GPU: 10.75 |
Nodes: 2 |
Scale 10X |
10X GPU: 10 |
2X |
2X GPU:2, Sum: 3X GPU:3 |
1X GPU:0.5 |
Query 2X, Data 1X GPU:0.25 |
GPUs: 12.75, Sum GPUs: 13.75 |
Nodes: 2 |
Scale 16X |
16X GPU: 16 |
2X Gen: 4X |
2X GPU:2, Sum: 4X GPU:4 |
1X GPU:0.5 |
Query 2X, Data 1X GPU:0.25 |
GPUs: 18.75, Sum GPUs: 20.75 |
Nodes: 3 |
Scale 20X |
20X GPU: 20 |
3X Gen: 5X |
3X GPU:3, Sum: 5X GPU:5 |
1X GPU:0.5 |
Query 2X, Data 1X GPU:0.25 |
GPUs: 23.75, Nodes: 3; Summarization GPUs: 25.75 |
Nodes: 4 |
Scale 32X |
32X GPU: 32 |
4X Gen: 8X |
4X GPU:4, Sum: 8X GPU:8 |
1X GPU:0.5 |
Query 2X, Data 1X GPU:0.25 |
GPUs: 36.75, Nodes: 5; Summarization GPUs: 40.75 |
Nodes: 6 |
Scale 64X |
64X GPU: 64 |
8X Gen:16X |
8X GPU:8, Sum: 16X GPU:16 |
2X GPU:1 |
Query 4X, Data 1X GPU:0.25 |
GPUs: 73.25, Nodes: 10; Summarization GPUs: 81.25 |
Nodes: 11 |
Scale 96X |
96X GPU: 96 |
12X Gen:24X |
12X GPU:12, Sum: 24X GPU:24 |
2X GPU:1 |
Query 6X, Data 1X GPU:0.25 |
GPUs: 109.25, Nodes: 14; Summarization GPUs: 121.25 |
Nodes: 16 |
Table 19. RAG Benchmarking Test cases
RAG Linear Scaling Example#
Consider the scaling RAG pipeline from 1X to 10X for Chat (128/128) use case with Low Latency SLA TTFT ≤ 3s:
Vector DB (Milvus) ingestion is complete and collection size is 8M vectors
Baseline RAG Scale 1X requires 2.75 GPUs:
1 GPU for NIM LLM - Nemotron-Super-49B-v1.5, H200 NVL(fp8) or RTX PRO 6000 (nvfp4), tp1, vLLM engine
0.5 GPU (Run:ai or MIG) for Nemotron Embedding NIM
1 GPU for Nemotron Reranking NIM
0.25 (25%) GPU (Run:ai or MIG) for Vector DB(Milvus) Data node cuVS GPU accelerated index using GPU-CAGRA, 1 Query node (CPU search) [16 vCPU, 40GiB]
The baseline RAG scale 1X for Chat (128/128) @ TTFT p90 ≤ 3s; supports Concurrency CR=20
To scale RAG to 10X for Chat (128/128) with linear scaling formula:
First scale out LLM to 10X (10 GPUs)
Scale out Nemotron Rerank NIM to 2X (2 GPUs); linear scaling requires 1:8 scale ratio for Chat
Scale out RAG server to 2X (1:4 scale ratio for Chat)
Verify linear scaling; the output throughput (TPS) and Request rate (RPS) should have increased by ~10X while maintaining latency SLA TTFT p90 ≤ 3s at 80% scaling efficiency
Note
Throughput has increased by 10X for the same latency SLA but GPU increased by 3.5X from 4 to 14; providing better performance per GPU and per $ (Cost).
Performance per $ (Cost) increases exponentially as RAG is scaled from 1X to 10X to 20X. The Total Cost of Ownership (TCO) of the Enterprise RAG solution improves as the solution scales to handle more users.
Usecase |
Latency SLA |
Concurrent Requests(CR) |
RAG LLM Scale |
RAG server |
Milvus Vector DB |
Reranker Scale 1:8 |
Total GPUs |
|---|---|---|---|---|---|---|---|
Chat 128/128, TTFT ≤ 3s, Data: 4M vectors (~40GB with 2048 dim. X FP32) |
- |
20 |
Scale 1X |
RAG server 1X |
1 Data, 1 Query |
Scale 1X |
2.75 |
40 |
Scale 2X |
RAG server 1X |
1 Data, 1 Query |
Scale 1X |
3.75 |
||
80 |
Scale 4X |
RAG server 1X |
1 Data, 1 Query |
Scale 1X |
4.75 |
||
200 |
Scale 10X |
RAG server 2X |
1 Data, 1 Query |
Scale 2X |
6.75 |
||
400 |
Scale 20X |
RAG server 3X |
1 Data, 1 Query |
Scale 3X |
8.75 |
Table 5. RAG Chat 128/128 use case with linear scaling