Jetson Thor Product Family#
This topic describes power and performance management features of the NVIDIA® Jetson™ Thor™ product family. It describes the power, thermal, and electrical management features visible to software, as well as some tools and related techniques.
NVIDIA Jetson Board Support Packages (BSP) provide many features related to power management, thermal management, and electrical management. These features deliver the best user experience possible given the constraints of a particular platform. They help to create an optimum user experience:
Uniformly high performance
Excellent battery life
Perfect stability
Cool operation (the device is comfortable to touch)
Interacting Features#
Power, thermal, and electrical management features place dynamic constraints on many operational settings (“knobs”), such as:
Clock gate settings
Clock frequencies
Power gate (or regulator enable) settings
Voltages
Processor power state (i.e., which idle state is selected for the CPU)
Peripheral power state (i.e., which idle state is selected for an I/O controller)
Chipset power state
Availability of CPU cores to the OS
Some of these knobs are constrained by more than one feature. For example, cpufreq implements load-based scaling, which adjusts the CPU frequency according to how busy the CPU is. CPU thermal management, however, can override the target frequency of cpufreq. Consequently, before you attempt to debug power, performance, thermal, or electrical problems, you must familiarize yourself with all of the power, thermal, and electrical management features in BSP.
Kernel Space Power Saving Features#
This section describes BSP features that save power and extend battery life. Many of these features are implemented by the Linux kernel, with support from firmware and hardware, and without significant involvement from the user space.
Chipset Power States#
The supported power states are listed in order of increasing flexibility or configurability:
Off: There is only one way for a system to be off.
Deep Sleep (SC7) offers a small amount of configurability. For example, before entering Deep Sleep, the software can select which hardware wake events can wake the chip from Deep Sleep.
Active state is extraordinarily flexible in terms of power and performance. It encompasses activity levels from low-power audio playback through peak performance. Power consumption in the Active state can range from tens of milliwatts to several watts.
Supported Power States#
The supported power states are:
Power State |
Characteristics |
|
|---|---|---|
Off |
Power rails: None of the power rails supplying the SoC and DRAM are powered. State: No state is maintained in the SoC or DRAM. Exiting: Into Active state via cold boot. |
|
Deep Sleep (SC7) |
Power rails: State: The SoC maintains a small amount of state information in the PMC block. DRAM maintains the state. Exiting: Into Active state via a predefined set of wake events. |
|
Active |
Power rails: State: Software actively manages the power states of the devices that make up the SoC. Exiting: Software can initiate a transition from Active to any other power state. |
|
Power State Mapping to Linux#
BSP maps chipset power states to Linux power states as follows.
Chipset power state |
Linux power state |
Comments |
|---|---|---|
Off |
Off |
— |
Deep Sleep (SC7) |
Suspend to RAM |
The software can choose whether to enter Deep Sleep before the OS enters Suspend. |
Active |
Running/Idle (display on or off) |
Many SoC devices may be idle or
disabled under driver control.
For example, |
Deep Sleep (SC7)#
If the systemd init system is being used, you can initiate deep sleep from the user space with the following command:
$ sudo systemctl suspend
You can also use the following command:
$ sudo bash -c "echo mem > /sys/power/state"
The first method of entering deep sleep is preferred because it cooperates better with systemd, which maintains the Linux runlevel. If your system is not running systemd, use the second method.
The system can be awakened from deep sleep by common wake sources available on Jetson platforms:
Wake source |
Usage |
|---|---|
Power button |
Press and release the power button on the Jetson device. If the power button is not available, connect and disconnect the power button pin and ground. |
RTC alarm |
Before entering low power state, program the RTC alarm with the following command: $ sudo bash -c "echo +10 > /sys/class/rtc/rtc<x>/wakealarm"
where $ find /sys/class/rtc/* -maxdepth 0 -printf "%f:" -exec bash -c \
"cat {}/hctosys" \; | grep :1 | cut -d: -f1 | head -n1
|
USB type-C cable hotplug |
To flash the device, connect or disconnect a USB cable to the USB type-C port. |
USB IO hotplug and USB remote wakeup |
Before entering SC7 state, enable the wakeup functionality for USB devices: $ echo enabled | sudo tee /sys/bus/usb/devices/<usb_device>/power/wakeup
In this command, To wake up the device, plug in or unplug any USB I/O connected to a Type-A port or press any key on the keyboard to wake up the device. |
Wake on LAN |
Before entering SC7 state, enable Wake on LAN on the Ethernet port: $ ethtool -s <interface> wol g
On another machine on the same LAN, enter the following: $ sudo etherwake -i <interface> <MAC_address_of_target>
|
General Clock Management#
Clocks are managed by the BPMP on Tegra SoCs. You can manage the clocks in two ways:
Use the common clock framework (CCF) APIs provided by the kernel.
Use the BPMP clock debugfs interface.
Common Clock Framework#
The BPMP clock provider driver in the kernel implements the common clock framework (CCF) APIs. When kernel drivers use APIs (such as clk_set_rate and clk_get_rate) provided by the common clock framework (CCF) to manage the clocks, the BPMP clock provider driver translates those requests into MRQ calls to the BPMP, and the BPMP performs the actual clock configuration.
To set the clock rate to a specific value, use the clk_set_rate API.
To get the clock rate of a specific clock, use the clk_get_rate API.
Typically, the first argument of CCF APIs is the clock handler of type struct clk *. To get the clock handler, define the clock properties in the device tree and get the clock handler in the kernel via the devm_clk_get API.
The following example shows how to define the clock properties in the device tree with VIC hardware:
vic@8188050000 {
    clocks = <&bpmp TEGRA264_CLK_VIC>;
    clock-names = "vic";
};
The following example shows how to get the clock handler in the kernel driver:
struct clk *clk = devm_clk_get(dev, "vic");
BPMP Clock DebugFS#
BPMP clock debugfs provides the low-level management interface to the clocks. However, use it only for debugging; it is not intended for production software.
To get an overview of the BPMP clock topology, you can dump the clock tree using the following command:
$ cat /sys/kernel/debug/bpmp/debug/clk/clk_tree
The following is example output from the clk_tree command:
clock                                                 on       rate bpmp  mrq vdd
---------------------------------------------------------------------------------
clk_m                                                  1   19200000   11    1
    actmon                                             1   19200000    2    1 vdd_core@625000
    tach0                                              1    1010526    1    1 vdd_core@625000
clock: Clock name. Indentation shows the clock hierarchy.on: Clock state.rate: Clock rate in Hertz.bpmp: Reference count of the clock in BPMP.mrq: Reference count of the clock outside BPMP.vdd: Voltage domain of the clock and the requested voltage of the clock running at the current rate.
To get the minimum and maximum clock rates of a specific clock, you can read the min_rate and max_rate attributes:
$ cat /sys/kernel/debug/bpmp/debug/clk/<clock_name>/min_rate
$ cat /sys/kernel/debug/bpmp/debug/clk/<clock_name>/max_rate
To lock the clock rate to a specific value, you must first disable the MRQ interface of that clock:
$ echo 1 > /sys/kernel/debug/bpmp/debug/clk/<clock_name>/mrq_rate_locked
Then you can write the desired clock rate to the rate attribute:
$ echo <rate> > /sys/kernel/debug/bpmp/debug/clk/<clock_name>/rate
To unlock the clock rate, you must re-enable the MRQ interface of that clock:
$ echo 0 > /sys/kernel/debug/bpmp/debug/clk/<clock_name>/mrq_rate_locked
To get the HW clock rate of a specific clock, you can read the pto_counter attribute:
$ cat /sys/kernel/debug/bpmp/debug/clk/<clock_name>/pto_counter
The pto_counter attribute shows the real clock rate measured by the hardware. The value of pto_counter will be very close to the value read from the rate attribute, which is the software requested clock rate.
General Regulator Management#
Regulators are managed by the BPMP on Tegra SoCs. BPMP abstracts the complexity of voltage scaling and regulator control from the kernel drivers. Kernel drivers do not have direct access to regulators; some operations are automatically handled by the BPMP.
For example, when the kernel driver scales the clock rate of a specific clock, the BPMP automatically scales up or down the regulator output voltage to facilitate the change to the new clock rate. When kernel decides to power off a specific power domain, the BPMP can turn off the regulator to save power.
Four voltage domains come from two VRS11 switching regulators on Jetson Thor: VDD_CPU, VDD_GPU, VDD_MSS, and VDD_SOC.
To get the current output voltage of a specific voltage domain, you can read the voltage attribute:
$ cat /sys/kernel/debug/bpmp/debug/regulator/<voltage_domain_name>/voltage
To get the minimum and maximum output voltage of a specific voltage domain, you can read the min_uv and max_uv attributes:
$ cat /sys/kernel/debug/bpmp/debug/regulator/<voltage_domain_name>/min_uv
$ cat /sys/kernel/debug/bpmp/debug/regulator/<voltage_domain_name>/max_uv
To lock the voltage level of a specific voltage domain, write the desired voltage level to the override attribute:
$ echo <voltage> > /sys/kernel/debug/bpmp/debug/regulator/<voltage_domain_name>/override
To unlock the voltage level of a specific voltage domain, write 0 to the override attribute:
$ echo 0 > /sys/kernel/debug/bpmp/debug/regulator/<voltage_domain_name>/override
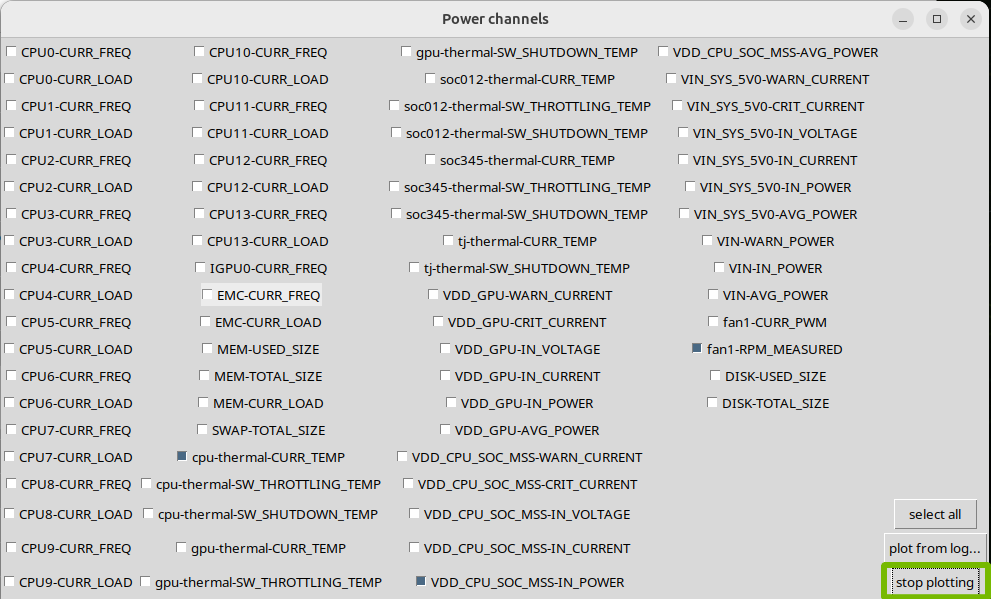
System Power Measurement#
Jetson Thor integrates a three-channel INA3221 power monitor on the module and a one-channel INA238 power monitor on the carrier board. These two sensors are exposed under the Linux hwmon subsystem in following paths:
INA3221:
/sys/bus/i2c/devices/2-0040/hwmon/hwmon*/INA238:
/sys/bus/i2c/devices/2-0044/hwmon/hwmon*/
Note
For a list of the exposed sysfs nodes for each power monitor, see the following:
The following table describes the power channels monitored by INA3221:
Channel Name |
Description |
|---|---|
Channel 1: VDD_GPU |
Power consumed by GPU. |
Channel 2: VDD_CPU_SOC_MSS |
Power consumed by CPU, engines in SOC power domain, and engines in MSS power domain. |
Channel 3: VIN_SYS_5V0 |
Power consumed by system 5V rail, which supplies various I/O devices. |
The following table describes the power channels monitored by INA238:
Channel Name |
Description |
|---|---|
Channel 1: VIN |
Power consumed by overall system, including module power and carrier board power. |
To get the measured power number in time-series fashion, run the tegrastats utility:
$ sudo tegrastats
System Power Capping#
To protect both chip and board from damage, the INA3221 and INA238 power monitors can prevent power consumption from exceeding the Thermal Design Power (TDP) budget of the system.
Whenever the instantaneous or average current exceeds the configured OC limit, the module performs hardware-based clock throttling to the CPU and GPU.
The following table shows TDP budgets and OC limits for various Jetson Thor modules.
Module |
Module TDP Budget |
Limits |
NVTHERM_OC PIN |
Throttling Level |
|---|---|---|---|---|
Jetson AGX Thor Developer Kit |
130 watts |
Average VDD_GPU power: 100 watts |
OC3 |
|
Instantaneous VDD_GPU power: 120 watts |
OC3 |
|
||
Instantaneous (VDD_GPU + VDD_CPU_SOC_MSS) power: 144 watts |
OC3 |
|
||
Average VIN power: 168 watts |
OC2 |
|
Caution
The INA3221 or INA238 driver might expose additional nodes. Avoid relaxing the current or power limit values in sysfs in an attempt to bypass hardware-based clock throttling. Modifying these limits does not ensure maximum performance and can cause permanent device damage. Instead, use more conservative settings to align with cooling and power management requirements.
Note
The included power adapter (ADP-240LB) can deliver up to 140 W (28 V × 5 A). To prevent excessive current draw, it features built-in overcurrent protection (OCP). When OCP is triggered, the adapter immediately cuts power to the device. To avoid tripping the adapter’s OCP, a 168 W limit is enforced on the Jetson AGX Thor Developer Kit. Users must ensure that the device’s power consumption does not exceed the power adapter’s rated capacity.
Overcurrent Event Status#
Three OC pins/events are available in the Jetson Thor series.
To determine which OC event is enabled, use the following sysfs nodes:
$ grep "" /sys/class/hwmon/hwmon*/oc*_throt_en
Use the following sysfs nodes to learn the number of OC events that occurred:
$ grep "" /sys/class/hwmon/hwmon*/oc*_event_cnt
CPU Power Management#
Jetson Thor provides three main features for CPU power management:
CPU dynamic frequency scaling
CPU hotplug power management
CPU idle power management
The following sections provide details about each of these features.
CPU Dynamic Frequency Scaling#
A Jetson Thor device contains 14 CPU clusters in 7 cluster pairs. CPU clusters in the same cluster pair share a clock unit so that they operate at the same frequency. The dynamic voltage and frequency scaling (DVFS) policy is enforced at the cluster-pair level rather than on individual CPU clusters.
By default, all cluster pairs use the schedutil cpufreq governor, which is a load-based frequency scaling policy. This governor reduces CPU frequency when the estimated CPU load against the CPU cluster is low.
Caution
With the real-time (RT) kernel, to meet the latency requirement, CPU DVFS is disabled by default.
To achieve maximum and consistent CPU performance, you can switch to the performance governor, which disables CPU DVFS and locks all CPU clusters at their maximum frequency:
$ echo performance > /sys/devices/system/cpu/cpufreq/policy<x>/scaling_governor
To check the current CPU frequency, you can read the cpuinfo_cur_freq node:
$ cat /sys/devices/system/cpu/cpufreq/policy<x>/cpuinfo_cur_freq
To check or update the maximum CPU frequency, use the scaling_max_freq node:
$ cat /sys/devices/system/cpu/cpufreq/policy<x>/scaling_max_freq
$ echo <KHz> > /sys/devices/system/cpu/cpufreq/policy<x>/scaling_max_freq
To check or update the minimum CPU frequency, use the scaling_min_freq node:
$ cat /sys/devices/system/cpu/cpufreq/policy<x>/scaling_min_freq
$ echo <KHz> > /sys/devices/system/cpu/cpufreq/policy<x>/scaling_min_freq
CPU Hotplug Power Management#
On a Jetson Thor device, each of the 14 clusters can be individually turned on or off during runtime to save CPU power.
To turn off a specific CPU cluster, write 0 to the online node in the cpu<x> directory:
$ echo 0 > /sys/devices/system/cpu/cpu<x>/online
To turn on a specific CPU cluster, write 1 to the online node in the cpu<x> directory:
$ echo 1 > /sys/devices/system/cpu/cpu<x>/online
CPU Idle Power Management#
Jetson Thor uses ARM CPU cores, and CPU idle management is supported in the Linux kernel through the upstream psci_idle driver.
For each core, an idle task is scheduled when no other runnable tasks are left in that CPU’s runqueue. This task puts the core into a low-power state selected by the cpuidle menu governor. The core stays in that state until an interrupt wakes it to process more work.
Idle States#
The following table summarizes the supported idle states that are available on Jetson Thor devices and the BSP software.
State |
Meaning |
|---|---|
WFI |
Core clock gating |
CC7 |
Cluster power gating |
Disable cpuidle Power Feature#
If you want to completely disable the cpuidle power feature, disable the cc7 idle state device-tree node:
idle-states {
      cc7 {
              entry-latency-us = <0x1388>;
              exit-latency-us = <0x1388>;
              state-name = "Cluster Powergate";
              arm,psci-suspend-param = <0x40000007>;
              compatible = "arm,idle-state";
              status = "disabled";
              phandle = <0x15f>;
              min-residency-us = <0x61a8>;
      };
};
If you want to disable specific idle state <y> on specific cluster <x> during runtime, write 1 into the disable sysfs node:
$ echo 1 > /sys/devices/system/cpu/cpu<x>/cpuidle/state<y>/disable
Statistics of Idle State Usage#
To get the number of times that cluster <x> has entered idle state <y>, read the usage node:
$ cat /sys/devices/system/cpu/cpu<x>/cpuidle/state<y>/usage
To get the total time in microseconds that cluster <x> has spent in idle state <y> since boot, read the time node:
$ cat /sys/devices/system/cpu/cpu<x>/cpuidle/state<y>/time
GPU Power Management#
GPU Low Power#
The GPU Rail-Gating low power feature allows the GPU power to be turned off when the GPU is idle.
Use the following command to determine whether the GPU Rail-Gating feature is enabled:
$ cat /proc/driver/nvidia/gpus/0000:01:00.0/power | grep "Rail-Gating"
When GPU Rail-Gating is engaged, it increases wake-up latency. If users are sensitive to wake-up latency, use the following command to disable GPU Rail-Gating:
$ echo on > /sys/bus/pci/devices/0000:01:00.0/power/control
If users are more sensitive to power consumption than to latency, use the following command to enable GPU Rail-Gating:
$ echo auto > /sys/bus/pci/devices/0000:01:00.0/power/control
GPU Dynamic Frequency Scaling#
The GPU has two main clock domains exposed through the Linux devfreq framework:
GPC: Controls performance of compute and graphics tasks.
NVD: Controls performance of multimedia tasks like video decode/encode, JPEG processing, and OFA.
These domains can be monitored and controlled through their respective sysfs interfaces:
GPC:
/sys/class/devfreq/gpu-gpc-0/NVD:
/sys/class/devfreq/gpu-nvd-0/
By default, both domains use dynamic frequency scaling with the nvhost_podgov governor, which automatically adjusts clock speeds based on GPU load. The governor’s behavior can be customized through parameters in the nvhost_podgov directory of each domain:
$ cd /sys/class/devfreq/gpu-gpc-0/nvhost_podgov
$ cd /sys/class/devfreq/gpu-nvd-0/nvhost_podgov
Caution
With the real-time (RT) kernel, to improve the latency, GPU DVFS is disabled because of the slow path of GPU load queries as part of the DVFS cycle.
Note that NVIDIA does not guarantee the functionality and performance of GPU kernel driver with the PREEMPT_RT kernel.
The following table lists the configurable parameters for the nvhost_podgov governor:
Parameter |
Description |
|---|---|
|
Load threshold at which the governor scales the clock to maximum frequency. |
|
Target load that the governor maintains for the engine. When the underlying load exceeds the target value, the governor scales up the clock rate to reduce the load. |
|
Load margin associated with the |
|
The moving-average weight factor for the average load calculation inside the governor. The average load of the device is calculated as follows:
|
|
Number of frequency steps for each up-scaling operation. |
|
Number of frequency steps for each down-scaling operation. |
For maximum performance, you can disable dynamic scaling by switching to the performance governor:
$ echo performance > /sys/class/devfreq/gpu-gpc-0/governor
$ echo performance > /sys/class/devfreq/gpu-nvd-0/governor
GPU Management Tool#
Use the following command to monitor the frequency and utilization of the GPU engines:
$ nvidia-smi dmon
The output contains the following information:
Column |
Description |
|---|---|
|
Index of GPU instance. |
|
Not supported for Jetson. |
|
Not supported for Jetson. |
|
Not supported for Jetson. |
|
Utilization of GPU GPC engine. |
|
Not supported for Jetson. |
|
Utilization of GPU Encoder engine. |
|
Utilization of GPU Decoder engine. |
|
Utilization of GPU JPG engine. |
|
Utilization of GPU OFA engine. |
|
Not supported for Jetson. |
|
Not supported for Jetson. |
GPU Persistence Mode#
The NVIDIA kernel mode driver must be running and connected to a target GPU device before any user interactions with that device can occur. After the driver is loaded, GPU initialization is triggered only when a GPU client attempts to access the GPU. When all GPU clients terminate, the driver deactivates the GPU.
Driver initialization behavior is important for end users in two ways:
Application start latency: Applications that trigger GPU initialization might incur a startup cost per GPU, which can be avoided if the GPU is already initialized.
Preservation of driver state: If the driver deactivates a GPU, some non-persistent state associated with that GPU is lost and reverts to defaults when the GPU is initialized next time.
Under Linux systems where X runs by default on the target GPU, the kernel mode driver is generally initialized and kept alive from machine startup to shutdown, courtesy of the X process. On headless systems or situations where no long-lived X-like client maintains a handle to the target GPU, the kernel mode driver initializes and deactivates the target GPU each time a target GPU application starts and stops. Because keeping the GPU initialized is often desirable in these cases, NVIDIA provides the Persistence Mode (Legacy) option to change the driver behavior.
Persistence Mode is the term for a user-settable driver property that keeps a target GPU initialized even when no clients are connected to it.
Persistence mode can be set using nvidia-smi.
To enable persistence mode using nvidia-smi (as root):
$ nvidia-smi -i <target gpu> -pm ENABLED
Enabled Legacy persistence mode for GPU <target gpu>
All done.
To disable persistence mode using nvidia-smi (as root):
$ nvidia-smi -i <target gpu> -pm DISABLED
Disabled persistence mode for GPU <target gpu>
All done.
To view current persistence mode using nvidia-smi:
$ nvidia-smi -i <target gpu> - q
==============NVSMI LOG==============

Timestamp                           : ----
Driver Version                      : ----

Attached GPUs                       : ----
GPU 0000:01:00.0
    Product Name                    : ----
    Display Mode                    : ----
    Display Active                  : ----
    Persistence Mode                : Enabled
    Accounting Mode                 : ----
    ...
To prevent the GPU from being initialized, you might also want to disable the GPU Rail-Gating feature, which powers off the whole GPU and introduces more wake-up latency. For more information, refer to GPU Low Power.
Memory Power Management#
NVIDIA SoC chipsets include power saving features whose operation is largely invisible to software at runtime. Most of those features are statically enabled at boot, according to settings in the boot configuration table (BCT).
Additionally, BSP implements Dynamic Voltage and frequency scaling for the memory controller (EMC/MC) and DRAM to save power. The EMC BCT and DVFS table are specific to the board design. The EMC DVFS table is included in the platform BPMP device tree file.
EMC Dynamic Frequency Scaling#
EMC dynamic frequency scaling (DFS) is realized in the BPMP firmware, and BPMP firmware considers two factors to determine the EMC frequency:
Memory bandwidth QoS requests from clients
Memory bandwidth utilization
The following sections describe these two factors in detail.
Memory Bandwidth QoS Requests From Clients#
To influence EMC frequency selection, clients like the GPU, PCIe, and display drivers can actively send two types of QoS requests to the BPMP firmware:
Average bandwidth request
Peak bandwidth request
For average bandwidth requests, BPMP firmware combines the requested bandwidth from clients and selects the EMC frequency point that can provide that much memory bandwidth.
For peak bandwidth requests, BPMP firmware chooses the greatest peak bandwidth request from all requested peak bandwidths and selects the EMC frequency point that can provide that much memory bandwidth.
The fundamental difference between these two types of requests is that the average bandwidth request considers the overall bandwidth requirements from all clients, but the peak bandwidth request considers only the maximum requested bandwidth at any point in time. The former is typically used for bandwidth-oriented devices, and the latter is typically used for latency-oriented devices.
To inspect the requests made by individual clients, examine the following debugfs node:
$ cat /sys/kernel/debug/bpmp/debug/bwmgr/bw_request_status
The output of the preceding node is similar to the following:
ID   |Niso BW     |Iso BW      |    Floor BW
0    |0           |0           |42598400
1    |0           |0           |0
2    |0           |0           |0
3    |0           |0           |0
4    |0           |0           |0
5    |0           |0           |0
6    |0           |0           |0
7    |0           |0           |0
8    |0           |0           |0
9    |0           |0           |0
10   |0           |0           |4723200
11   |0           |0           |0
12   |0           |0           |0
13   |0           |0           |0
14   |0           |0           |0
15   |161280000   |0           |0
16   |0           |0           |0
17   |0           |0           |0
18   |0           |0           |0
19   |0           |0           |0
20   |0           |0           |0
21   |0           |0           |0
22   |0           |0           |0
23   |0           |0           |0
24   |0           |0           |0
25   |173260800   |0           |0
26   |0           |0           |0
27   |0           |0           |0
28   |0           |0           |0
29   |0           |0           |0
30   |0           |0           |0
31   |0           |0           |0
32   |0           |0           |0
33   |0           |0           |0
34   |0           |0           |0
35   |0           |0           |0
36   |0           |0           |0
37   |0           |0           |0
38   |0           |0           |0
39   |0           |0           |0
40   |0           |0           |0
41   |0           |0           |0
42   |0           |0           |0
          Iso Rate Min (KHz) : 0
        Total Rate Min (KHz) : 4266000
         LA Rate Floor (KHz) : 0
  ISO Client Only Rate (KHz) : 0
         Max Floor BW (Kbps) : 42598400
The mapping of the ID column is as follows:
TEGRA264_BWMGR_ICC_PRIMARY |
1U |
TEGRA264_BWMGR_DEBUG |
2U |
TEGRA264_BWMGR_CPU_CLUSTER0 |
3U |
TEGRA264_BWMGR_CPU_CLUSTER1 |
4U |
TEGRA264_BWMGR_CPU_CLUSTER2 |
5U |
TEGRA264_BWMGR_CPU_CLUSTER3 |
6U |
TEGRA264_BWMGR_CPU_CLUSTER4 |
7U |
TEGRA264_BWMGR_CPU_CLUSTER5 |
8U |
TEGRA264_BWMGR_CPU_CLUSTER6 |
9U |
TEGRA264_BWMGR_CACTMON |
10U |
TEGRA264_BWMGR_DISPLAY |
11U |
TEGRA264_BWMGR_VI |
12U |
TEGRA264_BWMGR_APE |
13U |
TEGRA264_BWMGR_VIFAL |
14U |
TEGRA264_BWMGR_GPU |
15U |
TEGRA264_BWMGR_EQOS |
16U |
TEGRA264_BWMGR_PCIE_0 |
17U |
TEGRA264_BWMGR_PCIE_1 |
18U |
TEGRA264_BWMGR_PCIE_2 |
19U |
TEGRA264_BWMGR_PCIE_3 |
20U |
TEGRA264_BWMGR_PCIE_4 |
21U |
TEGRA264_BWMGR_PCIE_5 |
22U |
TEGRA264_BWMGR_SDMMC_1 |
23U |
TEGRA264_BWMGR_SDMMC_2 |
24U |
TEGRA264_BWMGR_NVDEC |
25U |
TEGRA264_BWMGR_NVENC |
26U |
TEGRA264_BWMGR_NVJPG_0 |
27U |
TEGRA264_BWMGR_NVJPG_1 |
28U |
TEGRA264_BWMGR_OFAA |
29U |
TEGRA264_BWMGR_XUSB_HOST |
30U |
TEGRA264_BWMGR_XUSB_DEV |
31U |
TEGRA264_BWMGR_TSEC |
32U |
TEGRA264_BWMGR_VIC |
33U |
TEGRA264_BWMGR_APEDMA |
34U |
TEGRA264_BWMGR_SE |
35U |
TEGRA264_BWMGR_ISP |
36U |
TEGRA264_BWMGR_HDA |
37U |
TEGRA264_BWMGR_VI2FAL |
38U |
TEGRA264_BWMGR_VI2 |
39U |
TEGRA264_BWMGR_RCE |
40U |
TEGRA264_BWMGR_PVA |
41U |
TEGRA264_BWMGR_NVPMODEL |
42U |
Given the type of each client, its average bandwidth request goes to either the Niso BW or the Iso BW column, and its peak bandwidth request goes to the Floor BW column.
Memory Bandwidth Utilization#
Information about system memory bandwidth utilization is provided by the central actmon hardware. BPMP firmware considers the current memory bandwidth utilization to determine whether the EMC frequency should be adjusted by scaling up or down. This process is referred to as central actmon DFS.
Internally, the BPMP compares the current memory bandwidth utilization against the boost-up threshold and the boost-down threshold. These threshold values are configured in the BPMP device tree file:
bwmgr {
        enabled = <0x1>;

        cactmon {
                enabled = <0x1>;

                mc_all {
                        # Skip...
                        boost_up_threshold = <0x1e>;    # 30%
                        boost_down_threshold = <0x14>;  # 20%
                        # Skip...
                };
        };
};
If current memory bandwidth usage exceeds 30%, the BPMP will scale up the EMC frequency, and if the memory bandwidth usage is lower than 20%, the BPMP will scale down the EMC frequency.
To disable the central actmon DFS on the BPMP side, change the cactmon-enabled property to 0:
bwmgr {
        enabled = <0x1>;

        cactmon {
                enabled = <0x0>;

                # Skip...
        };
};
To completely disable the EMC DFS, including central actmon DFS and ICC memory bandwidth management:
$ echo 1 > /sys/kernel/debug/bpmp/debug/bwmgr/bwmgr_halt
MSS Profile Manager for EMC Clock Mapping#
The EMC clock affects the throughput and latency of the path from memory controller to DRAM module. To adjust the speed of EMC so that the SoC can saturate the available memory bandwidth, a clock mapping table is maintained inside the BPMP device-tree blob file for the following three clocks in the MSS and SOC domains:
UCF_SCF clock
UCF_MSS clock
SMMU clock
To check the clock mapping table, first get the current profile ID from the following node:
$ cat /sys/kernel/debug/bpmp/debug/mssprofiles/current_profile
Note
The default profile ID is 1.
After you obtain the profile ID, you can go inside the profile directory to check the clock mapping table:
$ cd /sys/kernel/debug/bpmp/debug/mssprofiles/profile_<profile_id>
Then you can check the clock mapping table for all three clocks with the following command:
$ grep "" *_setpoint_*
The preceding command provides output similar to the following:
smmu_setpoint_1:400000000
smmu_setpoint_2:900000000
smmu_setpoint_3:900000000
smmu_setpoint_4:900000000
smmu_setpoint_5:900000000
smmu_setpoint_6:900000000
smmu_setpoint_7:900000000
smmu_setpoint_8:900000000
ucf_slc_setpoint_1:864000000
ucf_slc_setpoint_2:1845000000
ucf_slc_setpoint_3:1845000000
ucf_slc_setpoint_4:1845000000
ucf_slc_setpoint_5:1845000000
ucf_slc_setpoint_6:1845000000
ucf_slc_setpoint_7:1845000000
ucf_slc_setpoint_8:1845000000
ucf_soc_setpoint_1:765000000
ucf_soc_setpoint_2:1971000000
ucf_soc_setpoint_3:1971000000
ucf_soc_setpoint_4:1971000000
ucf_soc_setpoint_5:1971000000
ucf_soc_setpoint_6:1971000000
ucf_soc_setpoint_7:1971000000
ucf_soc_setpoint_8:1971000000
where:
ucf_slc_setpoint_x: stands for the UCF_SCF clockucf_soc_setpoint_x: stands for the UCF_MCF clocksmmu_setpoint_x: stands for the SMMU clockx: the index of the clock setpoint.
There are in total 4 EMC frequency points available on Jetson Thor. The mapping of EMC frequency to the setpoint index is as follows:
EMC Rate (KHz) |
Setpoint ID |
|---|---|
665600 |
1 |
2750000 |
6 |
3200000 |
7 |
4266000 |
8 |
For example, if EMC is running at 4,266,000 KHz, the setpoint ID is 8. Therefore, the UCF_SCF, UCF_MCF, and SMMU clocks are scaled to setpoint 8:
smmu_setpoint_8:900000000
ucf_slc_setpoint_8:1845000000
ucf_soc_setpoint_8:1971000000
To update the clock mapping table, you can update the mssprofmgr node within the BPMP device-tree blob file:
mssprofmgr {
    default-profile = <1>;
    profile@1 {
        profile-id = <1>;
        ucf-soc-mapping =  /bits/ 64 <
            765000000
            1971000000
            1971000000
            1971000000
            1971000000
            1971000000
            1971000000
            1971000000
        >;
        ucf-slc-mapping =  /bits/ 64 <
            864000000
            1845000000
            1845000000
            1845000000
            1845000000
            1845000000
            1845000000
            1845000000
        >;
        smmu-mapping =  /bits/ 64 <
            400000000
            900000000
            900000000
            900000000
            900000000
            900000000
            900000000
            900000000
        >;
    };
};
Multimedia Engine Power Management#
The Video Image Compositor (VIC) is used for common video-processing tasks like frame scaling, frame rotation, and pixel color space conversion.
The VIC has its own activity monitor (actmon) hardware used for monitoring its load, and this load information is used for load-based dynamic frequency scaling.
The VIC clock domain can be controlled through its sysfs interface:
/sys/class/devfreq/8188050000.vic
By default, VIC uses dynamic frequency scaling with the tegra_wmark governor, which automatically adjusts clock speeds based on VIC load. The governor’s behavior can be customized through parameters in the tegra_wmark directory:
$ cd /sys/class/devfreq/8188050000.vic/tegra_wmark
The following table lists the configurable parameters for the tegra_wmark governor:
Parameter |
Description |
|---|---|
|
Target load that the governor maintains for the engine. |
|
Load margin associated with the |
|
Load margin associated with the |
|
Number of frequency steps for each up-scaling operation. |
|
Number of frequency steps for each down-scaling operation. |
The tegra_wmark governor relies on the actmon hardware to periodically sample the load of the VIC engine. If needed, actmon triggers a DVFS cycle via interrupt.
To check the actmon settings for the VIC engine, go to the debugfs directory under tegra-host1x.0:
$ cd /sys/kernel/debug/tegra-host1x.0/actmon/vic
To check or update the sampling period (in microseconds) for the VIC engine, read from or write to the following node:
$ cat /sys/kernel/debug/tegra-host1x.0/actmon/vic/sample_period
$ echo <sample_period> > /sys/kernel/debug/tegra-host1x.0/actmon/vic/sample_period
To check the current load of the VIC engine, read from the following node:
$ cat /sys/kernel/debug/tegra-host1x.0/actmon/vic/module0/usage
In the background, the actmon hardware itself calculates the load as a moving average. The formula of the load calculation is as follows:
load_avg = (load_avg * (2**(k+1)) - 1) + load) / (2**(k+1))
The value of load_avg is the average load value, and load is the value sampled by the actmon in the current cycle. The k is a programmable variable that you can check or update through the following node:
$ cat /sys/kernel/debug/tegra-host1x.0/actmon/vic/module0/k
$ echo <k> > /sys/kernel/debug/tegra-host1x.0/actmon/vic/module0/k
For maximum performance, you can disable dynamic scaling by switching to the performance governor:
$ echo performance > /sys/class/devfreq/8188050000.vic/governor
USB Power Management#
Link Power Management#
USB specifications support link power management (LPM), which allows a USB device to save power when no transfer is required on the bus.
The link state definitions for USB 2 and USB 3 differ. In the USB 2 specification, the link states are L0 (on), L1 (sleep), L2 (suspend), and L3 (off). In the USB 3 specification, the link states are U0 (active), U1 (link idle, fast exit), U2 (link idle, slow exit), and U3 (link suspend).
Link States and Tegra#
The following table provides details on how the link states map to Tegra states.
USB 2 |
USB 3 |
State Transition |
Description |
|---|---|---|---|
L0 |
U0 |
n/a |
Normal operational state. All packet communication (control or data transfer) occurs in this state. |
Not defined |
U1 |
Hardware |
Standby state with low exit latency. The port can exit to U0 state in less than 10 μs. |
L1 |
U2 |
Hardware |
Standby state with low to medium exit latency. The port can exit to U0 state in less than 1 ms. |
L2 |
U3 |
Entry: software Exit: hardware or software |
Deep power-saving state. The formalized “USB suspend.” |
L3 |
Not defined |
n/a |
The port is not capable of performing any data signaling. |
Hardware Link Power Management#
On Tegra, the USB controller provides hardware link power management. The host can automatically put the device into a lower power state if the device is also capable of LPM. More precisely, the hardware can automatically switch the USB device to the U1 or U2 state.
Two attributes in /sys/bus/usb/devices/<device-id>/power/ control hardware LPM: usb3_hardware_lpm_u1 and usb3_hardware_lpm_u2.
When a USB 3 LPM-capable device is connected, it checks for U1 and U2 exit latencies in the BOS descriptor. If they are set, USB 3 hardware LPM is enabled for the device and these files are created. Each holds a string value (enable or disable) that indicates whether USB 3 hardware LPM is enabled for the device.
Autosuspend#
In Linux, the kernel can suspend (that is, change the link state to L2 or U3) an idle device by software. This action is called autosuspend.
The attributes to control autosuspend are under /sys/bus/usb/devices/<device-id>/power/:
wakeupThis file is empty if the device does not support remote wakeup. Otherwise the file contains either
enabledordisabled, indicating whether remote wakeup is enabled. You can write those words to the file.
controlThis file contains either
onorauto. You can write those values to the file to change the device’s setting. Set toonto disallow autosuspend. In other words, the device won’t be placed in a low-power state by software. Set toautoto allow the kernel to autosuspend and autoresume the device.
autosuspend_delay_msThis file contains an integer value, which is the number of milliseconds the device remains idle before the kernel can autosuspend it. The default is 2000. Set to 0 to autosuspend as soon as the device becomes idle. Negative values mean never to autosuspend. You can write a number to the file to change the autosuspend idle-delay time.
Caution
Many devices do not fully support USB link power management. For this reason, by default the kernel disables autosuspend (the power/control attribute is initialized to on) for all devices other than hubs.
Also note that the kernel does not prevent you from enabling autosuspend on devices that can’t handle it. In theory, you could damage a device by suspending it at the wrong time. (Highly unlikely, but possible.)
We recommend that you manually enable autosuspend and check for issues. If autosuspend works for a device, you can add udev rules. You can also change the idle-delay time because two seconds might not be the best choice for every device.
PCIe Power Management#
Active State Power Management#
Active State Power Management (ASPM) is a power-management mechanism for PCIe devices to garner power savings while otherwise in a fully active state. Predominantly, this is achieved through active-state link power management; that is, the PCI Express serial link is powered down when there is no traffic across it.
Although ASPM reduces power consumption, it can also result in increased latency because the serial bus must be “awakened” from low-power mode, possibly reconfigured, and the host-to-device link re-established. This condition is known as ASPM exit latency and takes up valuable time, which can be annoying to the end user. As a result, knowing the trade-off between performance and power regarding this mechanism can be critical.
When ASPM is enabled, the hardware can manage link state automatically without communication between host and device. Two low-power modes can be entered by ASPM: L0s and L1. L0s sets low-power mode for one direction of the serial link only, usually downstream of the PHY controller. L1 shuts off the PCI Express link completely, including the reference clock signal, until a dedicated signal (CLKREQ#) is asserted, and results in greater power reductions, although with the penalty of greater exit latency. L1 also has many substates to improve the granularity of the power/performance trade-off.
Configure the PCIe Controller#
Before you can enable ASPM on Jetson Thor for an endpoint device, you might need to configure the ASPM capability of the PCIe controller. Determine which controller corresponds to the device for ASPM and then add the aspm-capability attribute to ODMDATA before flashing. The following example applies to PCIe controller C2:
ODMDATA="pcie@2_status=okay_aspm-capability=14";
ASPM Control on Linux#
After you add ASPM support on the PCIe controller, the Linux kernel determines ASPM settings according to the parameter policy of the pcie_aspm driver. Read the /sys/module/pcie_aspm/parameters/policy node to determine the valid values to set on this parameter.
$ cat /sys/module/pcie_aspm/parameters/policy
[default] performance powersave powersupersave
On Jetson devices, ASPM has four policies to determine how the kernel controls ASPM.
defaultASPM enablement is set according to the defaults specified by the bootloader or firmware on the system.
performanceASPM is disabled for all devices. This policy prevents devices from entering a low-power state, which enhances performance.
powersaveEnable ASPM states L0s and L1 for power saving.
powersupersaveEnable ASPM states L0s and L1 and the L1 substates for power saving.
To change the policy at runtime, write the policy string to /sys/module/pcie_aspm/parameters/policy. If you want the policy to apply to every system boot, prepend pcie_aspm.policy= to the policy string (for example, pcie_aspm.policy=powersupersave) and add it to bootargs.
You can check the ASPM settings by using the lspci utility. The enablement of L0s and L1 states can be checked from the LnkCtl field, and the L1 substate can be checked from L1SubCtl1 field.
Exit Latency Restriction for ASPM#
In some cases, ASPM still gets disabled even if you configure the PCIe controller to support ASPM and set the powersupersave policy. One reason might be low-power state exit latency. In short, even with the powersupersave mode, the Linux pcie_aspm driver might prevent the device from enabling ASPM because of the high exit latency.
For example, if the PCIe controller on a Jetson Thor device is configured at Gen5 speed, high exit latency can prevent the PCIe endpoints that connect to the controller from enabling ASPM.
As a result, we strongly recommend that you set max-link-speed according to the maximum speed of the endpoint device. For example, if we know that the PCIe controller C2 is always connected to a Gen3 network interface card, we can configure the controller as follows:
ODMDATA="pcie@2_status=okay_aspm-capability=14_max-link-speed=3";
Runtime Power Management#
PCIe also supports software-based control for link power management. On the Linux kernel, this is designed through the runtime power management framework.
The interface to control PCIe runtime power management is under /sys/bus/pci/devices/<device-id>/power/: the control attribute. This file contains either on or auto. You can write those values to the file to change the device’s setting. Set to on to disallow autosuspend. In other words, the device won’t be placed in a low-power state by software. Set to auto to allow the kernel to autosuspend and autoresume the device.
The support for runtime power management of a PCIe device can be missing. In that case, setting control to auto has no effect.
UFS Power Management#
Hibernate is the deepest low-power link state for UFS. When no transmission occurs between the host and the UFS device, ultra power saving can be achieved with the state.
Auto-Hibernation#
Auto-hibernation is a feature that enables a UFS host controller to send the link to the hibernation state automatically.
For Jetson Thor with Linux, the interface to control auto-hibernation is under /sys/bus/platform/devices/a80b8d0000.ufshci/: the auto_hibern8 attribute. This file contains the auto-hibernate idle timer setting of a UFS host controller. A value of zero means that auto-hibernate is not enabled. A positive value specifies the number of microseconds of idle time before the UFS host controller autonomously puts the link into hibernate state. That state saves power at the expense of increased latency.
Software Hibernation#
Instead of controlling the link state by hardware, it is also possible to enter hibernation through software. On Linux, this is achieved by the runtime power management framework.
You must enable runtime power management for every SCSI LUN and the UFSHCD to enable the path for software hibernation.
# echo auto > /sys/bus/platform/devices/a80b8d0000.ufshci/power/control
# tee /sys/bus/scsi/devices/host0/target0\:0\:0/0\:0\:0\:*/power/autosuspend_delay_ms <<< 2000
# tee /sys/bus/scsi/devices/host0/target0\:0\:0/0\:0\:0\:*/power/control <<< auto
# echo auto > /sys/bus/platform/devices/a80b8d0000.ufshci/power/control
To verify whether software hibernation occurs, first ensure that the UFS device is idle. Then read /sys/bus/platform/devices/a80b8d0000.ufshci/power/runtime_status. If the device entered hibernation successfully, the value of the node is suspended.
NVMe Power Management#
Power States#
Power states represent various working states for an NVMe device. Each state corresponds to specific maximum power consumption, in/out conversion time, read/write latency, and other characteristics. The controller can support up to 32 power states, PS0 through PS31. The larger the number, the lower the power consumption.
You can obtain the controller data structure through the NVMe Identify command. In that structure, the power state descriptor data structure describes the characteristics of each power state that is supported by the controller. For example, information for nvme0n1 is similar to the following:
# sudo nvme id-ctrl /dev/nvme0n1 | grep "ps      0"  -A 2
ps      0 : mp:5.60W operational enlat:0 exlat:0 rrt:0 rrl:0
        rwt:0 rwl:0 idle_power:0.2200W active_power:5.60W
        active_power_workload:80K 128KiB SW
For more information, see “Identify – Power State Descriptor Data Structure” in the NVM Express Base Specification.
Autonomous Power State Transitions#
Some controllers support Autonomous Power State Transition (APST), which allows the controller to automatically switch power states to control temperature (thermal management) or power consumption.
By default, APST is enabled on Linux if it is supported.
# nvme get-feature /dev/nvme0n1 -f 0x0c -H | head -n 2
get-feature:0x0c (Autonomous Power State Transition), Current value:0x00000001
        Autonomous Power State Transition Enable (APSTE): Enabled
If you are looking for better performance, you can sacrifice power by setting nvme_core.default_ps_max_latency_us in bootargs. The value specifies the acceptable latency for power states to be enabled by the kernel. For example, set nvme_core.default_ps_max_latency_us=0 to keep the device in PS0, preventing any autonomous power state switch.
Thermal Throttle Management#
Some NVMe controllers support a mechanism for temperature management, which you can use as a basis for the controller to automatically switch between power states, or to provide temperature-management functions to the host to meet specific requirements.
For example, if the NVMe is used in a desktop or server with good heat dissipation, you might raise the upper limit of the temperature to maintain operating performance. If it is used in a laptop or mobile device, though, you need to keep the NVMe as cool as possible to protect the battery. You can use the NVMe thermal throttle interface to meet a range of usage requirements and user expectations.
From the Identify command, you can find the mntmt and mxtmt fields, which indicate the minimum and maximum temperatures (in degrees Kelvin) that trigger thermal management.
# nvme id-ctrl /dev/nvme0n1 | grep tmt
mntmt     : 273
mxtmt     : 360
The host can specify Thermal Management Temperature 1 (bits 15:0) and Thermal Management Temperature 2 (bits 31:16) in the Set Feature command with the feature identifier set to 10h. A value of 0h indicates that the controller does not report this field or that the host-controlled thermal management feature is not supported.
# nvme set-feature /dev/nvme0 -f 0x10 -V value
For more information, see “8.1.17.5 Host Controlled Thermal Management” in the NVM Express Base Specification.
Ethernet Power Management#
Energy-Efficient Ethernet#
Energy-Efficient Ethernet (EEE) is a set of enhancements to reduce power consumption during periods of low data activity. The intention is to reduce power consumption by at least half while retaining full compatibility with existing equipment.
When the controlling software or firmware decides that no data needs to be sent, it can issue a low-power idle (LPI) request to the Ethernet controller physical layer. The PHY then sends LPI symbols for a specified time onto the link and then disables its transmitter. Turning off the unused circuit reduces power consumption. Refresh signals are sent periodically to maintain link signaling integrity. When there is data to transmit, a normal IDLE signal is sent for a predetermined period of time. The data link is considered to be always operational because the receive signal circuit remains active even when the transmit path is in sleep mode.
You can enable or disable EEE by using the ethtool utility.
# ethtool --set-eee eth0 eee [on|off]
EEE settings for eth0:
        EEE status: eth0 - inactive
Note that EEE can be active only if both sides of the link support it. For example, if you connect a Tegra device to an RJ45 port, EEE can be inactive if the hub doesn’t support it.
You can check whether EEE is enabled and active by using ethtool --show-eee.
# ethtool --show-eee eth0
EEE settings for eth0:
        EEE status: eth0 - inactive
Display Power Management#
Display Power Management Signaling#
Display Power Management Signaling (DPMS) is a mechanism for power saving of video monitors. It is designed by the VESA consortium and defines the power management of horizontal synchronization (H-Sync) signals and vertical synchronization (V-Sync) signals. Three levels of power saving—Standby, Suspend and Off—are included for DPMS, and each can be configured with a time for inactivity before the monitor enters the given level.
The following table provides a brief overview of the differences between the states.
State |
H-Sync |
V-Sync |
Power Saving |
|---|---|---|---|
On |
On |
On |
None |
Standby |
Off |
On |
Minimal |
Suspend |
On |
Off |
Substantial |
Off |
Off |
Off |
Maximum |
On Tegra, the X Window System provides the display service. Due to this, you can use the xset utility to check the display status or configure the display-related settings. The following command gives you the display status:
$ xset q
You can enable or disable DPMS by using the following commands:
# xset +dpms // Enable DPMS
# xset -dpms // Disable DPMS
To adjust the idle-time delay for the monitor to enter the given power-saving state, you can use the following commands. For example, xset 10 20 30 means to enter “Standby” after 10 seconds of idle, “Suspend” after 20 seconds, and “Off” after 30 seconds. If you set the timeout to 0, the corresponding state is disabled. In other words, xset 0 0 0 means to disable DPMS implicitly. This could be a better way to “disable” DPMS, because the effect of -dpms could be reverted by other DPMS commands.
# xset dpms [standby [suspend [off]]]
You can also forcibly set the DPMS state instead of specifying the idle timeout to enter the state.
# xset dpms force on      // Turn off screen immediately
# xset dpms force off     // Turn off screen immediately
# xset dpms force standby // Standby screen
# xset dpms force suspend // Suspend screen
Supported Modes and Power Efficiency#
Jetson Thor is designed with a high efficiency Power Management Integrated Circuit (PMIC), voltage regulators, and power tree to optimize power efficiency. It supports multiple optimized power budgets, such as 10 watts, 15 watts, and 30 watts. For each power budget, several configurations are possible with various CPU frequencies and number of cores online.
Capping the memory, CPU, and GPU frequencies, and number of online CPU, GPU TPC, and PVA cores at a prequalified level confines the module to the target mode. Refer to the Thermal Design Guide, which you can find in the Jetson Download Center, for heavy workloads. The configurations predefined by NVIDIA are as follows.
The MAXN mode is an unconstrained power mode that allows a maximum number of cores and clock frequency for CPU, GPU, PVA, and SOC engines like VI, VIC, and so on. However, this mode does not guarantee the best performance for all use cases because hardware throttling is engaged when the total module power exceeds the TDP budget. Therefore, it is not the maximum performance mode. This is an experimental mode to tweak clock settings and create custom power modes that balance performance and power consumption. Refer to Power Estimator for more information about estimating the power and generating the nvpmodel configuration file for the custom power mode.
Because MAXN mode is an experimental setting for adjusting clock settings and creating custom power profiles, we don’t recommend running heavy workloads for prolonged periods in this mode.
NVP Model Clock Configuration for Jetson T5000 |
||
|---|---|---|
Property |
Mode |
|
MAXN |
120W* |
|
Power budget |
n/a |
120W |
Mode ID |
0 |
1 |
Online CPU |
14 |
14 |
CPU maximum frequency (MHz) |
2601 |
2601 |
GPU TPC |
10 |
10 |
GPU maximum frequency (MHz) |
1575 |
1386 |
NVDEC/NVENC/OFA/NVJPG maximum frequency (MHz) |
1692 |
1557 |
PVA cores |
1 |
1 |
PVA VPS maximum frequency (MHz) |
1215 |
1215 |
PVA AXI maximum frequency (MHz) |
909 |
909 |
Memory maximum frequency (MHz) |
4266 |
4266 |
All modes SOC clocks maximum frequency (MHz) |
adsp: 800 display: 843 rce: 396 vi: 873
ape: 600 display_hub: 385.7 se: 855 vic: 1107
axi_cbb: 202.5 host1x: 202.5 smmu: 900
bpmp: 810 isp: 1215 sor: 833
dce: 396 mcf: 1503 tsec: 360
|
|
* The default mode is 120W (mode ID 1).
|
||
Power Mode Controls#
You can display and change the power mode with the nvpmodel command.
To change the power mode, enter the command:
$ sudo /usr/sbin/nvpmodel -m <x>
Where
<x>is the power mode ID (for example, 0, 1, 2 or 3).Alternatively, use the nvpmodel GUI front end. For more information, see nvpmodel GUI, later in this topic.
After you set a power mode, the module stays in that mode until you change it. The mode persists across power cycles and SC7.
Note
GPU gpu_pg_mask can be set once before the GPU golden context is created.
If the nvpmodel power mode change requires a different gpu_pg_mask
value, a system reboot is required.
Example:
ubuntu@jetson:~$ sudo nvpmodel -m 0
NVPM WARN: Golden image context is already created
NVPM WARN: Reboot required for changing to this power mode: 0
NVPM WARN: DO YOU WANT TO REBOOT NOW? enter YES/yes to confirm:
Type YES or yes to initiate reboot or press any other key to cancel.
The settings will be in effect after the reboot.
To display the current power mode, enter the following command:
$ sudo /usr/sbin/nvpmodel -q
Alternatively, see the mode displayed to the right of the NVIDIA icon in the nvpmodel window’s menu bar. For more information, see nvpmodel GUI, later in this topic.
To add a custom power mode definition, edit this file:
/etc/nvpmodel.conf
This is an example entry for mode 1:
< POWER_MODEL ID=1 NAME=120W >
CPU_ONLINE CORE_0 1
CPU_ONLINE CORE_1 1
CPU_ONLINE CORE_2 1
CPU_ONLINE CORE_3 1
CPU_ONLINE CORE_4 1
CPU_ONLINE CORE_5 1
CPU_ONLINE CORE_6 1
CPU_ONLINE CORE_7 1
CPU_ONLINE CORE_8 1
CPU_ONLINE CORE_9 1
CPU_ONLINE CORE_10 1
CPU_ONLINE CORE_11 1
CPU_ONLINE CORE_12 1
CPU_ONLINE CORE_13 1
GPU_POWER_GATING GPU_PG_MASK 64
GPU_POWER_CONTROL_ENABLE GPU_PWR_CNTL_EN on
CPU_AE_0 MIN_FREQ 972000
CPU_AE_0 MAX_FREQ 2601000
CPU_AE_1 MIN_FREQ 972000
CPU_AE_1 MAX_FREQ 2601000
CPU_AE_2 MIN_FREQ 972000
CPU_AE_2 MAX_FREQ 2601000
CPU_AE_3 MIN_FREQ 972000
CPU_AE_3 MAX_FREQ 2601000
CPU_AE_4 MIN_FREQ 972000
CPU_AE_4 MAX_FREQ 2601000
CPU_AE_5 MIN_FREQ 972000
CPU_AE_5 MAX_FREQ 2601000
CPU_AE_6 MIN_FREQ 972000
CPU_AE_6 MAX_FREQ 2601000
CPU_AE_7 MIN_FREQ 972000
CPU_AE_7 MAX_FREQ 2601000
CPU_AE_8 MIN_FREQ 972000
CPU_AE_8 MAX_FREQ 2601000
CPU_AE_9 MIN_FREQ 972000
CPU_AE_9 MAX_FREQ 2601000
CPU_AE_10 MIN_FREQ 972000
CPU_AE_10 MAX_FREQ 2601000
CPU_AE_11 MIN_FREQ 972000
CPU_AE_11 MAX_FREQ 2601000
CPU_AE_12 MIN_FREQ 972000
CPU_AE_12 MAX_FREQ 2601000
CPU_AE_13 MIN_FREQ 972000
CPU_AE_13 MAX_FREQ 2601000
GPU MIN_FREQ 314000000
GPU MAX_FREQ 1386000000
VIDEO MIN_FREQ 314000000
VIDEO MAX_FREQ 1557000000
GPU_POWER_CONTROL_DISABLE GPU_PWR_CNTL_DIS auto
EMC MAX_FREQ 4266000000
PVA0_VPS MAX_FREQ 1215000000
PVA0_AXI MAX_FREQ 909000000
The unit of measure for CPU frequency is kilohertz. The unit for GPU, VIDEO, EMC, and PVA frequency is hertz. You must assign each custom mode a unique number in the ID field. Test your use case to determine:
How many active cores to use.
Frequency limits per engine.
The frequencies you select are subject to the MAXN limit defined in mode 0.
To learn about other options, enter the command:
$ /usr/sbin/nvpmodel -h
Fan Profile Control#
Jetson Thor supports a profile of fan operation named “cool”.
Userspace fan speed control daemon nvfancontrol manages fan speed based on the trip point temperatures configured for the selected profile.
Fan Profile Configuration#
Every fan speed step is associated with the trip point temperature and corresponding hysteresis. The following table shows the configurations predefined by NVIDIA.
Fan profile configuration for Jetson AGX Thor Developer Kit |
|||||||
|---|---|---|---|---|---|---|---|
Fan profile "cool" |
|||||||
Trip temperature*† |
0 |
15 |
24 |
29 |
35 |
45 |
115 |
Hysteresis* |
0 |
0 |
0 |
0 |
0 |
0 |
0 |
Fan PWM value |
255 |
255 |
192 |
140 |
102 |
77 |
77 |
Fan RPM value |
5371 |
5371 |
4170 |
2900 |
2300 |
1750 |
1750 |
* Trip temperature and hysteresis in degrees Celsius.
† Trip temperature is the TMARGIN temperature.
|
|||||||
nvfancontrol#
nvfancontrol is a userspace fan speed control daemon. This manages the fan speed based on the temperature-to-fan-speed mapping table in the nvfancontrol configuration file.
Basic elements in the nvfancontrol service include TMARGIN, kickstart PWM, fan profile, fan control, and fan governor. All of these can be programmed via the configuration file based on the user’s preferences. This chapter explains each of them in the following sections.
nvfancontrol.conf#
Location:
/etc/nvfancontrol.conf
Sample
nvfancontrol.conffile for Jetson Thor:POLLING_INTERVAL 2 <FAN 1> TMARGIN ENABLED FAN_GOVERNOR pid { STEP_SIZE 10 } FAN_GOVERNOR cont { STEP_SIZE 10 } FAN_CONTROL close_loop { RPM_TOLERANCE 100 } FAN_PROFILE cool { #TEMP HYST PWM RPM 0 0 255 5371 15 0 255 5371 24 0 192 4170 29 0 140 2900 35 0 102 2300 45 0 77 1750 115 0 77 1750 } THERMAL_GROUP 0 { GROUP_MAX_TEMP 115 #Thermal-Zone Coeffs Max-Temp cpu-thermal 25,0,0,0,0,0,0,0,0,0,0,0,0,0,0,0,0,0,0,0 0 gpu-thermal 25,0,0,0,0,0,0,0,0,0,0,0,0,0,0,0,0,0,0,0 0 soc012-thermal 25,0,0,0,0,0,0,0,0,0,0,0,0,0,0,0,0,0,0,0 0 soc345-thermal 25,0,0,0,0,0,0,0,0,0,0,0,0,0,0,0,0,0,0,0 0 } FAN_DEFAULT_CONTROL close_loop FAN_DEFAULT_PROFILE cool FAN_DEFAULT_GOVERNOR cont KICKSTART_PWM 51
Default Fan Profile#
For Jetson Thor devices, by default, the fan profile is set to “cool”. It is defined as FAN_DEFAULT_PROFILE in the configuration file /etc/nvfancontrol.conf.
Change the Default Fan Profile#
To change the fan profile, complete the following steps:
Stop the
nvfancontrolsystemd service:sudo systemctl stop nvfancontrol
Update the fan profile by editing
/etc/nvfancontrol.confRemove the status file:
sudo rm /var/lib/nvfancontrol/status
Start the
nvfancontrolsystemd service:sudo systemctl start nvfancontrol
Identifying the Current Fan Profile#
Enter the command:
$ sudo nvfancontrol -q
Example:
$ sudo nvfancontrol -q
FAN1:FAN_PROFILE:cool
...
...
After you set a fan profile, the module stays in that profile until you change it. The profile persists across power cycles and SC7.
Fan Profile Table#
The fan profile table contains the mapping between the temperature and the fan speed. It also contains the hysteresis value for each step.
Syntax:
FAN_PROFILE <fan_profile_name> {
        <temp>  <hyst>  <pwm>   <rpm>
}

Where:
<fan_profile_name>: Fan Profile Name
<temp>: Temperation step in degree celcius
<hyst>: Hysteresis step
<pwm>:  Fan PWM value
<rpm>:  Fan RPM value
Example:
FAN_PROFILE cool {
        #TEMP   HYST    PWM     RPM
        0       0       255     5371
        15      0       255     5371
        24      0       192     4170
        29      0       140     2900
        35      0       102     2300
        45      0       77      1750
        115     0       77      1750
}
TMARGIN#
TMARGIN temperature is the difference between the maximum allowable temperature and the current thermal zone temperature. For example, if the maximum allowable temperature of cpu-thermal is 115°C and the current temperature of cpu-thermal is 45°C, the current TMARGIN temperature of cpu-thermal is 70°C (115 – 45).
Kickstart PWM#
The minimal required PWM value to start the fan from complete stop state is called kickstart PWM. The fan might not start spinning if the PWM value is less than kickstart PWM.
Thermal Group#
THERMAL_GROUP contains the group maximum temperature for calculating the TMARGIN temperature and the list of thermal zones considered for calculating the trip temperature.
Thermal group maximum temperature:
GROUP_MAX_TEMP <temp_in_degree_celcius>
This parameter is used only when TMARGIN is enabled. The TMARGIN temperature is calculated as shown in TMARGIN section.
Thermal zone name, coefficients, and the thermal zone maximum temperature:
<thermal_zone_name> <coeff_0>,<coeff_2>....,<coeff_19> <thermal_zone_max_temp>
<thermal_zone_name>: Thermal zone name<coeff_0..coeff_19>: Coefficients used for calculating weighted average. Currently, only<coeff_0>is taken into consideration.<thermal_zone_max_temp>: Thermal zone maximum temperature. This is used only when TMARGIN is enabled. If GROUP_MAX_TEMP is specified, this temperature is ignored.
The following example demonstrates how to calculate weighted average temperature with TMARGIN enabled. If the current cpu-thermal is 55°C, gpu-thermal is 75°C, soc012-thermal is 43°C, and soc345-thermal is 39°C, the weighted average TMARGIN temperature is (115 - 55) * 0.25 + (115 - 75) * 0.25 + (115 - 43) * 0.25 + (115 - 39) * 0.25 or 62°C when using the following thermal group:
THERMAL_GROUP 0 {
        GROUP_MAX_TEMP 115
        #Thermal-Zone Coeffs Max-Temp
        cpu-thermal 25,0,0,0,0,0,0,0,0,0,0,0,0,0,0,0,0,0,0,0 0
        gpu-thermal 25,0,0,0,0,0,0,0,0,0,0,0,0,0,0,0,0,0,0,0 0
        soc012-thermal 25,0,0,0,0,0,0,0,0,0,0,0,0,0,0,0,0,0,0,0 0
        soc345-thermal 25,0,0,0,0,0,0,0,0,0,0,0,0,0,0,0,0,0,0,0 0
}
Fan Control#
The nvfancontrol service has two types of fan controls:
open-loop: The open-loop fan control adjusts the fan speed by setting the desired PWM value based on the current trip temperature step. The RPM values in the profile are ignored.
closed-loop: The closed-loop fan control makes the fan spin close to the desired RPM value based on the current trip temperature step. The PWM values in the profile are ignored.
To have the fan spin at the exact same speed as the target RPM incurs a performance drop and the risk of shorter fan life due to the constant adjustment of the speed. A programmable value specifies the tolerance between the target RPM and the current RPM value. In the following example, an RPM difference of 100 is specified as being acceptable:
FAN_CONTROL close_loop {
        RPM_TOLERANCE 100
}
Fan Governor#
The fan governor decides the fan speed control logic based on the fan profile. The nvfancontrol service has two kinds of fan governors: pid and cont.
The examples in this section use the following profile, which enables TMARGIN and open-loop control:
TMARGIN ENABLED
FAN_PROFILE cool {
        #TEMP   HYST    PWM     RPM
        0       0       255     5371
        15      0       255     5371
        24      0       192     4170
        29      0       140     2900
        35      0       102     2300
        45      0       77      1750
        115     0       77      1750
}
pid: The pid governor changes the fan speed only when the weighted average temperature crosses the trip temperature step. The curve between the weighted average temperature and fan speed resembles a stair.
For example, when a TMARGIN weighted average decreases and the TMARGIN weighted average is 70°C, the PWM is set to 77. Later, even when the TMARGIN weighted average decreases to 45°C, the PWM will still be set to 77. When the TMARGIN weighted average decreases to 44°C, the PWM is set to 102 until the next trip temperature step is crossed.
cont: The cont governor linearly interpolates the fan speed based on the upper and lower fan speeds between the trip temperature steps. Compared to the pid governor, the curve between weighted average temperature and fan speed is more continuous.
For example, when the current TMARGIN weighted average is 32°C, the PWM will be set to 121 (
140 + (32 - 29) * (102 - 140) / (35 - 29)).
Hysteresis in nvfancontrol#
In nvfancontrol, hysteresis is used to define the temperature threshold for fan speed changes when using the pid governor.
Consider the following profile with TMARGIN enabled:
TMARGIN ENABLED
FAN_PROFILE cool {
        #TEMP   HYST    PWM     RPM
        0       0       255     2900
        18      9       255     2900
        30      11      202     2300
        45      11      149     1700
        60      14      88      1000
        115     0       0       0
}
The fan turns on when the TMARGIN temperature reaches 60°C. When the TMARGIN temperature exceeds 74°C (60 + 14 = 74), the fan turns off.
Polling Interval#
The nvfancontrol daemon polls the thermal zone temperatures at the time interval specified by POLLING_INTERVAL and sets the fan speed value specified in the fan profile table:
POLLING_INTERVAL <time_in_seconds>
TMARGIN Configuration#
The TMARGIN configuration must be specified for the nvfancontrol daemon to implement the Fan Profile Table correctly.
Example for TMARGIN Enabled#
Formula to calculate the TMARGIN temperature:
Tmargin_sensor_temp = GROUP_MAX_TEMP -OR- <thermal_zone_max_temp> - <current_thermal_zone_temp>
Formula to calculate the TMARGIN weighted average of the thermal group sensors:
Tmargin_thermgroup_weighted_average = Tmargin_sensor0_temp * sensor0_weight_ratio + Tmargin_sensor1_temp * sensor1_weight_ratio + ...

Where:
Tmargin_sensor<x>_temp - Tmargin sensor temperature calculated using above formula.
sensor<x>_wight_ratio - Currently only <coeff_0> value is considered for weight ratio as mentioned in section "Thermal Group"
x - sensor number
Fan profile table:
TMARGIN ENABLED
FAN_PROFILE cool {
        #TEMP   HYST    PWM     RPM
        0       0       255     2900
        10      0       255     2900
        11      0       215     2440
        30      0       215     2440
        60      0       66      750
        105     0       66      750
}
Temperature steps defined in the preceding table are the TMARGIN temperatures calculated by using the formula mentioned at the start of this section.
Assume that GROUP_MAX_TEMP is set to 105, the current fan governor is continuous, and the current fan control is closed-loop. As specified in the fan profile table, the TMARGIN trip temperature step is 60°C, which corresponds to 45°C (105 - 60), the weighted average of the thermal zone temperature.
When the weighted average of the thermal zone temperature reaches 46°C (TMARGIN temperature 59°C), nvfancontrol sets the fan RPM to around 806 (the linear interpolated value between 750 and 2440).
In the preceding table, the fan RPM value will stay at 750 when the weighted average of the thermal zone temperature is between 0°C and 45°C (the TMARGIN temperature between 105°C and 60°C).
Example for TMARGIN Disabled#
Formula to calculate the weighted average of the thermal group sensors:
thermgroup_weighted_average = sensor0_temp * sensor0_weight_ratio + sensor1_temp * sensor1_weight_ratio + ...
In this formula:
sensor<x>_temp: Current thermal zone temperature.sensor<x>_weight_ratio: Currently only the<coeff_0>value is considered for the weight ratio, as mentioned in Thermal Group.x: Sensor number.
Fan profile table:
TMARGIN DISABLED
FAN_PROFILE quiet {
        #TEMP   HYST    PWM     RPM
        0       0       0       0
        50      18      77      1000
        63      8       120     2000
        72      8       160     3000
        81      8       255     4000
}
Temperature steps defined in the preceding table are the weighted average of the actual thermal zone temperature.
Assume that the current fan governor is pid and the current fan control is open-loop. As specified in the fan profile table, when the actual weighted average of the thermal zone temperature reaches 50°C and continues rising, nvfancontrol sets the fan PWM to 77. The fan PWM remains at 77 until the weighted average of the thermal zone temperature reaches 63°C.
Thermal Management#
Thermal management is essential for system stability and quality of user experience. Jetson Thor thermal management provides the following capabilities:
Sensing for on-board and on-chip thermal sensor temperature reporting.
Active Cooling for removing heat via the fan.
Passive Cooling for software and hardware clock throttling.
Shutdown for orderly software shutdown and hardware thermal shutdown.
Thermal management in Jetson Thor is performed by the following:
The Linux kernel, which monitors on-board and on-chip thermal sensors, performs cooldown, and supports software and hardware thermal shutdown.
The Board and Power Management Processor (BPMP), which monitors on-chip thermal sensors and performs slowdown and hardware thermal shutdown.
The following table identifies each thermal management action and the associated module for the SoC.
Thermal Action |
Linux Device Driver |
|---|---|
Sensing |
|
|
|
Slowdown for software throttling |
|
Cooldown for fan |
|
Slowdown for hardware throttling |
|
Software shutdown |
|
Hardware shutdown |
|
|
Linux Thermal Framework#
The Linux thermal framework provides generic user space and kernel space interfaces for working with devices that measure or control temperature. The central component of the framework is the thermal zone.
For more information about the Linux thermal framework, refer to <top>/kernel/3rdparty/canonical/linux-noble/Documentation/driver-api/thermal/sysfs-api.rst.
Thermal Zone#
A thermal zone is a virtual object that represents an area on the die whose temperature is monitored and controlled. A thermal zone acts as an object with the following components:
Temperature sensor
Cooling device
Trip points
Governor
BSP includes drivers that provide interfaces to these components.
This section introduces these components and demonstrates how they form a thermal zone on a Jetson device.
Configuring a Thermal Zone Using the Device Tree#
A thermal zone provides knobs to tune the thermal response of the zone. BSP provides several thermal zones tuned to provide optimum thermal performance. You can modify the provided thermal zones by editing the entries in the kernel device tree. Users can define sensors to use temperature limits and cooling actions on those limits. Device overheating can be resolved in most cases by tuning the thermal zone.
The following code snippet provides an example of a thermal zone for Jetson Thor. This thermal zone monitors the temperature of the TEGRA264_THERMAL_ZONE_CPU_MAX sensor. Clock throttling is performed using the devfreq cooling device when the passive trip point temperature is crossed:
cpu-thermal {
        status = "okay";
        thermal-sensors = <0x21c 0x08>;
        polling-delay = <0x3e8>;
        polling-delay-passive = <0x28>;

        trips {

                cpu-sw-slowdown {
                        temperature = <0x1a9c8>;
                        hysteresis = <0x00>;
                        type = "passive";
                        phandle = <0x21d>;
                };

                cpu-sw-shutdown {
                        temperature = <0x1bf44>;
                        hysteresis = <0x00>;
                        type = "critical";
                        phandle = <0x2f2>;
                };
        };

        cooling-maps {

                map-cpufreq {
                        trip = <0x21d>;
                        cooling-device = <0x170 0xffffffff 0xffffffff 0x172 0xffffffff 0xffffffff 0x174 0xffffffff 0xffffffff 0x176 0xfffffffffff 0x178 0xffffffff 0xffffffff 0x17a 0xffffffff 0xffffffff 0x17c 0xffffffff 0xffffffff>;
                };

                map-throttle-alert {
                        trip = <0x21d>;
                        cooling-device = <0x21e 0x01 0x01>;
                };
        };
};
For more information about thermal knobs, refer to <top>/kernel/3rdparty/canonical/linux-noble/Documentation/devicetree/bindings/thermal/thermal-zones.yaml.
Temperature Sensors#
A temperature sensor in a thermal zone is responsible for reporting the temperature in millidegrees Celsius. Jetson Thor has several types of temperature sensors on the chip and board.
For more information see Thermal Management in Linux.
Trip Points and Cooling Devices#
Thermal management uses trip points to communicate with thermal zones. A trip point describes the temperature at which cooling is recommended.
Trip points are classified by the type of cooling device triggered:
Passive trip points trigger passive cooling devices, which reduce the Jetson device’s performance and so reduce the amount of heat generated. Hardware or software clock throttling (reducing the frequency of a clock) is an example of a passive cooling device.
Active trip points trigger active cooling devices to remove the dissipated heat. A fan is an example of an active cooling device.
Critical trip points trigger a thermal shutdown.
A cooling map specifies how a cooling device is associated with certain trip points.
For more information, see Thermal Cooling.
Governors#
A governor implements a control loop that keeps a Jetson device within a safe operating temperature range. Although the Linux thermal framework provides a variety of governors, BSP provides a simple step_wise governor for all passive throttling needs.
BSP-specific Thermal Zones#
BSP defines platform-specific thermal zones. The zones are tuned to provide the best performance within the thermal constraints of the Jetson device. Each thermal zone uses a temperature sensor that is controlled by the Linux kernel or the BPMP firmware as described in the following table.
Thermal Zone |
Thermal Sensor |
Associated Module |
|---|---|---|
cpu-thermal |
|
Linux kernel and BPMP firmware |
gpu-thermal |
|
Linux kernel and BPMP firmware |
soc012-thermal |
|
Linux kernel and BPMP firmware |
soc345-thermal |
|
Linux kernel and BPMP firmware |
tj-thermal |
|
Linux kernel and BPMP firmware |
For more information, see Thermal Management in BPMP.
Gains achieved by tuning are limited by the Thermal Design Power (TDP) of the system. Tuning cannot remedy a faulty TDP. Removing all thermal zones does not guarantee maximum performance and can cause resets and irreversible damage to the device.
Thermal Management in Linux#
The Linux kernel provided by BSP includes several drivers for on-board and on-chip temperature sensing.
Thermal Sensors#
The Jetson Thor product family has several types of sensors to support hardware and software cooling strategies.
On-board Sensors#
BSP includes a driver for on-board sensor devices such as TMP451.
These thermal sensors can sense their own temperature as well as the temperature of a remote diode. Jetson platforms have these sensors set up as follows:
Thermal Sensor |
Thermal Measurement Location |
|---|---|
TMP451 remote sensor |
Temperature on die near GPU |
TMP451 local sensor |
Temperature of the board |
BSP configures these sensors to operate in an extended mode to increase the temperature range to −64 °C to 191 °C.
Operation in SC7#
The voltage rail that powers the on-board sensor is gated when the SoC enters the SC7 state on most Jetson platforms, except for Jetson Thor. For Jetson Thor, the voltage rail powering the TMP451 sensor remains on, so the sensor is operational in SC7 and can perform hardware thermal shutdown.
Thermal Capabilities#
The on-board sensors generate thermal events in the following situations:
Alert (interrupt) when crossing HIGH limit.
Hardware thermal shutdown when crossing THERM limit.
Correction Offset#
The on-board sensors allow software to program a static offset temperature for the remote sensor. This accounts for any inaccuracy that might be present in the sensor hardware. BSP reads the offset in the boot configuration table (BCT) and programs it into the offset register on boot. The offset is calculated and validated via oil-bath experiments.
On-chip Sensors#
The on-chip NV_THERM thermal sensors are controlled by BPMP firmware and the tegra-bpmp-thermal Linux kernel driver.
The BPMP firmware exposes each on-chip thermal sensor using the Application Binary Interface (ABI). Each sensor has an ABI name shown in the table in BSP-specific Thermal Zones. The on-chip sensors, whose names have the TEGRA264_THERMAL_ZONE_ prefix, work as described in the following paragraphs.
The BPMP firmware has one programmable temperature threshold (one trip)
for each on-chip sensor, allocated for a Linux thermal zone trip point.
The tegra_bpmp_thermal driver walks through the list of thermal trip
points in a Linux thermal zone based on the current temperature. It then
determines a trip to program the sensor temperature threshold in BPMP
firmware. The driver then uses the following thermal message requests (MRQs)
to communicate with the BPMP thermal framework.
CMD_THERMAL_QUERY_ABICMD_THERMAL_GET_TEMPCMD_THERMAL_SET_TRIPCMD_THERMAL_GET_NUM_ZONES
The driver receives a CMD_THERMAL_HOST_TRIP_REACHED MRQ message when a
particular sensor crosses a trip. The message is then relayed back to
the Linux thermal framework.
For more information on thermal management features provided as part of BSP, see Thermal Management in BPMP.
Thermal Cooling#
BSP provides thermal management using fan control and throttling of various clocks in the system.
Fan Management#
BSP provides active cooling by fan management through the pwm-fan driver,
controlled by nvfancontrol, which provides the following:
Fan speed control by programming the PWM controller.
Ramp-up and ramp-down control to change the speed of the fan smoothly.
Fan control during various power states.
SoC thermal management uses the fan as the first line of defense to delay clock throttling until a much higher temperature is reached.
Note
If nvfancontrol failed to start, the kernel will take over the fan speed control
based on the trip point temperatures defined for the tj-thermal sensor.
Software Clock Throttling#
BSP provides thermal cooling by throttling various clocks in the system. When a thermal sensor’s temperature rises above a throttling trip point, clock throttling employs the DVFS capabilities of the clocks to reduce their operating frequencies, and thereby the voltages of the rails that power the clocks. This reduction in frequency and voltage reduces power consumption, which helps to control the temperature.
Because BSP provides cooling by reducing the clock frequency, it directly impacts performance and the user experience. If a device feels warm and seems sluggish, it might be due to thermal throttling of the clocks. This can be remedied by tuning the trip points and cooling devices of thermal zones.
BSP provides the following cooling devices for software clock throttling:
cpufreq_coolingdevfreq_cooling
Each of these cooling devices provides several cooling states, each of which translates to a maximum allowable operating frequency for the CPU and GPU clocks. These frequencies are optimized to provide the best possible performance at a given temperature. The frequency tables for these clocks are available in the sysfs nodes exposed by cpufreq and devfreq frameworks.
The governor uses the current temperature of a thermal zone as an input to the feedback control loop. Similarly, it uses the output of the control loop to set a new cooling state for the thermal zone’s cooling device. As the device heats up, the governor picks progressively higher cooling states, which result in lower frequency caps for all of the clocks and potentially greater cooling. BSP performs this thermal throttling of the clocks to maintain the junction temperature of the die within the recommended safe limits. For software throttling trip temperatures, see the table in Thermal Specifications.
Software Thermal Shutdown#
A critical trip point triggers a software thermal shutdown. It allows the operating system to save its state and perform an orderly shutdown before a hardware thermal reset occurs.
A software thermal shutdown is considered a rare event. It occurs after all other cooling strategies have failed.
BSP defines one critical trip point per thermal zone. You can set the lower limit for the orderly shutdown. For software thermal shutdown trip temperatures, see the table in Thermal Specifications.
Hardware Thermal Shutdown#
The on-chip and on-board sensors can trigger hardware shutdown when all other cooling strategies have failed, and software shutdown has failed to occur when it should. For hardware shutdown limits, see the table in Thermal Specifications.
Thermal Management in BPMP#
BSP thermal management features are part of the firmware running on BPMP for Jetson platforms running any host operating system (host OS) on the CPU.
Thermal Sensing#
The BPMP firmware hosts the nvtherm drivers for the on-chip thermal sensors as follows:
Thermal Sensor |
ABI Name |
Sensed Location |
|---|---|---|
NV_THERM |
CPU_MAX |
Hottest spot of CPU clusters. |
GPU_MAX |
Hottest spot of GPU clusters. |
|
SOC_012_MAX
SOC_345_MAX
|
The two maximum temperatures reported across the SOC region, which is the area outside the CPU and GPU regions. |
|
TJ_MAX |
Virtual sensor corresponding to the highest temperature among CPU_MAX, GPU_MAX, SOC_012_MAX, and SOC_345_MAX. |
NV_THERM#
NV_THERM is the collection of on-chip ring oscillators whose frequency
changes are based on temperature. To convert a measured frequency to a
temperature, the oscillating frequency of the sensor, at a fixed
temperature, must be known in advance and stored in the on-chip fuses.
The BPMP firmware nvtherm driver uses these fuses during boot and
calibrates the sensor. When the calibration is complete, the temperature
sensor reports the temperature, in degrees Celsius, with a 0.03125 °C
precision margin.
Sensors and Sensor Groups#
The temperature sensors on the chip are logically classified in sensor groups, based on their proximity to certain hardware blocks. The sensor groups are represented as a single sensor to the host OS and the BPMP firmware.
For example, Jetson Thor has some temperature sensors in the CPU
cluster. These are grouped as CPU sensors that are represented as
TEGRA264_THERMAL_ZONE_CPU_MAX to the operating system running
on the CPUs. The BPMP firmware reports the temperature of a given group by
taking the maximum of all the sensors in the group.
Note
The GPU power rail might be turned off at idle by run-time power management. The temperature cannot be read from GPU thermal sensors when the power is off. An attempt to read a sensor with the power off returns error code EAGAIN (resource temporarily unavailable).
Thermal Event Detection#
Thermal sensors can report the temperature when the current temperature crosses a software-defined trip point. The sensors are capable of monitoring several of these software trip points to perform the following thermal actions:
Report when the thermal trip point has been crossed.
Trigger a hardware thermal shutdown.
Trigger hardware throttling.
Voltage Rail Dependencies#
To provide accurate temperature sensing, the sensors require a minimum voltage. Additionally, the sensors cannot operate when the rail is power-gated.
When the system is in a low-power state, the firmware provides the following mode of operation:
No temperature measurements during SC7: Because the rail powering the sensor is power-gated in the SC7 state, the oscillator is not running. Therefore, the frequency-to-temperature conversion might produce inaccurate values. To avoid spurious temperature reports from the sensors, stop the sensors before entering the SC7 state.
BPMP Thermal Framework#
The BPMP firmware hosts a thermal framework to perform the following tasks:
Register thermal sensors as thermal zones, as identified in Thermal Sensing.
Allow BPMP modules to register trip points on the thermal zones.
Allow the host OS to register trips using thermal MRQ messages.
Provide trip management and reporting.
The thermal framework maintains a list of trips per sensor that includes
the current trip from the host OS and various BPMP modules. As
temperatures change, the framework examines the list of current trips
and notifies the owners of the trips of the changes. The notification is
sent using a callback for the BPMP owned trips and the thermal MRQ
command CMD_THERMAL_HOST_TRIP_REACHED for trips that are owned by the
host OS.
The primary thermal MRQ requests handled by the framework are as follows:
CMD_THERMAL_QUERY_ABICMD_THERMAL_GET_TEMPCMD_THERMAL_SET_TRIPCMD_THERMAL_GET_NUM_ZONES
Because a sensor might have several trips, the thermal
framework must ensure that a notification is generated whenever a given
trip is crossed. For example, if TEGRA264_THERMAL_ZONE_CPU_MAX has trips at 55°, 60°,
65°, and 70 °C, the thermal framework sends a single notification when
the temperature crosses 55°, 60°, 65°, or 70 °C.
Additionally, the framework implements hysteresis to prevent sending too many notifications. Thus for the preceding example, the framework
Sends one notification when the temperature reaches 55 °C.
Waits until the temperature drops below 54 °C.
Sends another notification when the temperature rises back to 55 °C.
To generate these notifications, the thermal framework sets low trips on the sensors to receive events that the temperature has dropped below the limit.
Hardware Throttling#
Each element in a power delivery system includes limitations, such as the following:
The amount of current a battery can supply without shutting down.
The amount of current a regulator can provide before it fails to maintain its output voltage.
The amount of ripple current an inductor in a switching regulator can tolerate without overheating.
These limitations can result in fast transient electrical and thermal events, such as the following:
Overcurrent at the battery.
Voltage drop at the PMIC.
Temperature spikes.
The firmware refers to these events as OC alarms and triggers clock hardware throttling to handle them.
Impact#
Like software throttling, hardware throttling can reduce performance. Because the triggering events are rare and transient in nature, though, the user experience is minimally impacted.
The host OS is not notified of these events, but you can detect the drop in clock rates by using a performance measuring tool that samples the CPU cycle counters. While thermal management in the host OS seeks to control temperature on an ongoing basis, hardware throttling clamps down the clocks to handle events.
Throttle Points and Vector Configuration#
The BPMP device tree binary holds the various throttle points and the throttle settings that govern when and how throttling is performed. The nvtherm driver in the BPMP firmware handles any interrupts resulting from these events.
The following table shows the hardware throttling levels:
Hardware throttling |
Clock throttled percentage |
|---|---|
Heavy |
87.5 |
Medium |
75 |
Light |
50 |
Throttle vectors are optimized for limiting peak current consumption while maximizing performance. To manage peak current consumption, the firmware supports capping the CPU and GPU clocks at various levels (such as light, medium, and heavy), as described in the device tree bindings. Clock capping prevents the CPU and GPU from drawing more current than their voltage regulators can supply.
For hardware throttling trip temperatures, see the table in Thermal Specifications.
Design Considerations#
Designing failsafe measures into Power Management Integrated Circuits (PMICs), or using the battery controller to shut down the device when the events described here occur, results in a bad user experience. Similarly, designing power delivery hardware for worst-case loads results in large and costly components.
Consequently, NVIDIA SoCs are designed for use with power delivery systems that are adequate for common loads. NVIDIA SoCs actively manage their components to avoid exceeding their design limits. When events are transient, the advantage of this approach to power management becomes more compelling.
Hardware Thermal Shutdown#
The final failsafe for firmware thermal management is a hardware thermal reset, or thermtrip. If software and hardware throttling are unable to control heat generation in the system, and the software becomes unresponsive, the SoC asserts the reset pin on the PMIC as the hardware shutdown mechanism.
For hardware shutdown limits, see the table in Thermal Specifications.
Thermal Specifications#
The following table describes the supported cooling states.
Thermal Zone or HWMON Node |
Thermal Sensor |
Cooling Action |
Jetson T5000 |
|---|---|---|---|
cpu-thermal |
TEGRA264_THERMAL_ZONE_CPU_MAX |
SW throttling |
109.0 °C |
HW throttling |
113.0 °C |
||
SW shutdown |
114.5 °C |
||
HW shutdown |
115.0 °C |
||
gpu-thermal |
TEGRA264_THERMAL_ZONE_GPU_MAX |
SW throttling |
109.0 °C |
HW throttling |
113.0 °C |
||
SW shutdown |
114.5 °C |
||
HW shutdown |
115.0 °C |
||
soc012-thermal |
TEGRA264_THERMAL_ZONE_SOC_012_MAX |
SW throttling |
109.0 °C |
HW throttling |
113.0 °C |
||
SW shutdown |
114.5 °C |
||
HW shutdown |
115.0 °C |
||
soc345-thermal |
TEGRA264_THERMAL_ZONE_SOC_345_MAX |
SW throttling |
109.0 °C |
HW throttling |
113.0 °C |
||
SW shutdown |
114.5 °C |
||
HW shutdown |
115.0 °C |
||
tmp451 hwmon temp1 |
TMP451 local sensor |
HW shutdown |
117.0 °C |
tmp451 hwmon temp2 |
TMP451 remote sensor |
HW shutdown |
117.0 °C |
Note
When the threshold is exceeded, the TEMP_THERM signal is asserted by TMP451 thermal sensors and the hardware is shut down. The board should be sufficiently cooled before
it is powered on again. The power rail for TMP451 on Jetson T5000 is always on, so powering the board on without sufficient cooling will fail. (The default hysteresis is 10°C.)
The board can be powered on again only after the temperature falls below (<threshold> - <hysteresis>) °C. If the board cannot be sufficiently cooled, completely cut off the
power to TMP451 and reset the TEMP_THERM signal by unplugging the power supply and then plugging it in again.
Related Tools and Techniques#
Maximizing Jetson Thor Performance#
The jetson_clocks.sh script maximizes Jetson Thor performance
by setting the static maximum frequencies of the CPU, GPU and EMC clocks.
The maximum clock frequency is defined by nvpmodel power modes.
Refer to Supported Modes and Power Efficiency for more information.
You can also use the script to show current clock settings, store current
clock settings into a file, and restore clock settings from a file.
The script is available at:
/usr/bin/jetson_clocks
To run the script, enter:
$ jetson_clocks [<options>]
Where <options> are zero or more of the command line options in the following table.
|
Description |
|---|---|
–show |
Displays the current settings. |
–store [<file>] |
Stores the current settings to a file. The
default file is
|
–restore [<file>] |
Restores the saved settings from a file. The
default file is
|
–fan |
Set maximum PWM fan speed. |
To show the current settings#
Enter the command:
$ sudo /usr/bin/jetson_clocks --show
Storing the Current Settings#
Enter the command:
$ sudo /usr/bin/jetson_clocks --store
Maximizing Jetson Thor Performance Only#
Enter the command:
$ sudo /usr/bin/jetson_clocks
Note
After running jetson_clocks, you cannot change the nvpmodel power mode. If the power mode has to be changed after running jetson_clocks, a system reboot is required.
Maximizing Jetson Thor Performance and Fan Speed#
Enter the command:
$ sudo /usr/bin/jetson_clocks --fan
To restore the previous settings#
Enter the command:
$ sudo /usr/bin/jetson_clocks --restore
Fan Speed Control#
Jetson Linux affords means of getting and setting fan speed from the command line.
To set fan speed manually, enter the command:
$ echo <PWM_duty_cycle> > /sys/class/hwmon/hwmon<x>/pwm<y>
Where:
<PWM_duty_cycle>is a value in the range [0,255].<x>is a kernel enumerated number for fan hwmon.<y>is a kernel enumerated number for fan.
To get the fan speed measured by the tachometer, enter the command:
$ cat /sys/class/hwmon/hwmon<x>/rpm
<x>is a kernel enumerated number for tachometer hwmon.
To get the fan speed for a Jetson Thor device, run the following command:
$ cat /sys/class/hwmon/hwmon<x>/fan<y>_input
<x>is a kernel enumerated number for tachometer hwmon.<y>is a kernel enumerated number for fan.
nvpmodel GUI#
The nvpmodel GUI is a GUI front end for the nvpmodel command line tool.
It is an easy way to access power-related functionality and information.
The nvpmodel GUI is represented by an NVIDIA icon on the right side of the Ubuntu desktop’s top bar.

The current power mode is displayed next to the NVIDIA icon. In the preceding illustration, the current mode is MAXN.
To switch the current power mode, click the NVIDIA icon to open a dropdown menu from the icon. Click Power mode to open a submenu of power modes.
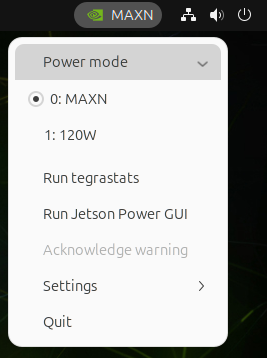
Click the power mode you want to set.
Note
The GPU
gpu_pg_maskvalue can be set once before the GPU golden context is created. If the nvpmodel power mode change requires a differentgpu_pg_maskvalue, a system reboot is required.To run
tegrastats, click the NVIDIA icon to open the dropdown menu.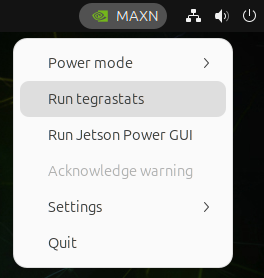
Click Run tegrastats to spawn a terminal window and run
tegrastats.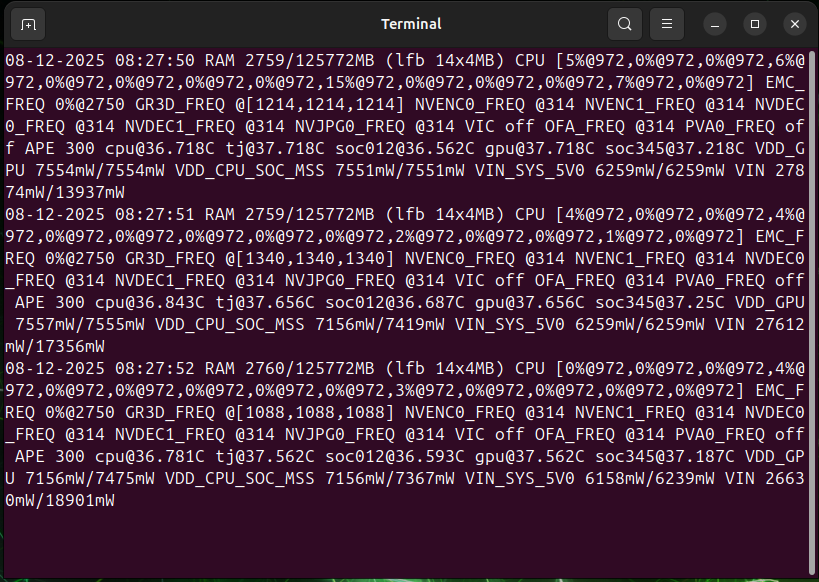
The
tegrastatsdisplay is described in Tegrastats Utility in the topic Jetson Linux Development Tools. It provides power-related information such as CPU, GPU, and EMC frequencies and the temperatures of thermal zones registered to the system.If system input voltage drops below a safe level, the
nvpmodelGUI displays a desktop notification to warn you that the system is being throttled back to avoid a shutdown due to insufficient power. When the system is thermally throttled, the GUI displays a similar notification to show that the device is operating at lowered speed to reduce heat generation.The following images show examples of notifications:

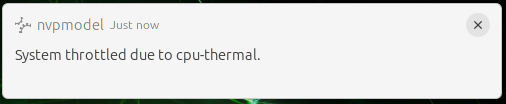
Jetson Power GUI#
The Jetson Power GUI is a GUI tool for monitoring the power and thermal status of Jetson platforms. The tool reports various power and thermal related information which would help the user to understand power and thermal behavior of Jetson platforms.
To run the Jetson Power GUI:
Click the nvpmodel GUI represented by an NVIDIA icon on the right side the Ubuntu desktop’s top bar.
Click Run Jetson Power GUI.
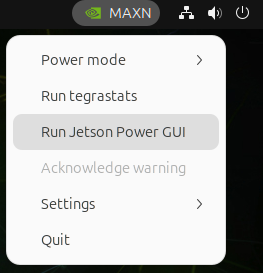
Main Tab#
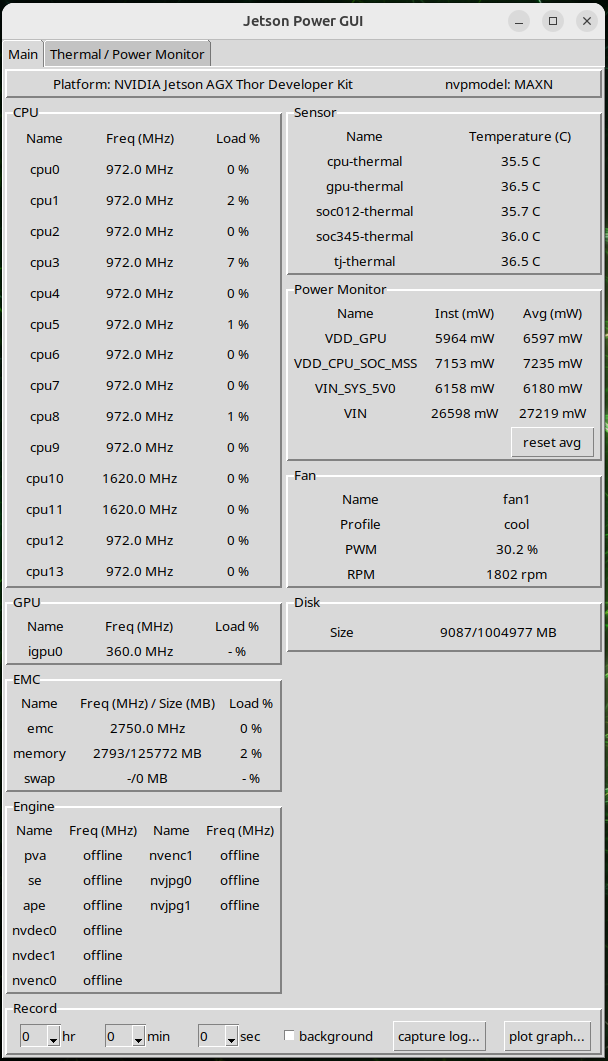
Here are the information / functionalities provided in the
Maintab:Frame name
Provided information / functionalities
Top
Jetson platform name
Current power mode
CPU
- CPU related information
State
Clock frequency
Load percentage
GPU
- GPU related information
State
Clock frequency
Load percentage
EMC
- EMC related information
State
Clock frequency
Load percentage
Memory usage (used size / total size)
Swap usage (used size / total size)
Engine
- Engine related information
State
Clock frequency
Sensor
- Thermal sensor related information
Temperature read by thermal sensor
Power Monitor
- Power monitor related information
Instantaneous power read by power monitor
Average power read by power monitor
- Power monitor related functionalities
Reset average power calculation by clicking the
"reset avg"button
Fan
- Fan related information
Fan profile
PWM percentage
RPM value
Disk
- Disk related information
Disk usage (used size / total size)
Record
- Functionalities
Allow the user to capture the log within the specified duration.
Click the “background” button to capture the log in the background, which avoids the system putting in extra effort on rendering GUI.
Allow the user to plot the power related data. The user can plot the data from captured log, or plot the real-time data.
Thermal / Power Monitor Tab#
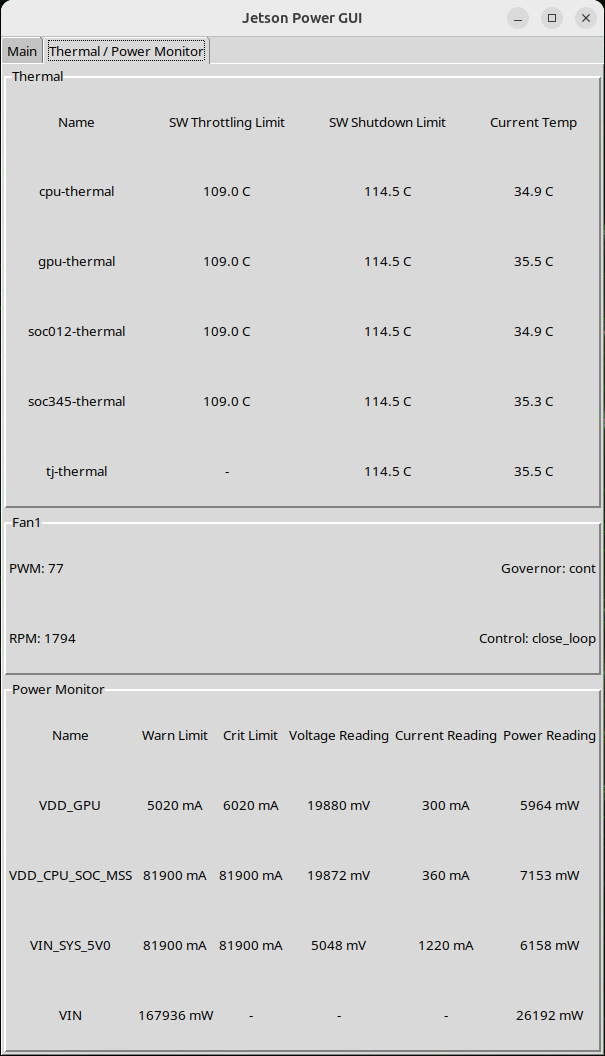
Here are the information / functionalities provided in the
Thermal / Power Monitortab:Frame name
Provided information / functionalities
Thermal
- Thermal sensor related information
Software throttling limit (if any)
Software shutdown limit (if any)
Temperature read by thermal sensor
Fan
- Fan related information
PWM value
RPM value
Power Monitor
- Power monitor related information
Average current limit
Instantaneous current limit
Voltage read by power monitor
Current read by power monitor
Power read by power monitor
Functionality in the Record Frame#
The Record frame provides these functionalities:
Capture power related information to a log file within the user specified duration
Plot the power related information to graph.
Below steps illustrate how to capture the data to a log file:
Before clicking the
"capture log..."button in the Record frame, select the desired capture duration.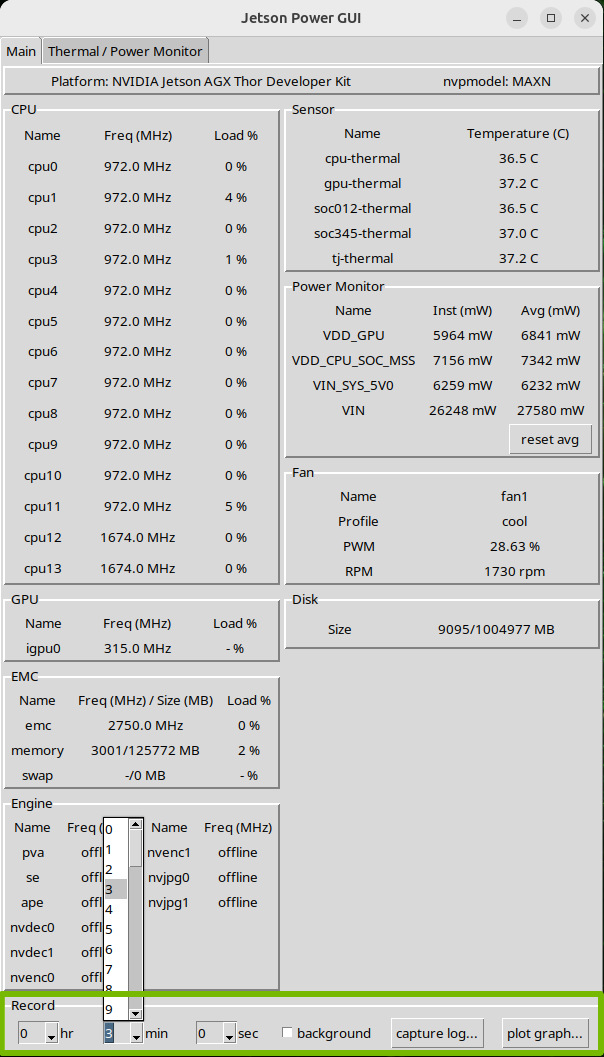
After selecting the desired capture duration, click the capture log… button. In the file dialog, select the path in which to save the captured log.
There are two kinds of supported formats, the
.csvand the.txtfile format.If the user wants to capture the log in the background, the
"background"checkbox should be checked before clicking the"capture log..."button.
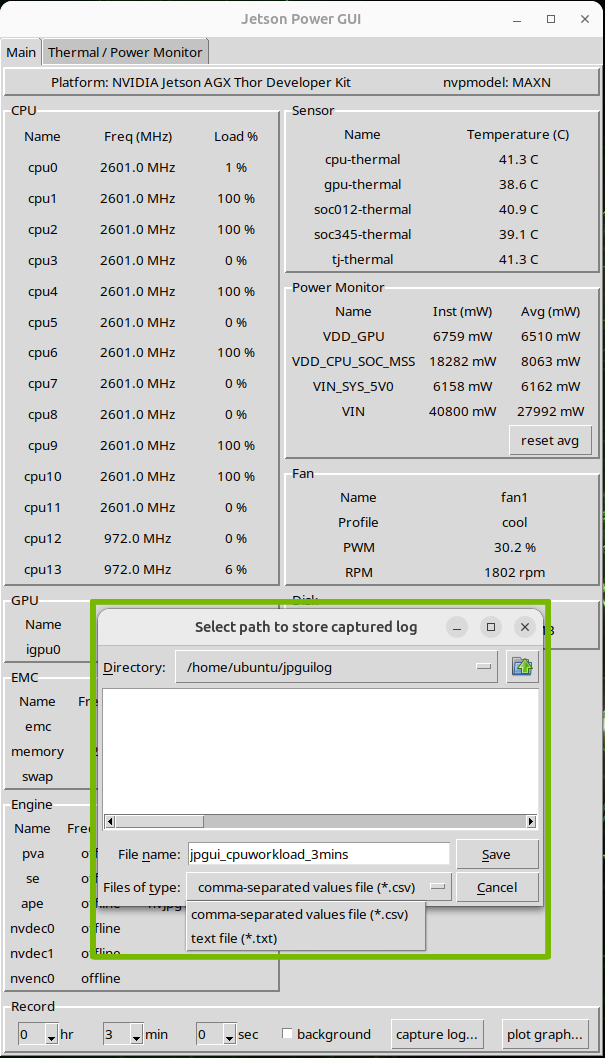
After you select the path to the capture log, the capturing process starts.
Note
If you want to stop the capturing process earlier during the capturing process, you can click the stop capturing button to interrupt the capturing process. The captured log will still be saved to the specified path.
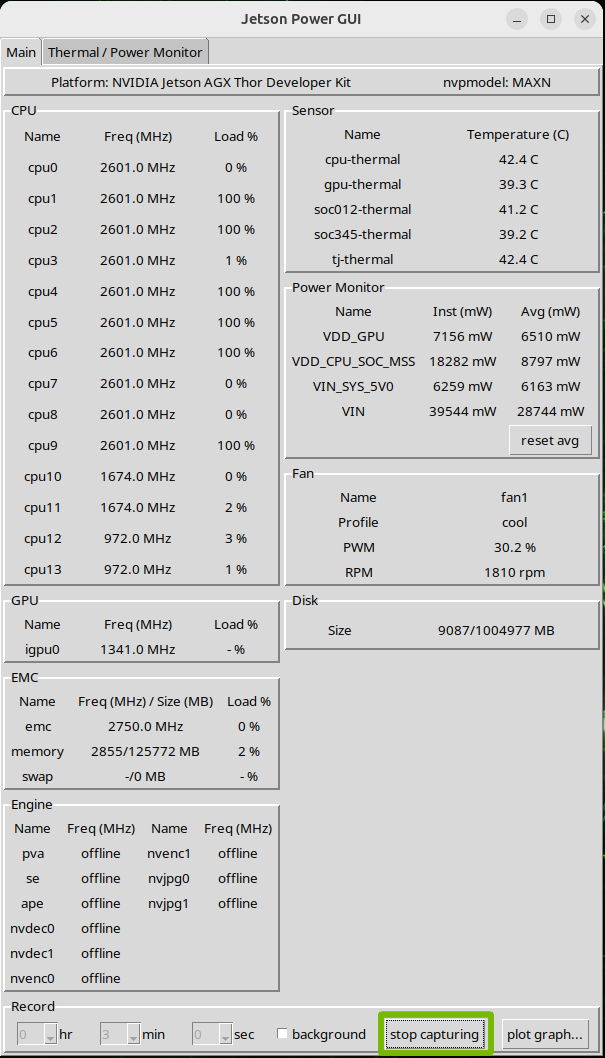
When the capturing process is finished, a message box appears.
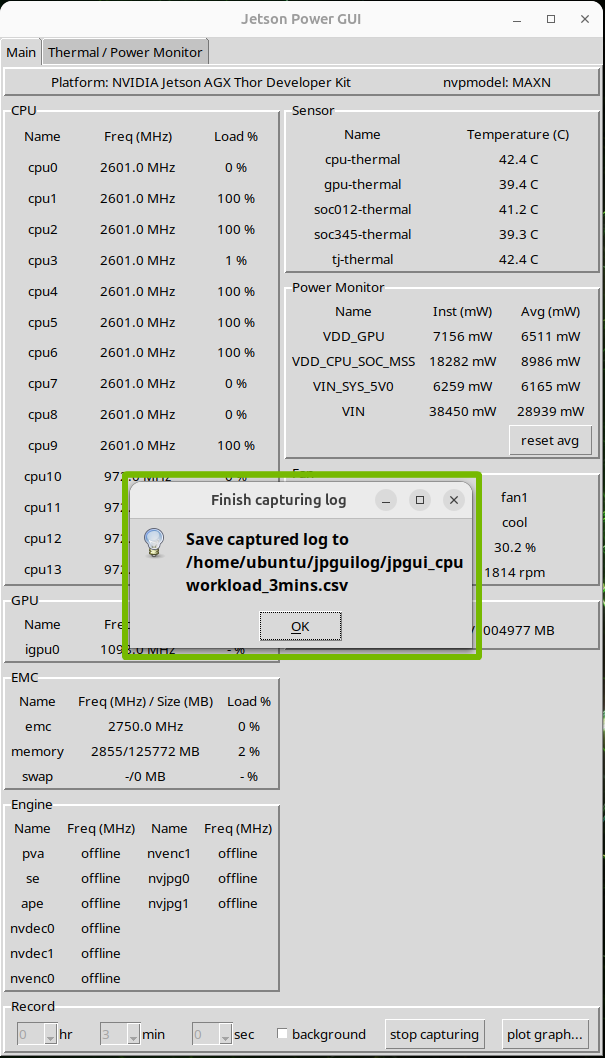
Here is the preview of the captured log.
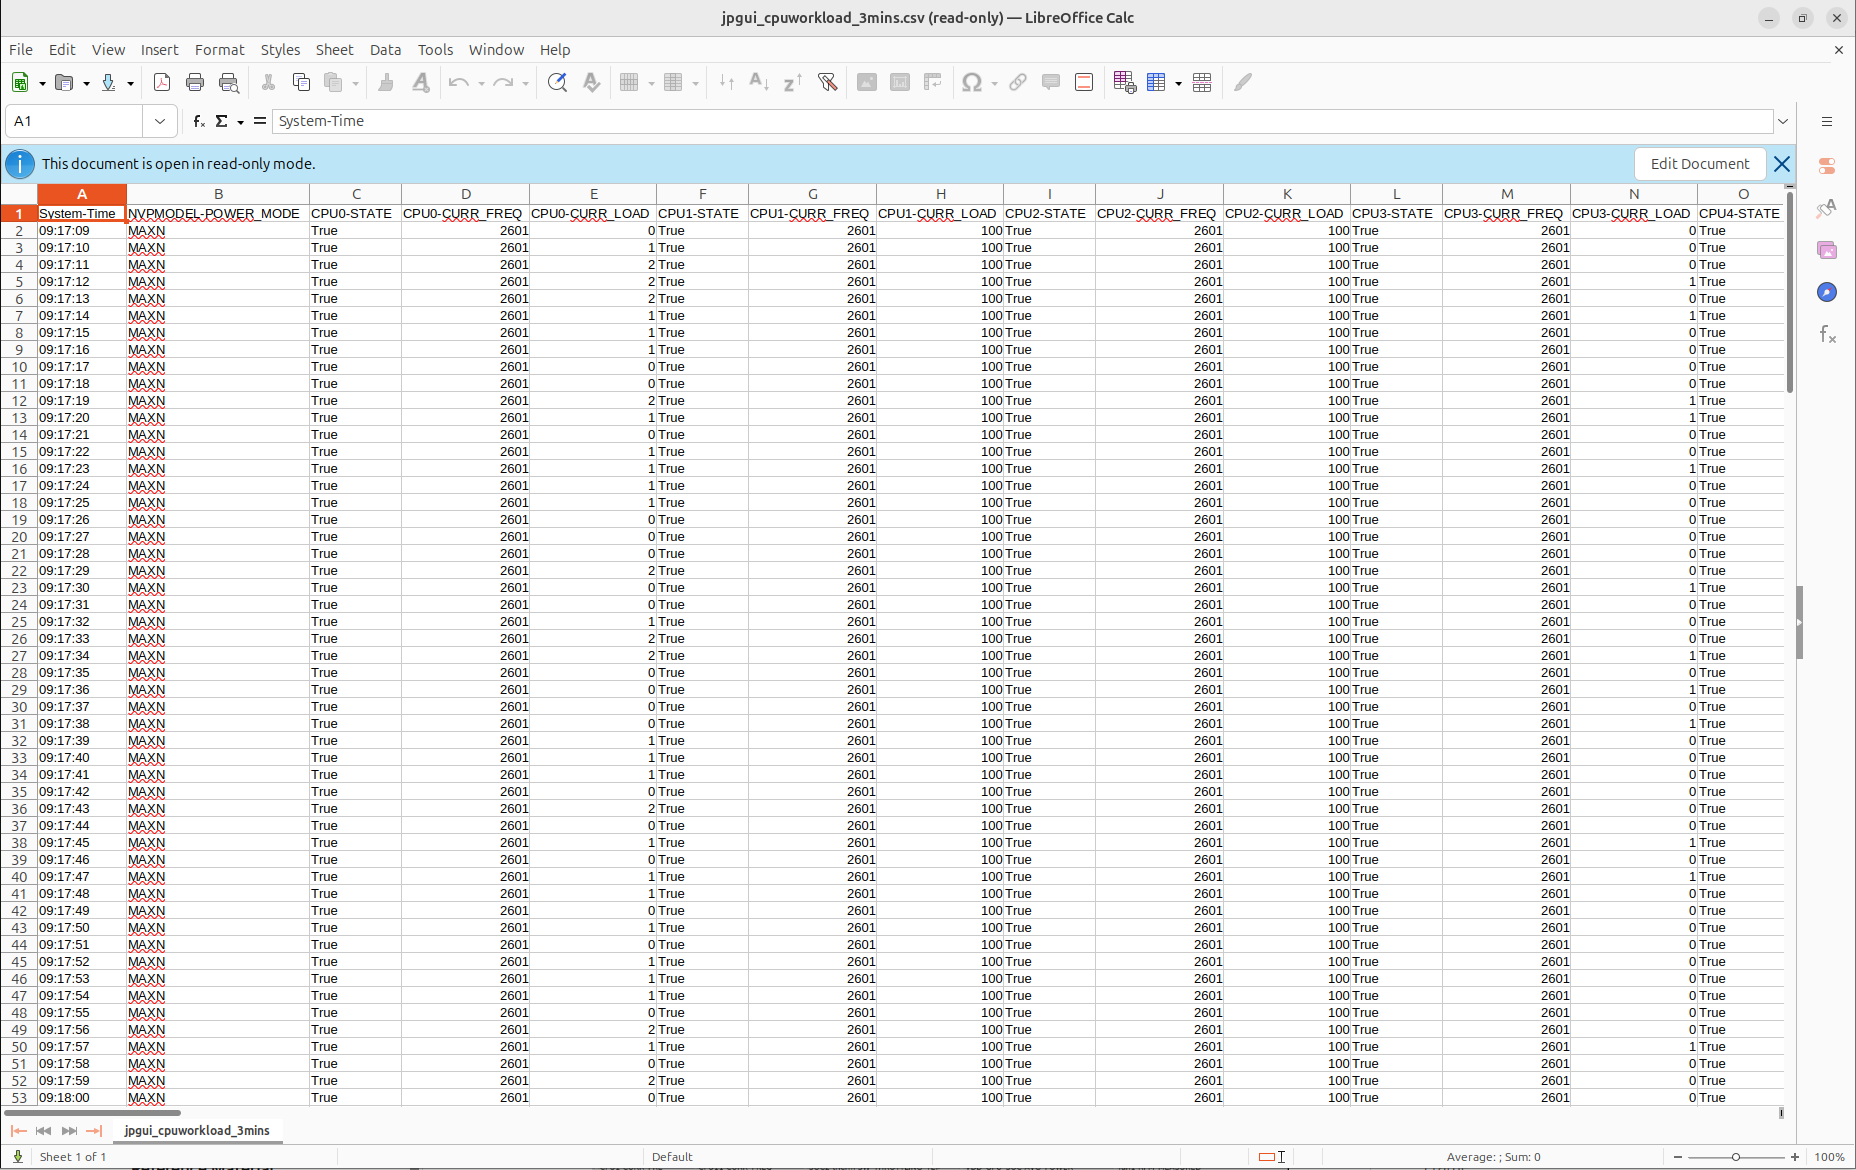
The following steps illustrate how to visualize the data:
The plot graph…* button provides the data visualization functionality. Click the button to open a window in which you can select the desired power channels to plot. Click the select all button to select all power channels with a single click.
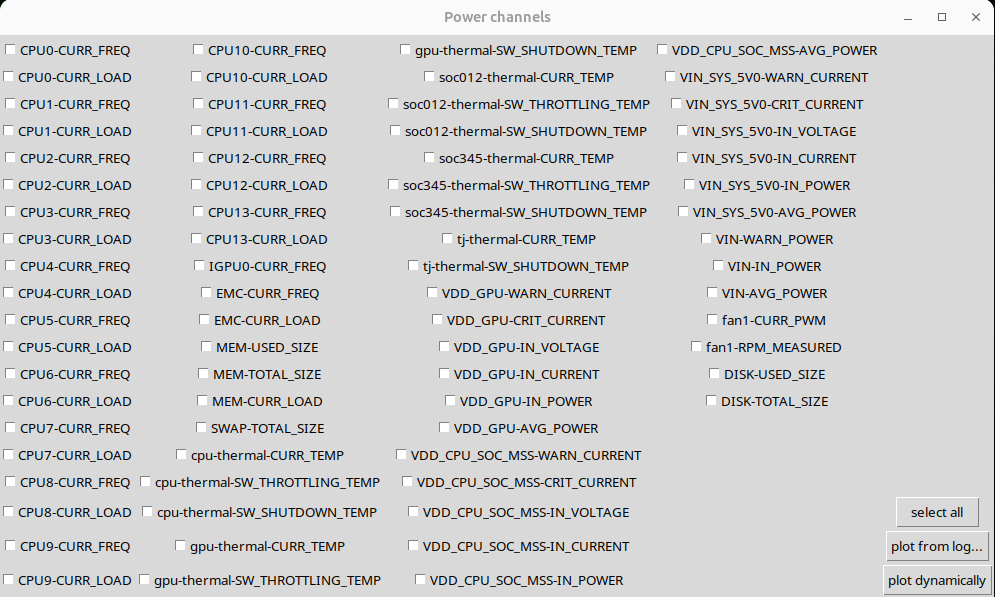
After selecting the desired power channels, you can plot the data either from the captured log or in real time.
Click the plot from log… button to open a file dialog in which you can choose which log file to plot.
After you select the log file, the data is plotted.
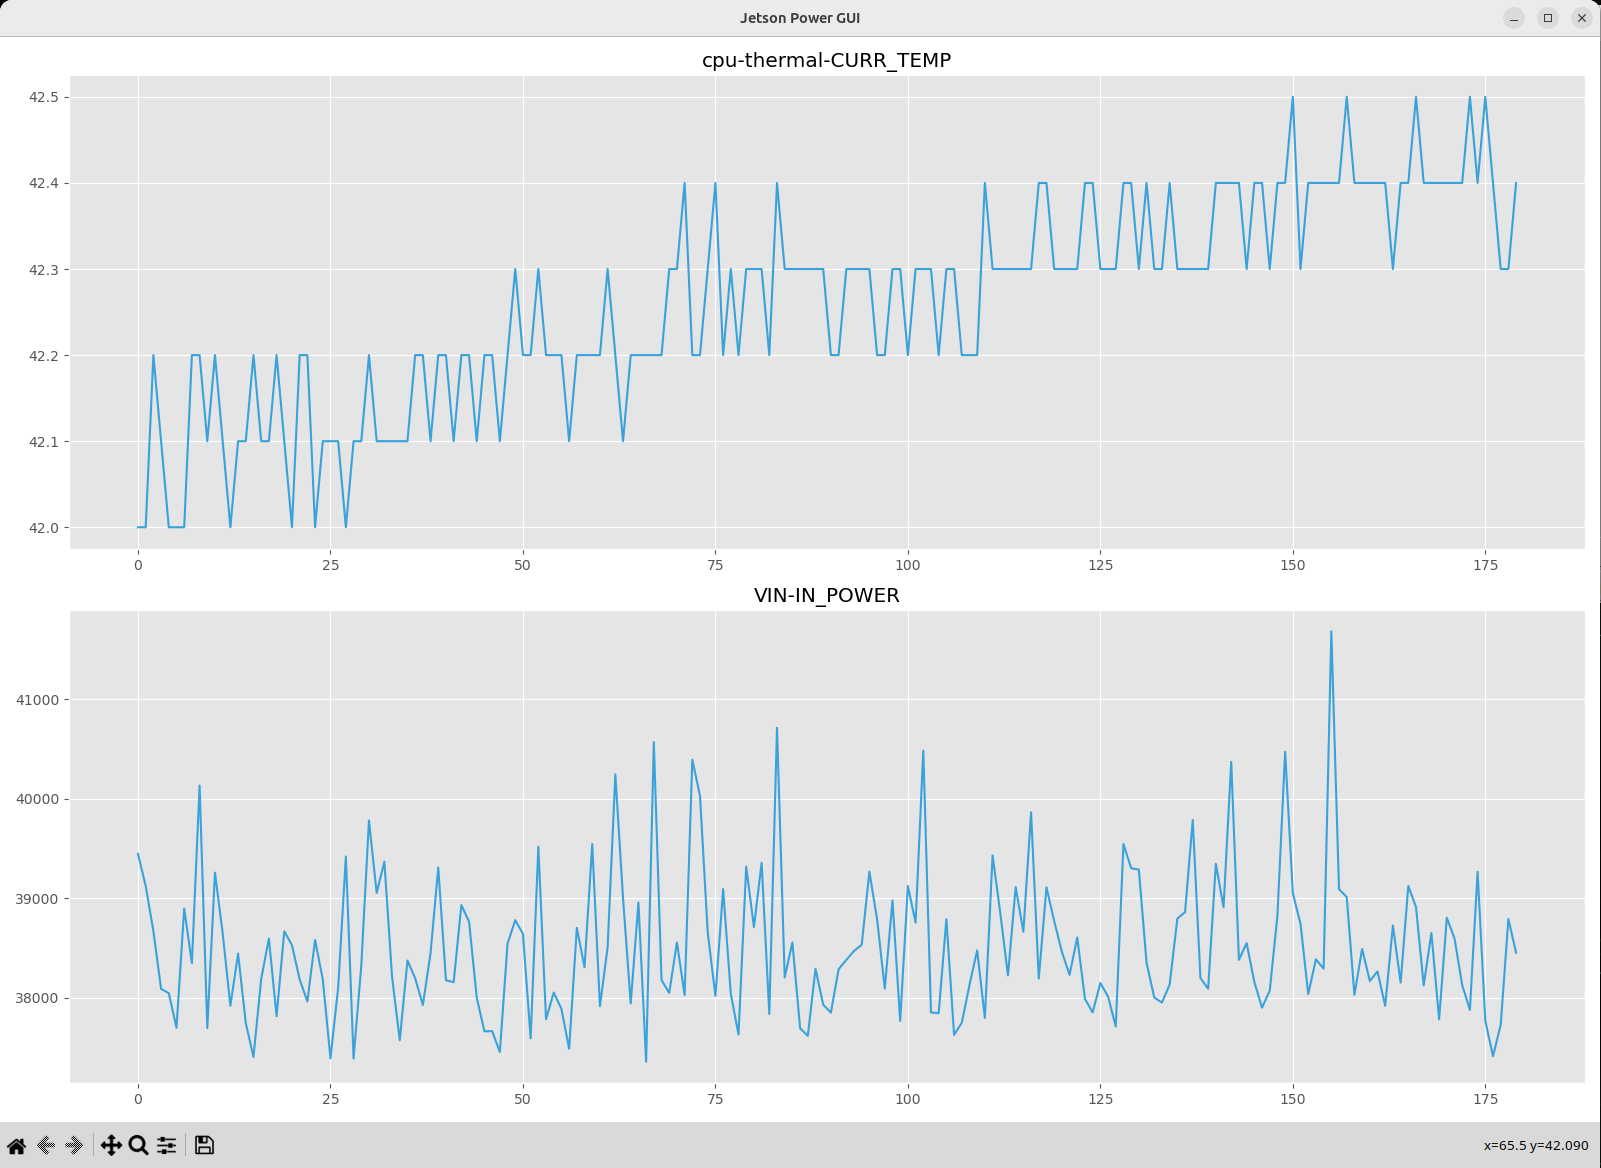
Click the plot dynamically button to plot the last 120 seconds of real-time data.
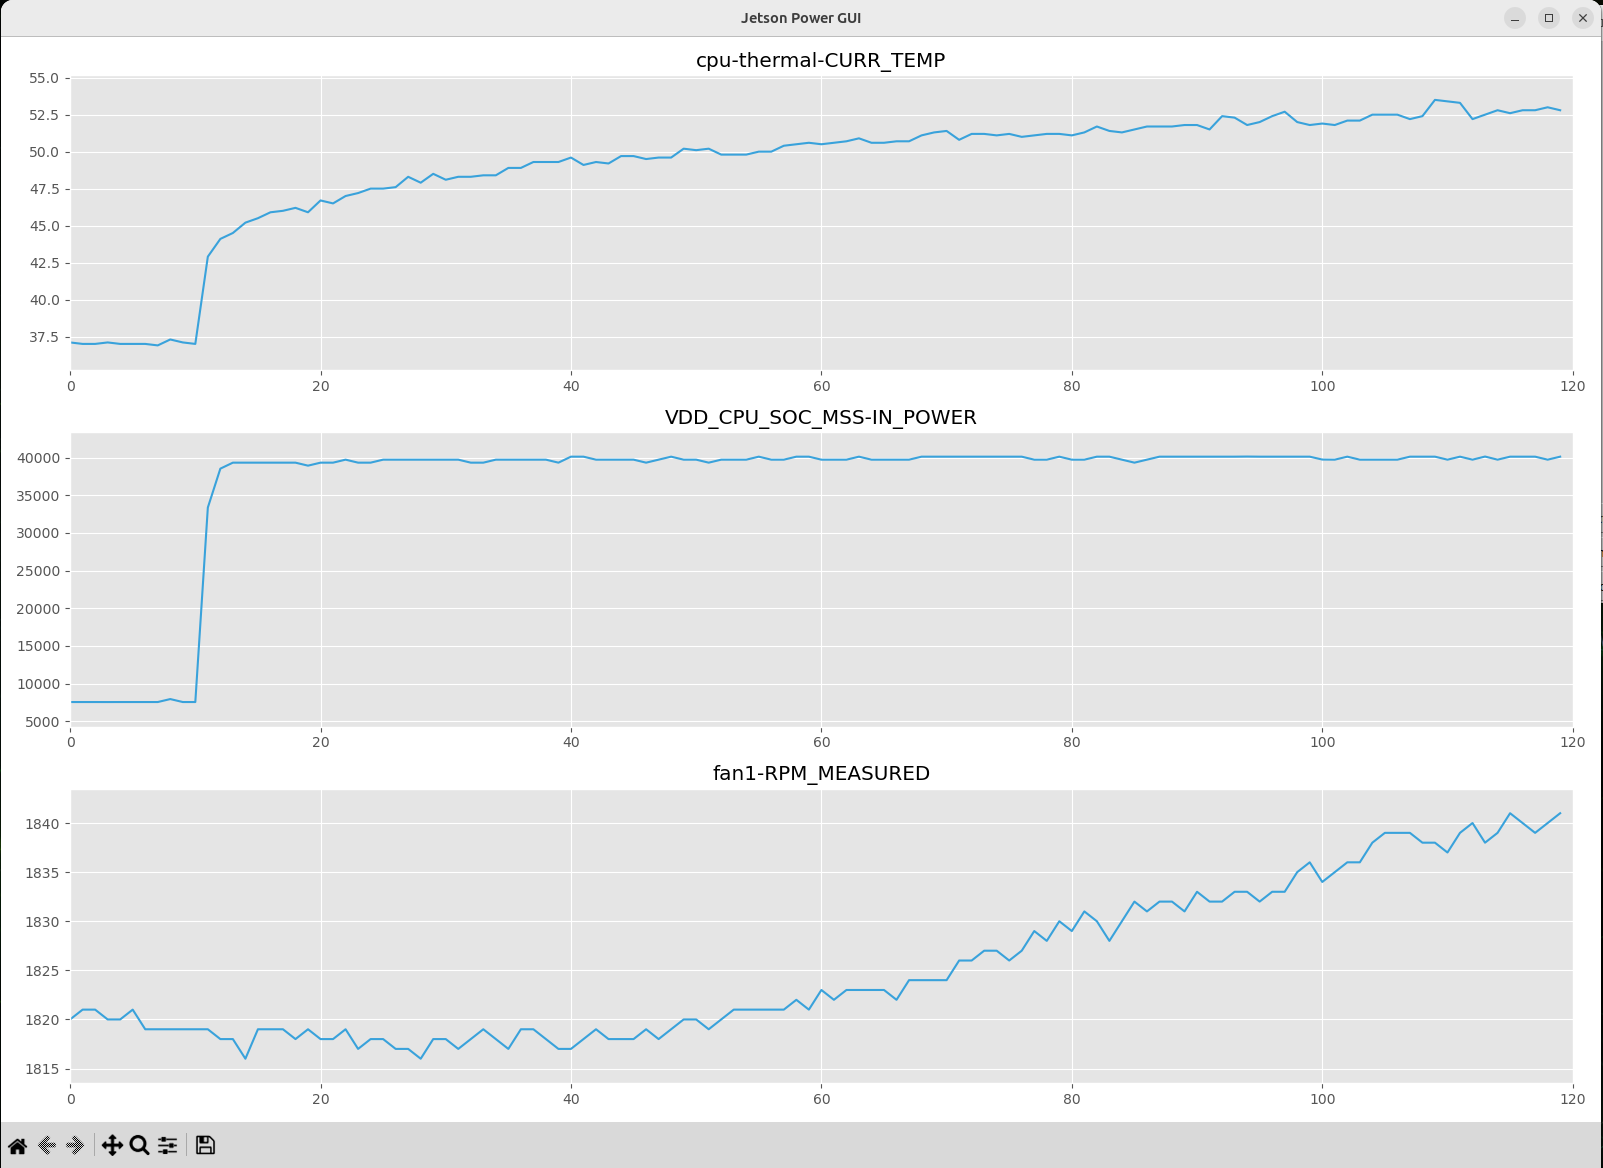
To stop the real-time plotting process, click the stop plotting button.