Step #2: Inferencing Pipeline
The Morpheus digital fingerprinting inferencing pipeline has pre-processing and post-process stages. Each of these has multiple stages in between, as illustrated in the graphic below.
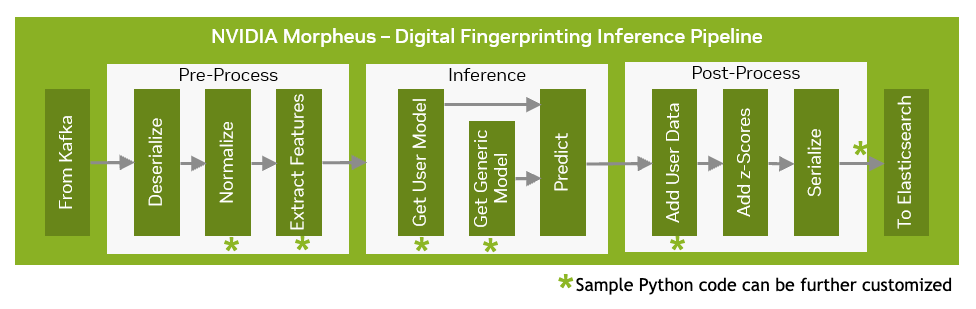
Sample Python code running the below stages has been deployed via this inference pipeline. This sample code is available as source code which can be further customized by the developer.
Normalize
Extract Features
Get User Model
Get a Generic Model
Add User Data
Before proceeding, ensure that at least one training job has been submitted via the previous step. If you completed Step 1, you can proceed with the instructions below.
The AI application includes sample dashboards and components set up for this pipeline. They can be accessed using the links provided in the left pane, using the credentials below:
Grafana:
User: admin
Password: {{ grafana_password }}
Kibana:
User: elastic
Password: {{ kibana_password }}
MinIO:
User: minioadmin
Password: {{ minio_password }}
This information can also be found in the Helm releases notes.txt by running the following command in the SSH console:
helm status dfp -n morpheus
These components support the AI Workflow pipeline’s functionality. Within the following steps, you will refer to the component URLs to monitor the pipeline’s activity and the outputted data.
Initially, this dashboard will be blank because the pipeline has not received any streaming data.
In addition to the monitor and reporting tools, a mock data producer is provided to simulate Azure AD Active Directory logs. To start streaming data into the pipeline, you will need to scale this data producer up to at least one instance.
Using the SSH console, execute the following command:
kubectl -n morpheus scale deploy/dfp-mock-data-producer --replicas=1
Each data producer instance sends roughly 10 msgs/sec. After scaling, you should then see a new data-producer pod running in the namespace:

Once the data producer is running and streaming data, you should see information populating into the Grafana dashboard.
Open the Grafana dashboard within a new tab within your Internet Browser.
NoteLog in using the credentials listed above.
Select the Dashboards icon in the left navigation pane, select browse, and double-click Azure AD - Suspicious Activity Alerts dashboard.

The following dashboard is displayed:

Kibana can also view the data run through the pipeline for analysis and investigation.
Open the Kibana dashboard within a new tab within your Internet Browser.
NoteLog in using the credentials listed above.
Open the menu on the top left and select Discover under Analytics.

Click Create Index Pattern.

Enter morpheus-dfp under the Name field, and select createdDateTime under the Timestamp field.
Click Create Index Pattern.

Open the menu on the top left and select Discover under Analytics again.
Change the filter from logs-* to morpheus-dfp.

The chart shows the data after it has streamed through the pipeline.
As a review, the overall pipeline functionality works as follows:
Data is streamed into Kafka from the mock data producer.
Data is ingested into the pipeline, pre-processed, inferenced, and post-processed.
Results from the pipeline are aggregated into Prometheus and presented via Grafana.
After the data runs through the pipeline, it is saved in Elasticsearch for later viewing and analysis via Kibana.
That’s all there is to run the Digital Fingerprinting AI Workflow. Feel free to explore the other components deployed as a part of the solution.
The source code for this AI Workflow is available in the Enterprise Catalog with NVIDIA AI Enterprise. If you have an NVIDIA AI Enterprise license, the source code can be found here and is also included in the Digital Fingerprinting Collection on NGC. This can be used to determine how this workflow is constructed and how you can customize it to your specific use case and environment. For example, the mock data producer included with this workflow can be replaced, and real streaming data can be connected to this pipeline.