Step #1: Classification Training
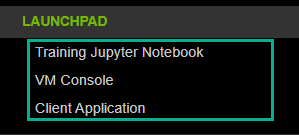
The image classification lab will use four important links from the left-hand navigation pane throughout the course of the lab. The Openshift Grafana dashboard is used to visualize GPU metrics like GPU utilization during model training.
Lab Architecture
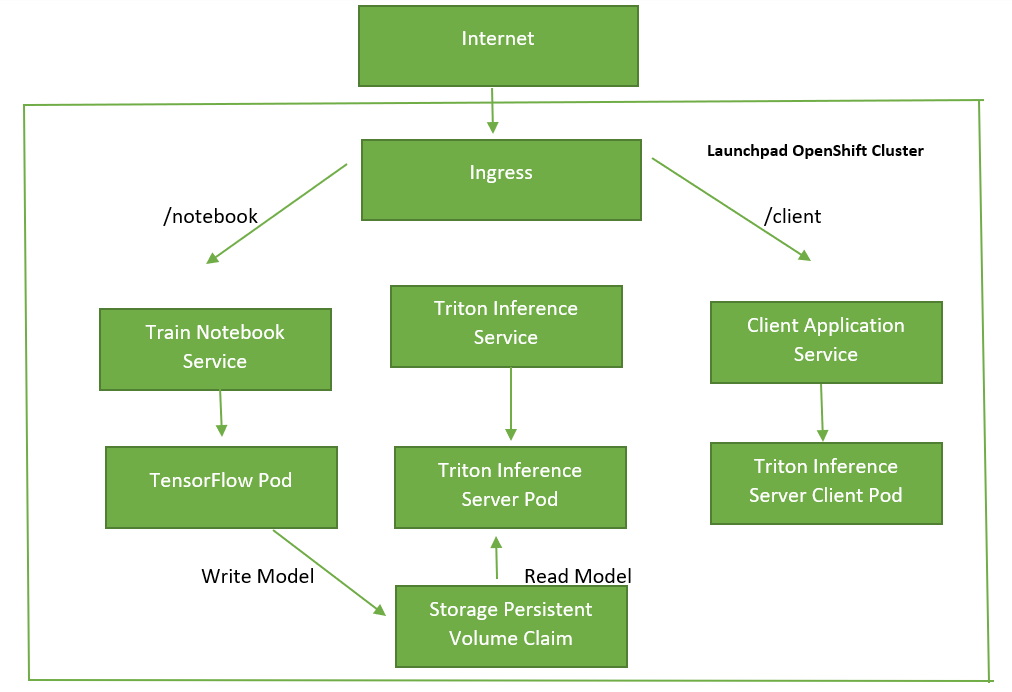
The lab has already been deployed as a helm chart on the Openshift cluster. The microservices deployed as part of the helm chart are shown in the diagram below. The helm chart creates three services and three deployments objects. One service-deployment pair for training Jupyter notebook, one for model deployment on the Triton Inference server and one for hosting a client application Jupyter Notebook which talks to the Triton Inference Server Kubernetes Service. The Training Jupyter pod and the Triton Inference server pod are connected to a Persistent Storage through a Persistant Volume Claim.
Containers are immutable, meaning that when a container shuts down, all the data created during its lifetime is lost. Therefore there is a need for containers to have a place to store information persistently, Kubernetes provides a persistent storage mechanism for containers and based on a Persistent Volume. The Training Jupyter Notebook Pod saves the trained model on this Persistent Volume and the Triton Inference Server reads and hosts the model from the same persistent volume. The helm chart is available for your review and perusal using the System Console link on the left in the home directory (/home/nvidia/image-classification). Please feel free to go through it.
In this portion of the lab, the machine learning workflow is explored:
Examine and understand data.
Build an input pipeline.
Build the model.
Train the model.
Test the model.
Save the model into Triton Inference Server format.
Open and run through the image classification training Jupyter Notebook with image classification to train a mobilenet model on the Stanford Online Products dataset to get started.
Grafana dashboard
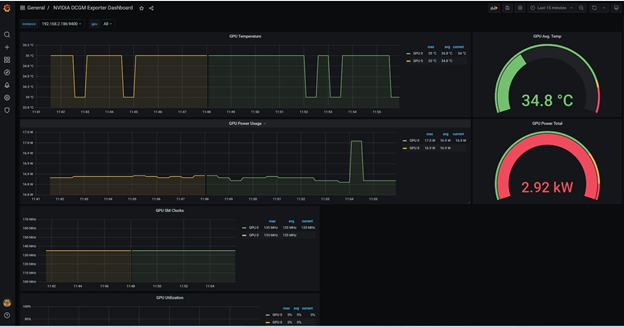
During the model you can use the Openshift Grafana Dashboard link on the left to open a dashboard to monitor GPU metrics like GPU Utilization and temperature etc.
Below are the credentials for the Grafana Dashboard
Username: nvadmin
Password: nvopenshift
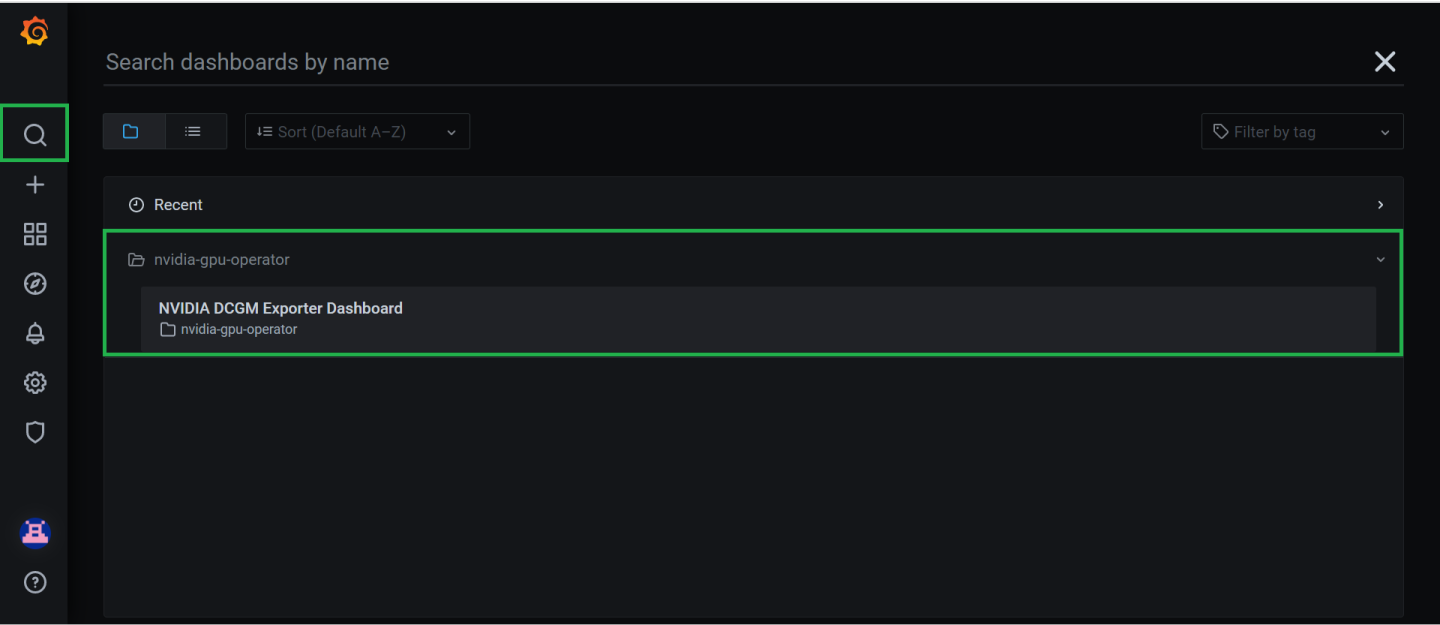
Once you open the dashboard you can click on the seach icon and select NVIDIA DCGM Exporter dashboard to get access to a GPU metrics dashboard.
To run a cell on the Jupyer Notebook, click on the cell you want to run and press enter Shift + Enter. Linux bash commands can be run inside the Jupyter Notebook by adding a bang symbol (!) before the command inside the Jupyter Notebook cell.