FAQs
Reference Applications
How do I resolve a failure when running the reference apps ?
We recommend the following steps to resolve deployment failures in reference apps -
Make sure a previous deployment isn’t already running using
docker ps. If a previous deployment exists, then stop the deployment and run the app again.A failure can happen if the previous deployment was not stopped and a re-deployment was performed.
Make sure the correct values are set in
.envfile in the foundational directory.Make sure the system have proper access to the downloaded
metropolis-apps-datafolder. You can give all permission to it by$ sudo chmod -R 777 path/to/metropolis-apps-data.We recommend you remove the elastic search data from previous runs before a fresh redeployment:
$ sudo rm -r path/to/metropolis-apps-data/data_log/elastic/nodesCheck the component logs using
docker logs mdx-<component>to find the issue. We recommend starting with the DeepStream and the Kafka components.A port being occupied is a common cause for deployment failure.
Why am I not seeing data on the Kibana/reference application’s UI ?
We recommend the following steps to resolve the issue -
If you are using nvstreamer, verify that the video is present in the mount or that the files were uploaded correctly.
Check if the VST is able to play all the streams. If not, you may need to add a coturn server in Kubernetes. Alternatively, you could also check if the streams are playable using ffplay, VLC or testRTSPClient.
Check the logs of DeepStream to ensure the FPS is showing up correctly for the input streams.
Inspect Kibana to see if the data is being sent. If it’s not, check the Logstash logs for any errors. If no errors are found, write a Kafka consumer script to verify if raw data is being sent by DeepStream.
If the UI is loading partially, ensure that you have added all the pre-requisite files, such as the calibration file, images, and image metadata json file. Ensure that the image’s name matches with the value present in image metadata json file.
Finally, make sure that the sensor IDs listed in the calibration file matches with the ones mentioned in DeepStream and VST configuration. Also ensure that the sensorIDs of the streams that get added directly via VST matches with the ones mentioned in calibration file.
My videos produce incorrect timestamps for messages or are processed over an extended duration
For DeepStream to properly work with NVStreamer the input videos need to be encoded to not contain any b frames. To check if the b-frames are present in a video, use either of the following commands:
mediainfo <media_file> | grep bframes
ffprobe <media_file> -show_frames | grep -E 'pict_type=B'
You can encode your videos to this format by running
ffmpeg -i input_video.mp4 -vcodec libx264 -crf 25 -x264opts "bframes=0:keyint=30" encoded_output_video.mp4
Update the value of the keyint with the fps of your video.
Note
The videos can be encoded while uploading via NVStreamer UI.
Troubleshooting NVStreamer/VST Videos in Docker-Compose
Verify that the NVStreamer/VST is serving the videos by opening the RTSP streams in either vlc or ffplay. If using VLC click on “Media” and “Open Network Stream” and enter the following RTSP URL -
rtsp://<video url>. Stream RTSP URL can be grabbed from NVStreamer/VST UI.If NVStreamer/VST is not streaming the videos make sure the port 8554(NVStreamer)/8555(VST) is not blocked by a fire-wall.
Troubleshooting MMS Videos
Ensure that the Milestone Server is running.
Make sure the sensor-name used in MMS matches the one used by DeepStream and calibration. If it does not match the bounding boxes might not appear on the video.
When I run reference application in playback mode could I loop through the playback data more than once?
Currently the playback module will loop through the provided playback data once then stop. You can either restart the mdx-analytics-playback container by docker restart mdx-analytics-playback to replay the data one more time,
or you can config analytics-stream-playback module to loop through playback data more than once before deployment.
Specifically, using RTLS app as example, add the following in docker-compose/rtls-app/behavior-analytics/configs/analytics-stream-config.json under “spark” section to loop through the data 10 times:
{ "name": "playback-loop", "value": "10" }
Which ports are used by docker-compose deployment?
The following ports are used during metropolis microservice deployment:
Calibration-Toolkit - 8003
Default Kafka Port - 9092
Default ZooKeeper Ports - 2181
Elasticsearch and Kibana (ELK) - 9200 and 5601 respectively
Jupyter Lab - 8888
NVStreamer - 31000
Triton - 8000(HTTP), 8001(GRPC)
VST - 30000
Web-API - 8081
Web-UI - 3002 (3003 for RTLS app)
What if I don’t want to expose Kafka service when deploying it on different CSPs using docker compose?
Go inside metropolis-apps-standalone-deployment/docker-compose/foundational/ and update the Kafka paramater KAFKA_ADVERTISED_LISTENERS in the mdx-foundational.yml file. The value of the parameter will change from PLAINTEXT://$HOST_IP:9092 to PLAINTEXT://localhost:9092. This way, we will not be exposing kafka’s port (9092) to the external world for security purposes.
Which ports are used by Kubernetes deployment?
The following ingress port and service ports are used for metropolis app deployment:
Elasticsearch - 31080/elastic (exposed via ingress)
Grafana Dashboard - 32300
Kibana - 31560
Milvus-Attu Dashboard - 31500
NVStreamer - 31000
Triton - 31580 (HTTP), 31581 (GRPC)
VST - 30000
Web-API - 31080/api/v2/analytics (exposed via ingress port)
Web-UI - 31080 (exposed via nginx-ingress)
For the docker-compose reference app deployments if I have more than one GPU on my system can I split the load?
DeepStream is one of the modules that consumes GPU resource the most. You can change gpu-id in DeepStream configuration file. The DeepStream configuration files are located at:
For the Multi-Target Multi-Camera Tracking (MTMC) app:
metropolis-apps-standalone-deployment/docker-compose/mtmc-app/Deepstream/mtmc_config.txtFor the Real-Time Location System (RTLS) app:
metropolis-apps-standalone-deployment/docker-compose/rtls-app/Deepstream/rtls_config.txtFor People Analytics reference app:
metropolis-apps-standalone-deployment/docker-compose/people-analytics-app/Deepstream/ppl_analytics_config.txt
Some index-patterns are missing in Kibana/ How do I create index-patterns?
If index-patterns are not seen after running the sample-apps, go to Stack Management->Saved Objects, click on “Import” and upload the dashboard file.
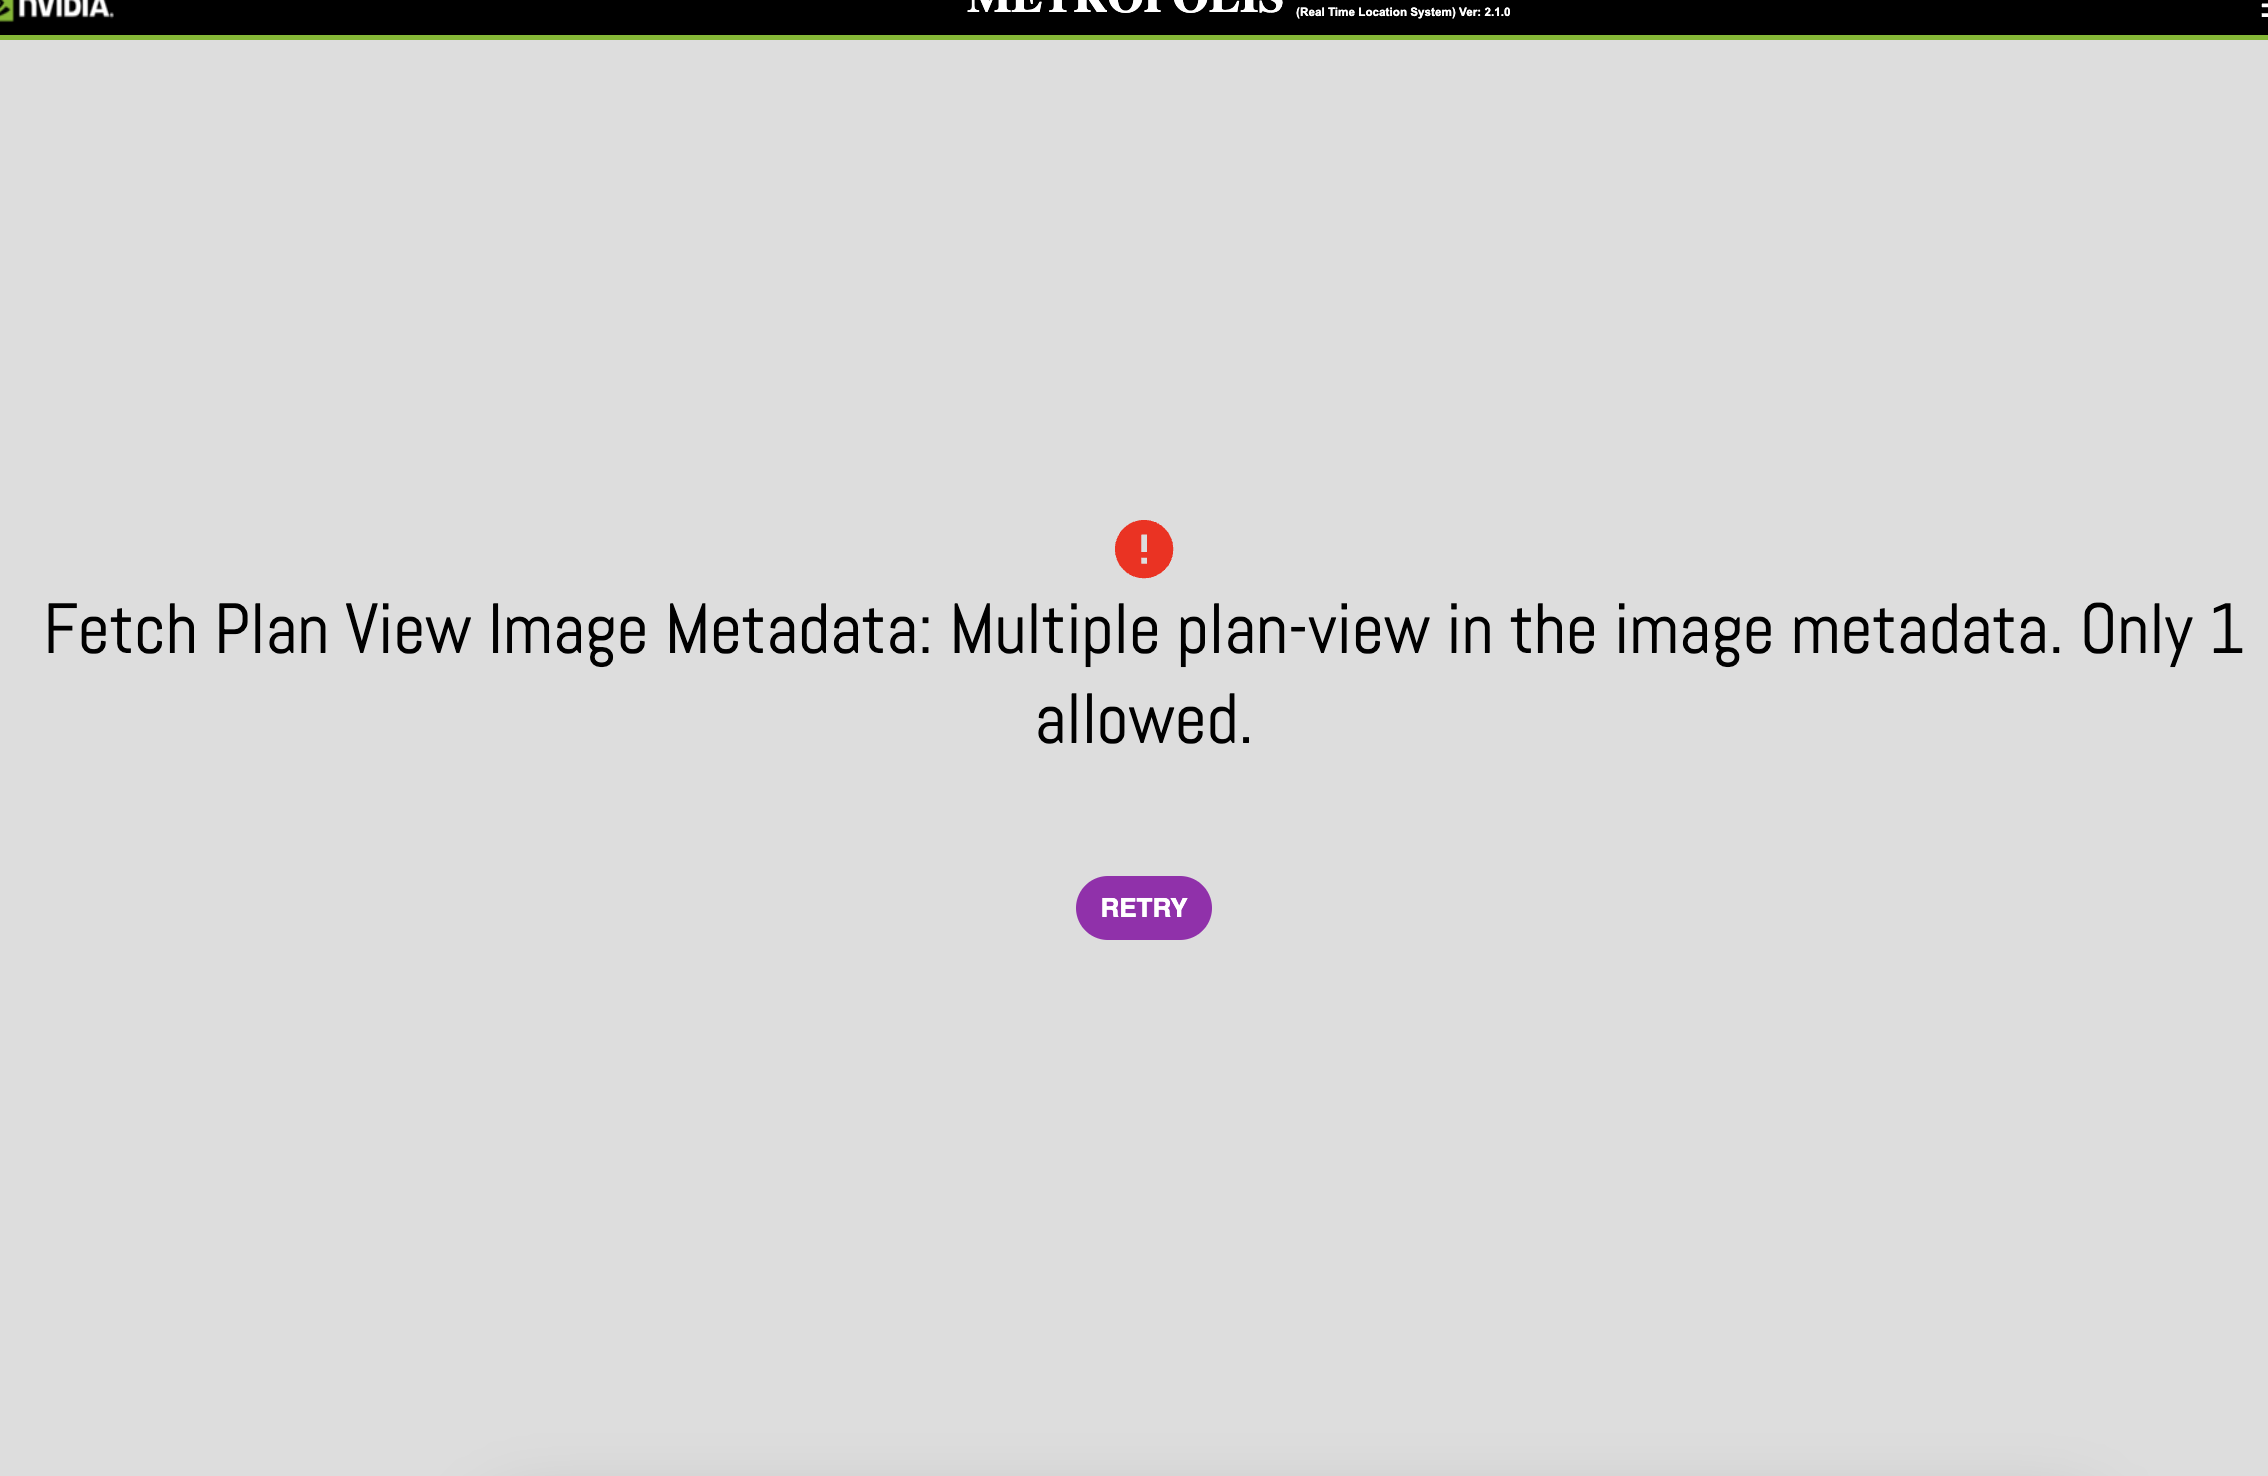
When I upload imageMetadata.json on UI, UI says “Fetch Plan View Image Metadata: Multiple plan-view in the image metadata. Only 1 allowed”.
UI currently supports single floor plan. Error seen in UI will look as follows
Following are the workarounds available:
Option 1: If you are using docker compose, then you can replace the file in the directory structure (eg.
metropolis-apps-standalone-deployment/docker-compose/<app-name>/calibration/sample-data/images/imageMetadata.jsonandmetropolis-apps-standalone-deployment/docker-compose/<app-name>/calibration/sample-data/images/<plan-view>) before bringing up the app. If an existing app was already deployed, then it should be taken down before this change is made (because elasticsearch’s calibration image index has to be cleaned).Option 2: In case you don’t want to redeploy, you can use
/config/calibration/delete-imagesAPI endpoint to delete the current set of images. The request to this endpoint can be made by using your favourite HTTP client. To get the current set of plan-view images, make a GET request to/config/calibration/image-metadataendpoint. Once deleted, you can upload the new plan-view image and imageMetadata.json via the UI. - Reference curl commands to clean up previously loaded plan-view imagesplace=$(curl -X GET 'http://<app_api_url>/config/calibration/image-metadata?view=plan-view' | jq '.imageMetadata[0].place') curl -X POST 'http://<app_api_url>/config/calibration/delete-images' -H 'Content-Type: application/json' -d '{ "calibrationImages": [ { "place": '${place}', "view": "plan-view" } ] }'
What are effective tripwire counts?
A person may loiter along the tripwire and this will result in multiple IN & OUT events based on the tripwire definition which can be x number of detections before and after the tripwire.
The web-API returns two counts: effective count and actual count. The UI displays the effective count which takes care of the loitering condition.
See kpi-tripwire-counts for more information.
Why am I observing decoding errors like “”[h264 @ 0x55e1c94e5080] error while decoding MB 43 34, bytestream -32”” while playing RTSP videos served by VST in jupyter notebook?
These are decoding errors which are harmless and can be ignored. Despite these errors appearing, the video will continue to play for long run without significant disruption.
Bad data is being shown in UI
The FPS of the data may be lower than expected. The expected FPS of sample videos is 30. The current FPS of data can be checked in DeepStream logs and mdx-raw-* index-pattern in Kibana.
Why is the deepstream showing low FPS for certain sensors?
This issue may originate with the input sensors itself. Go to RTSP Stream QOS section in Debug tab of VST UI to check if the sensors are streaming with correct FPS. FPS details can be checked by enabling the Stream QOS stats and then selecting the particular sensor.
If the input sensors do not have any issues, then it could be caused due to overutilization of GPU.
For docker compose environment, current utilization of the GPU can be checked using nvidia-smi in CLI.
For K8s environment, it is recommended to check the GPU utilization using Grafana. If the drivers are managed using CNS based gpu-operator then following command can also be used to check the GPU utilization:
for i in `kubectl get pods -n nvidia-gpu-operator -l app=nvidia-driver-daemonset --no-headers| awk '{print $1}'` ; do echo $i ; kubectl exec -it $i -n nvidia-gpu-operator -- nvidia-smi; done
If you are consistently observing low FPS, try reducing the number of streams assigned to each GPU.
Offline maps in UI reference Apps?
The current People Analytics UI Apps use react library https://www.npmjs.com/package/@react-google-maps/api to interface with Google Maps Live servers to obtain processed maps and show it on UI. This assumes internet connectivity and doesn’t work in offline mode.
To use offline maps a developer would need to modify the UI reference apps code in order to incorporate functionality to use offline (locally stored) maps. This probably entails writing code that would take offline maps assets, then take care of positioning and drawing geo-located UI elements on the map. The current react based Google Maps components in the reference apps that will need to be substituted with offline maps functionality are:
useLoadScript (https://react-google-maps-api-docs.netlify.app/#useloadscript) & GoogleMap (https://react-google-maps-api-docs.netlify.app/#googlemap): Used to load Google Maps in the UI application.
OverlayView (https://react-google-maps-api-docs.netlify.app/#overlayview): Used to draw custom icons/UI-widgets over Google Maps.
Marker (https://react-google-maps-api-docs.netlify.app/#marker): Used to draw place, camera etc., markers over Google Maps.
Polyline (https://react-google-maps-api-docs.netlify.app/#polyline): Used to draw target object trajectories over roads in Google Maps.
VST
This section provides answers to some of the frequently asked questions on using VST application:
I bought a new camera, plugged it in, used default password but cannot access video
Some cameras require that username/password is modified prior to the first use as a part of a third-party system (like - for example - VST). In such situations, you will need to connect to the web page hosted by the camera itself. Attach your camera to the network bypassing VST host machine. Take note of its IP address, and launch a web page hosted by the camera (usually https://192.168.1.xxx). The web page will prompt you to alter the default username/password combination. Use your preferred settings.
Note
You will need to use the same settings to allow VST to access that camera through the web-based VST UI interface. See the following Q/As.
When opening web UI at localhost:81 nothing happens
Make sure you type in https:// in front of the address (i.e. https://localhost:81. the same goes for accessing VST WebUI from other hosts on the same subnet (e.g. https://192.168.x.y:81).
When opening web UI at https://localhost:81 I am getting security warnings
We do not distribute certificates with this release. A self-certification is required. Depending on which browser and which base OS system you use to view, the videos, messaging and differ. For example - if you use Chrome on MacOS, the following is likely to be displayed:
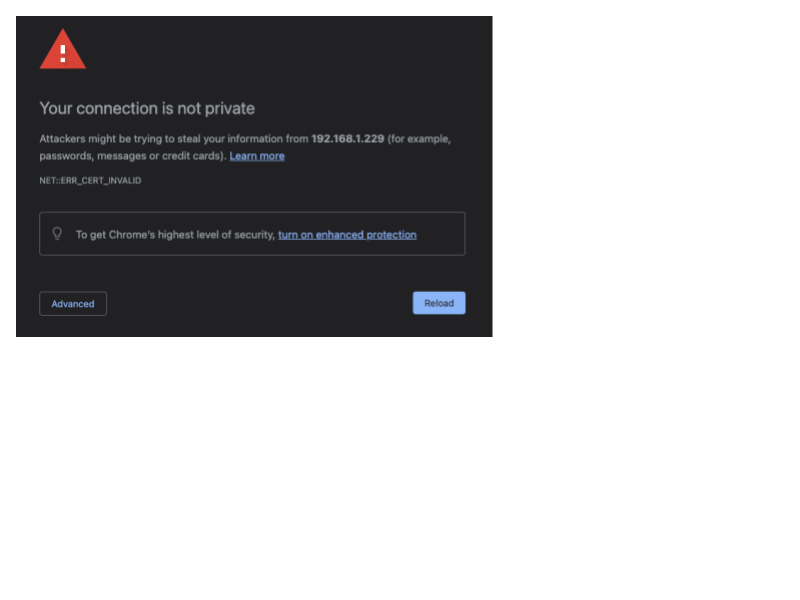
If you see this message, blindly type ‘
thisisunsafe’ to force Chrome to allow display of the VST web page. On Firefox the the following page is likely to be displayed: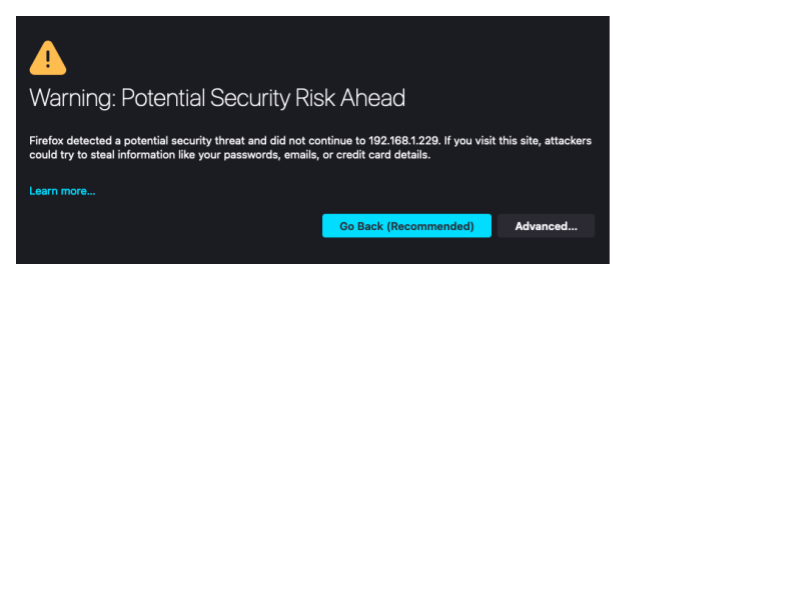
Click ‘Advanced’ and then ‘Accept Risk and Continue’ to force Firefox to allow display of the VST web page.
My camera was always streaming OK before. After I plugged it to the VST host through a switch (or directly) the VST web UI tells me it found my camera, but cannot stream from it.
The most common reason for VST reporting inability to stream is a mismatch between camera’s credentials, and default credentials stored by VST. For example - if you used the camera in the past with your preferred username/password credentials - you will need to input those credentials again through VST’s web UI. To do so - open the web UI, navigate to Device Management - Set Credentials, and update VST accordingly.
When I try to play live video stream I see a constantly rotating white circle
At EA stage we suggest Chrome on Windows, macOS or Linux platforms. We are aware of potential video streaming issues when using alternative browsers like Firefox or Safari.
After recording with VST for a couple of days my system becomes unstable
We noticed that not all SD cards are made the same. If you are booting from a SD card of relatively small capacity, and you target VST recordings to be stored on the same card, it is possible that after repetitive video overwriting (newer recordings will overwrite old ones - depending on policy set in VST configuration) certain parts of SD card become corrupted. Using SD cards of large capacity, high quality and especially ones with wear leveling, should alleviate the issue. If you add a mechanical drive attached to the host - this should eliminate the problem altogether.
I purchased a camera that is not on the list of tested ONVIF-S devices
All ONVIF-S compliant devices should work with this VST release. However, we noticed that not all cameras claiming ONVIF-S compatibility are fully compliant. If you have already exhausted your debugging options, contact us with the model and manufacturer of the camera you would like added to the compatibility list.
I provisioned the camera with the correct username and password, the camera is discovered, but I can still see errors
It is possible that the camera you recently purchased, or used in the past with another host, has been set to parameters that are not yet supported by VST. One of those is the H265 encoding standard. Unless you set the camera to H264, you might not be able to stream from it via the VST. Use the camera’s web server to alter the setting back to H264, and retry.
Multi-Camera Tracking
To read more about Multi-Camera Tracking, refer to the Multi-Camera Fusion section.
Why is the accuracy on my own dataset not as good as the results in the sample dataset?
It is expected that the models don’t perform as well on some datasets than on the sample dataset, due to a wide range of factors contributing to scene complexity. In general, to get better accuracy, we recommend fine-tuning the pre-trained models on additional use-case-specific data, recommended through TAO Toolkit.
Why are the evaluation results not shown? What is the format of the ground truth?
The sample dataset has been included in Track 1 of the 8th AI City Challenge, so we cannot provide the ground truth for evaluation. The format of the ground truth is as follows <camera_id> <object_id> <frame_id> <bbox_left> <bbox_top> <bbox_width> <bbox_height> <x> <y>. This format is similar but not identical to the MOTChallenge.
Why are there many missing detections in the final MTMC output?
There are two possibilities as follows:
When the number of streams to be processed in parallel is too large, it is a known issue that there will be frame drops in the perception pipeline. To address the issue, please reduce the input streams.
When applied to datasets very different from our training & validation data, it is likely that the detector and re-identification model will perform worse due to domain gaps.
The filtering thresholds under
preprocessingin the app config file may need to be adjusted to reduce false negatives.
The scores of my evaluation results are lower than expected. What could be the cause?
In the evaluation metrics, please compare the count of detections with the count of ground truths. If the count of detections is significantly smaller, there may be frame drops in the perception pipeline, as mentioned in the response to the question above.
If there is no frame drop, the problem is likely caused by misalignment of frame IDs in raw data and ground truth. Please adjust the groundTruthFrameIdOffset in app_config.json accordingly to align the frame IDs. To measure the offset of frame IDs, please use the visualization script and set vizMode as frames in viz_config.json.
How to fine-tune or replace existing models in the perception microservice?
Please refer to the Perception (DeepStream) for more details.
You can use the NVIDIA TAO Toolkit for training/fine-tuning the models with your own data. You can export your own models as ONNX files or TensorRT engines that can be deployed to the DeepStream perception pipeline. Please adjust the DeepStream configurations accordingly to optimize the accuracy and performance.
When the filter for time duration in the web UI is small, why is there no event displayed?
Note that the filter for time duration needs to be larger than the app config parameter of micro-batch interval kafkaMicroBatchIntervalSec. Otherwise, no event will be displayed.
How to save the raw data as input to MTMC batch processing and visualization?
For batch processing or visualization mode with MTMC microservice (more on MTMC microservice & end-to-end eval in batch mode), the raw data can be logged from the Kafka topic mdx-raw.
You can set msg-conv-payload-type=1 in the DeepStream configuration mtmc_config.txt to push the JSON-format messages to mdx-raw.
When msg-conv-payload-type=2 the protobuf messages are sent to mdx-raw.
The Kafka messages can be logged to an output file by running the command python3 consumer.py | tee <output file> with the script consumer.py defined as follows.
from kafka import KafkaConsumer
from json import loads
import uuid

consumer = KafkaConsumer(
    'test',
    bootstrap_servers='127.0.0.1:9092',
    auto_offset_reset='latest',
    enable_auto_commit=True,
    group_id=str(uuid.uuid1()),
    value_deserializer=lambda x: loads(x.decode('utf-8'))
)

# do a dummy poll to retrieve some message
consumer.poll()

# go to end of the stream
consumer.seek_to_end()

for i, event in enumerate(consumer):
    event_data = event.value
    print(event_data)
I have region(s) of interest defined in calibration. How can I use the information for filtering objects?
Enable filterByRegionsOfInterest in the app config.
Are there any additional references on clustering algorithms available?
Our implementations are based on the scikit-learn library’s modules of HDBSCAN and AgglomerativeClustering.
Why is there sudden jump in the trajectories of targets when running RTLS microservice?
RTLS requires that the fields of view (FOVs) of all cameras provide comprehensive and unbroken coverage of the entire area traversed by the targets. It is recommended that each target is covered by 3-4 camera views at any time. If the coverage of FOVs is sparse for a region, the online tracking may be unstable there.
Behavior Learning
To read more about Behavior Learning, refer to the Behavior Learning section.
How do I fine tune/improve clustering results?
Clustering can be modeled to fit a use case by changing the parameters mentioned in the Clustering Config section in the Behavior Learning. Start with tweaking the minPtsForCluster and minSampleForCore parameters. You can read more about them in the HDBSCAN documentation (they are referred to as min_cluster_size and min_samples respectively). The clustering parameters should be adjusted in proportion to the maxTrainingData parameter. If the default parameters do not work for every sensor, you may provide sensor specific clustering parameters.
When running the training pipeline, why do I get the message “model training skipped as data size is less than the minimum training data required of minTrainingData.”?
This can happen if the size of the ingested data is less than the value of minTrainingData. You can adjust the minTrainingData parameter to resolve this. This can also happen if minTrajectoryDistance is set to a high value causing many behaviors to filter out.
Why is the number of clusters during inference less than the number of clustered formed during training / Why are there some missing clusters in the UI?
It is possible that the model does not assign any behaviors to a particular cluster with a probability above noiseClassificationThreshold. This would lead to the cluster not showing up. Lower the noiseClassificationThreshold value and try again.
How do I interact with the storage layer?
The ingestion component ingests behavior data into a delta table. For more information, see delta tables quickstart.
Known Issues
Milvus loaded partitions/QBE query
Milvus doesn’t provide APIs to check which partitions are loaded or how much of a partition is loaded. This causes failures in search query. By adding some robustness, the failure has been limited to the first query and subsequent queries with longer time range. If the same query is made after waiting for some time, it should work as expected. This is because the partition is loaded when the query is made by the client.
Milvus Cron job (Web-API)
Web-API has a Cron job that unloads and loads partitions at midnight UTC time-zone. QBE queries made at this point of time will result in an error. Once the Cron job has finished, the queries should work as expected.
Bbox out of sync in reference apps
The bboxes should be in sync when using the reference apps as is. Occasionally if run the apps for extensively longer or run on live streams from untested cameras, the bbox may go out of sync. Bbox going out of sync most likely dues to timestamp related issues and can vary from case to case. Debugging would usually require a deep dive into the deployment system looking at the data flow underneath.
Moving dot out of sync with video in Occupancy Analytics app
The video and the moving dots are rendered independently in Web-UI. Therefore, the sync between them is best effort.
MTMC results don’t render thumbnail images/videos or bbox over an image
It is possible that the media server has deleted the video snippet because of the amount of storage used by the recordings. This may cause the videos/thumbnail image to not be rendered in Web-UI. The bbox may not appear over an image. This may happen if the metadata has been deleted by elastic curator or when the timestamp in the data sent by DeepStream (metadata stored in Elasticsearch) doesn’t match the VST timestamp.
It can also happen because VST hasn’t started recording yet,
MTMC/RTLS results look bad when the reference app runs for a longer duration
The sample videos provided for MTMC and RTLS apps are of 10 min and 6 min respectively. Each video gets looped by NVStreamer, this enables VST to process them as if they were live cameras. This looping leads to bad results. The results will show more number of unique objects (global ids) than the actual number of objects present in the location.
Person bounding boxes are not seen when using PeopleNet Transformer with max batch size as 1
The generated TensorRT engine for PeopleNet Transformer has a restriction that it only works for batch sizes larger than 1. In DeepStream configuration files, users should set max-batch-size in [source-list] group, batch-size and model-engine-file in [primary-gie] group to use batch size larger than 1 even if the number of input stream is 1. For other models, there is no such restriction.
PeopleNet Transformer in perception application fails with max batch size larger than 8
When launching PeopleNet Transformer with batch size larger than 8, the default TensorRT engine workspace size in configuration files may not enough, so error message NvDsInfer Error: NVDSINFER_CONFIG_FAILED will be printed. In DeepStream configuration files, the recommend minimum workspace-size in [primary-gie] group is 5120.
error GLib (gthread-posix.c): Unexpected error from C library during ‘pthread_setspecific’: Invalid argument. Aborting.
The issue is caused because of a bug in glib 2.0-2.72 version which comes with ubuntu22.04 by default. This is the glib version installed in Metropolis Perception docker image. The issue is addressed in glib2.76 and its installation is required to fix the issue (https://github.com/GNOME/glib/tree/2.76.6).
One camera randomly stopped giving FPS in the MTMC app in long run
Metropolis Perception Application stops streaming for one camera randomly (observed after 2 days). Workaround: To remove the affected camera and add it again using VST UI. In k8s setup, restarting the mdx-perception pod also fix this problem.
Note
Sometimes with RTSP streams the application gets stuck on reaching EOS. This is because of an issue in rtpjitterbuffer component. To fix this issue, a script update_rtpmanager.sh at /opt/nvidia/deepstream/deepstream/ has been provided with required details to update gstrtpmanager library. The script should be executed inside the MDX Perception container before running the Perception application.
Why am I getting error “GPUassert: invalid argument” when setting outputReidTensor: 1 in Gst-nvtracker low level config file?
The actual number of objects in all the streams exceeds the memory allocated for tracker re-identification embedding output. Users are recommended to set maxTargetsPerStream in DeepStream tracker configuration file to be larger than the total number of objects across all streams in the pipeline.
Can I have multiple Buildings in single project in Calibration Toolkit ?
Currently in Metropolis Calibration Tookit, there is only one building per project. The user can manually adjust the calibration.json to add buildings to each sensor.
When adjusting the Warped Image Crop, the Load Defaults does not load anything.
Currently in Metropolis Calibration Tookit, the Load Default is inactive when trying to adjust Warped Image crop.
Web UI Map Viz widget camera name tooltips don’t show complete
When hovering over a camera icon on the Map Viz widget, a tooltip with the camera name is supposed to appear right next to the icon. However, in some cases, the rendered tooltip gets cut off at the edge of the widget, making it unable to be read completely or causing most of it to be hidden.