Telemetry and Observability#
AI data center observability follows a similar model to traditional data centers, but the scale and complexity grow meaningfully. Specific challenges include GPUs and accelerators generating high-volume telemetry, diverse high-speed networks (Ethernet, InfiniBand, NVLink) requiring unified monitoring, higher data throughput demanding efficient collection and storage, and large-scale training coordination requiring correlated signals across thousands of GPUs. An AI data center requires a unified observability solution that provides visibility into operations, enabling high performance at scale and meeting tenant SLAs.
Observability Implementation Architecture#
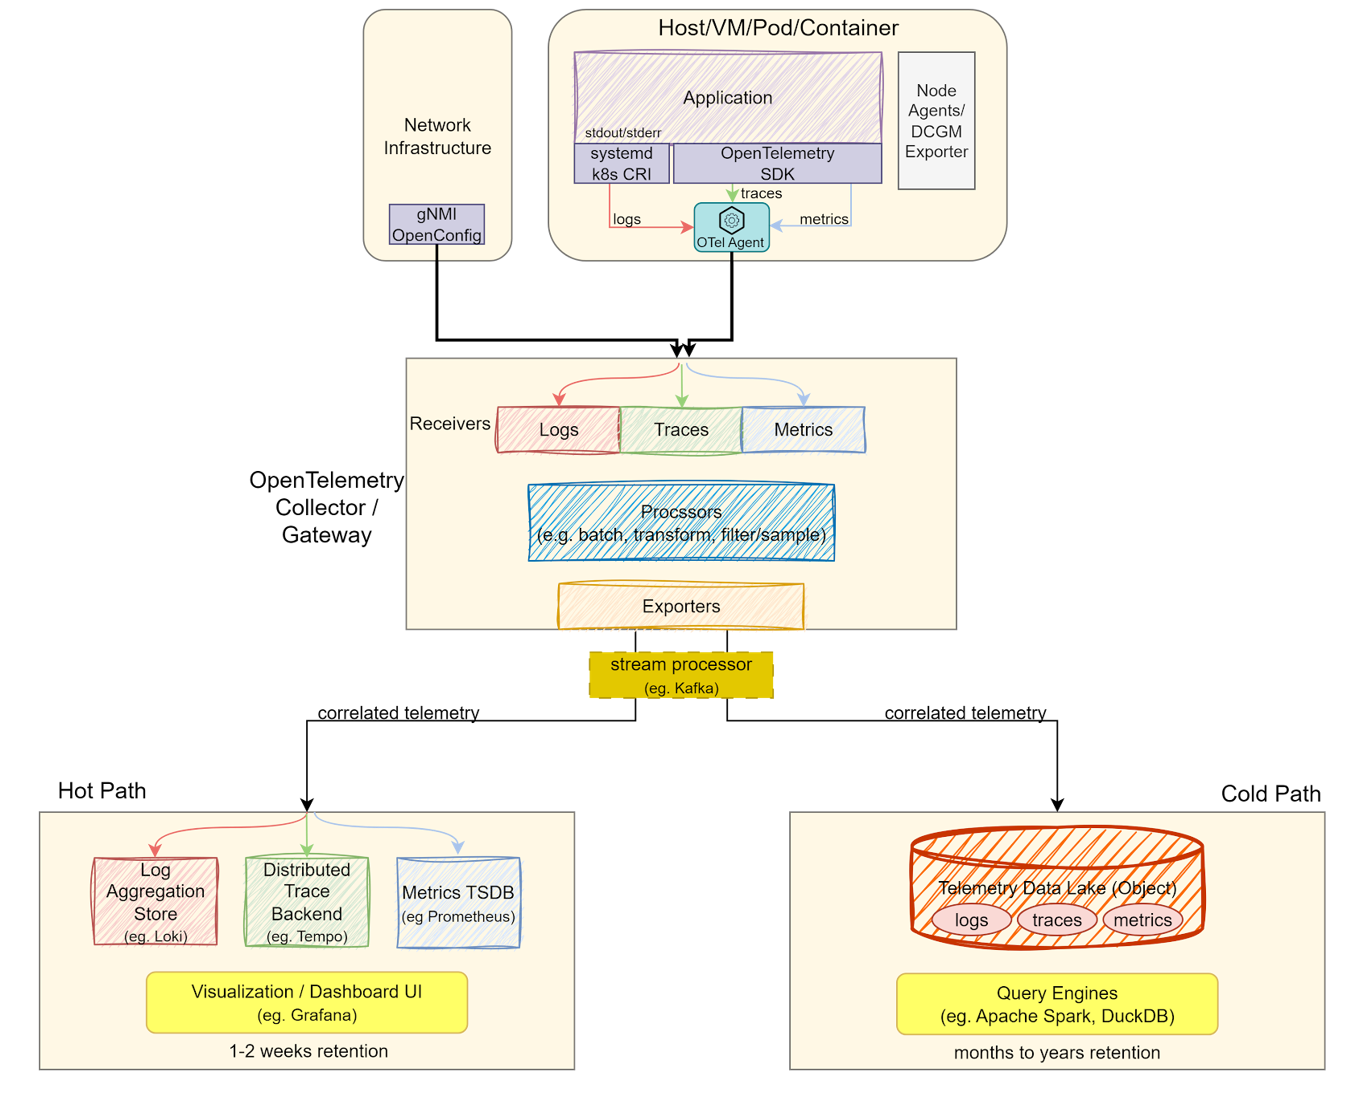
The architecture relies on three signal types: logs (event records from applications, system services, and hardware), metrics (measurements of system behavior such as latency, throughput, and GPU utilization), and traces (end-to-end path of requests or operations across distributed systems). These signals are harvested across the data center, normalized, and correlated through an OpenTelemetry (OTel) pipeline. Correlation via timestamps, resource IDs, and trace IDs is critical to relate signals to each other and accurately attribute them to tenants or services. The architecture is designed to be vendor-neutral, allowing partners to instrument their systems while balancing operational speed with long-term storage costs.
Data Generation and Collection: Data originates from three sources: applications (metrics and traces via OpenTelemetry SDK), infrastructure (system logs and GPU telemetry via DCGM Exporter), and network equipment (fabric health via gNMI/OpenConfig). An OTel Collector Agent runs on every node, performing local batching and enrichment before forwarding to the gateway via OTLP.
Ingestion and Processing: The OTel Collector Gateway provides centralized processing: filtering, sampling, transformations, and fan-out routing to multiple backends. A stream processor (Kafka) buffers data between the gateway and storage, preventing backend overload during traffic spikes from large GPU clusters.
Storage Backends: Storage splits into hot and cold paths. The hot path uses specialized stores (Loki for logs, Tempo for traces, Prometheus for metrics) for real-time monitoring, alerting, and incident response, with data retained for one to two weeks. The cold path writes to a Telemetry Data Lake (Parquet on object storage) for long-term analytics, capacity planning, and historical investigations, with data retained for months to years.