mlx5 Tx Datapath Tracing
The mlx5 Tx data-path tracing capability enables the user to gather the comprehensive information about packets' handling in PMD with timings, including the packet sending completion ones.
Specify the "meson" option:
--enable_trace_fp=
trueSpecify the c_args shoudl API:
-DALLOW_EXPERIMENTAL_API
The DPDK configuration examples:
            meson configure --buildtype=debug -Denable_trace_fp=true -Dc_args='-DRTE_LIBRTE_MLX5_DEBUG -DRTE_ENABLE_ASSERT -DALLOW_EXPERIMENTAL_API' build
meson configure --buildtype=debug -Denable_trace_fp=true -Dc_args='-DRTE_ENABLE_ASSERT -DALLOW_EXPERIMENTAL_API' build
meson configure --buildtype=release -Denable_trace_fp=true -Dc_args='-DRTE_ENABLE_ASSERT -DALLOW_EXPERIMENTAL_API' build
meson configure --buildtype=release -Denable_trace_fp=true -Dc_args='-DALLOW_EXPERIMENTAL_API' build
If the sending completion timings are crucial, the NIC should be configured to provide real-time timestamps (set the REAL_TIME_CLOCK_ENABLE NV settings parameter to TRUE). For example:
sudo mlxconfig -d /dev/mst/mt4125_pciconf0 s REAL_TIME_CLOCK_ENABLE=1
The trace data are committed to the specified folder on the EAL cleanup. Optionally, the data commit can be explicitly triggered by the application via the rte_trace_save() API call.
The following are the EAL parameters that control the trace capability in runtime:
|
Parameters |
Description |
|
--trace=pmd.net.mlx5.tx |
The regular expression to enable the trace points with matching names. By default, all the trace points are disabled. |
|
--trace-dir=/var/log |
[Optional] Trace storing directory. The default is: |
|
--trace-bufsz=<val>B|<val>K|<val>M |
[Optional] Trace data buffer size per thread. The default is 1MB |
|
--trace-mode=overwrite|discard |
[Optional] Selects trace data buffer mode. |
The gathered trace data can be analyzed with a Python script below. To parse the trace, the data script uses the Babeltrace2 library. The package should be either installed or built from source code as shown below:
            git clone https://github.com/efficios/babeltrace.git
cd babeltrace
./bootstrap
./configure –help
./configure --disable-api-doc --disable-man-pages --disable-python-bindings-doc --enable-python-plugins --enable-python-binding
Running the Analyzing Script
The analyzing script is located in the folder: ./drivers/net/mlx5/tools
It requires Python3.6, Babeltrace2 packages and it takes the only parameter of trace data folder. For example:
./mlx5_trace.py /var/log/rte-2023-01-23-AM-11-52-39
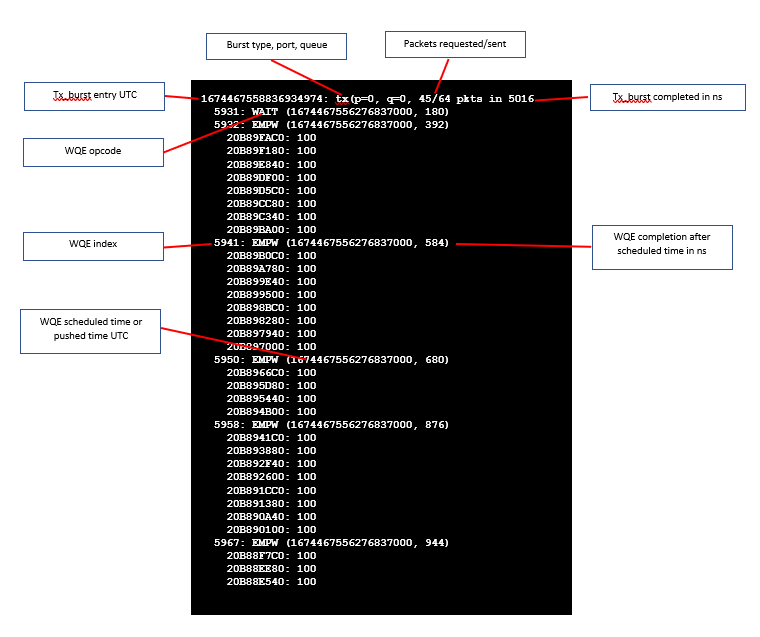
Interpreting the Script Output Data
All the timings are given in nanoseconds.
The list of Tx (and coming Rx) bursts per port/queue is presented in the output. Each list element contains the list of build WQEs, and each WQE contains the list of packets to send.