Appendix: Splunk Integration with NVIDIA Products
Splunk automatically clusters millions of log records in real time back into their patterns and finds connections between those patterns to form the baseline flows of each software individually, thus enables you to search, monitor and analyze that data to discover powerful insights across multiple use cases.
This appendix provides a guide on the first steps with Splunk and helps you to begin enjoying reduced time in detecting and resolving production problems.
1. Download Splunk and extract the Splunk Enterprise version. (Splunk software is available as an RPM or TGZ.)
2. Create a Splunk User /group. Run:
            [root@server] groupadd splunk
[root@server] useradd -d /opt/splunk -m -g splunk splunk
3. Splunk installation. Run:
            [root@server] tar -xzvf splunk-7.0.0-c8a78efdd40f-Linux-x86_64.tgz
[root@server] ls
4. A new folder called Splunk is created.
            [root@server] cp -rp splunk/* /opt/splunk/
[root@server] chown -R splunk: /opt/splunk/
[root@server] su - splunk
[splunk@server] cd bin
[splunk@server] ./splunk start --accept-license
Now you can access your Splunk WebUI at http://IP:8000/ or http://hostname:8000/. You need to make sure that port 8000 is open in your server firewall.
In this example we are not using the default UDP port 514 to show that any other port can be also used.
5. In order to add a task, the switch must be configured to send logs to our Splunk server. Run:
            switch > enable
switch # configure terminal
switch (config) # show snmp
SNMP enabled:         yes
SNMP port:            161
System contact:
System location:
Read-only communities:
   public


Read-write communities:
   (none)

Interface listen enabled: yes
No Listen Interfaces.
switch (config) # snmp-server host 10.212.23.1 informs port 8597
switch (config) # snmp-server host 10.212.23.1 traps port 8597
switch (config) # snmp host 10.212.23.1 informs 8597
switch (config) # snmp host 10.212.23.1 traps  8597


Summary configuration:


switch (config) # show running-config
## Logging configuration
##
   logging 10.212.23.1
   logging 10.212.23.1 port 8597
   logging 10.212.23.1 trap info
   logging 10.212.23.1 trap override class events priority err
   logging monitor events notice
   logging receive
## SNMP configuration
no snmp-server host 10.209.21.221 disable
snmp-server host 10.209.21.221 traps port 8597 version 2c
no snmp-server host 10.212.23.1 disable
snmp-server host 10.212.23.1 traps port 8597 version 2c 8597
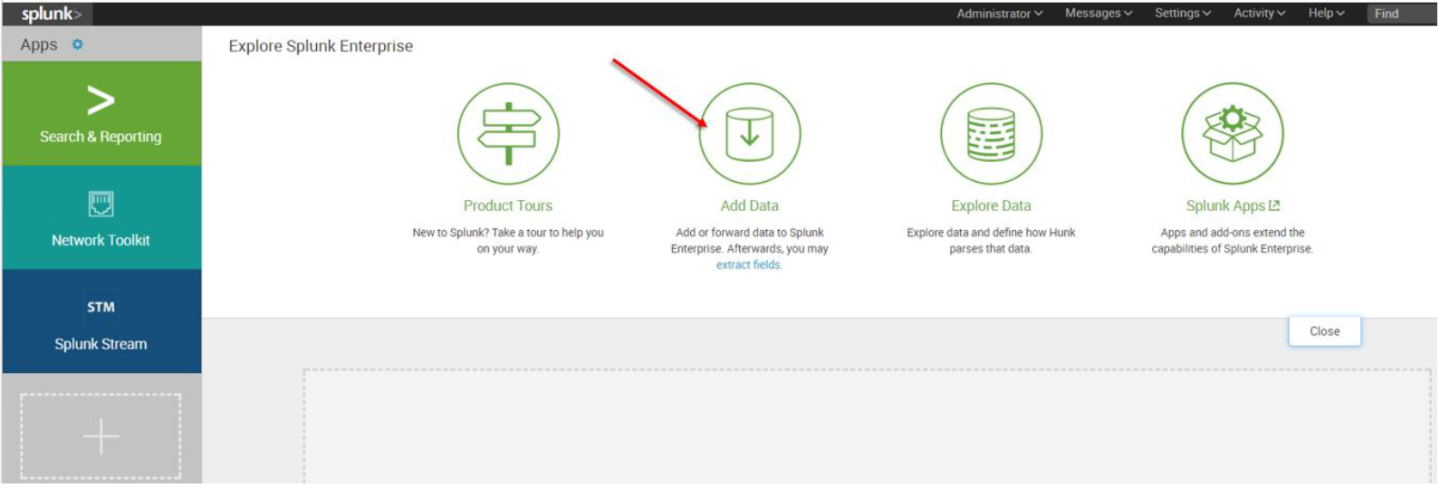
6. The first screen encountered after signing into the Splunk WebUI includes the “Add Data” icon.
7. The “Add Data” tab opens up with three options: Upload, Monitor, and Forward. Here our task is to monitor a folder, so we click Monitor. to proceed
In the Monitor option, the following four categories are available:
File & Directories – monitor files/folders
HTTP Event Collector – monitor data streams over HTTP
TCP/UDP – monitor service ports
Scripts – monitor scripts
8. Per our current purpose, we choose TCP/UDP option.
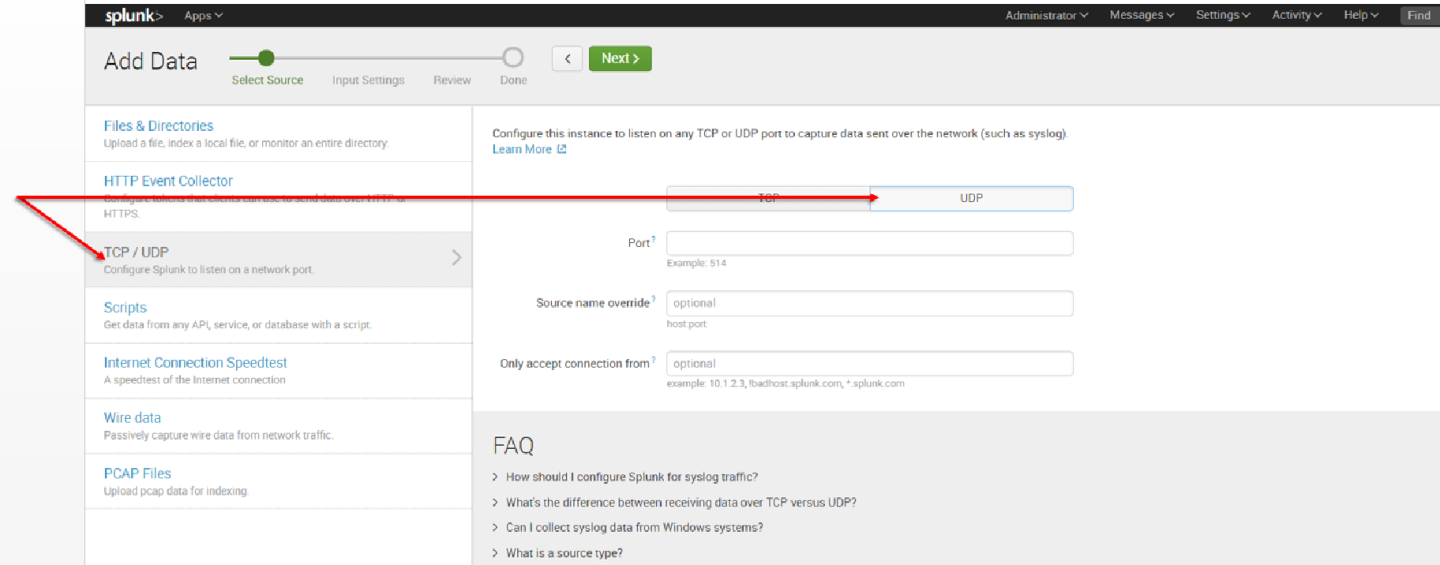
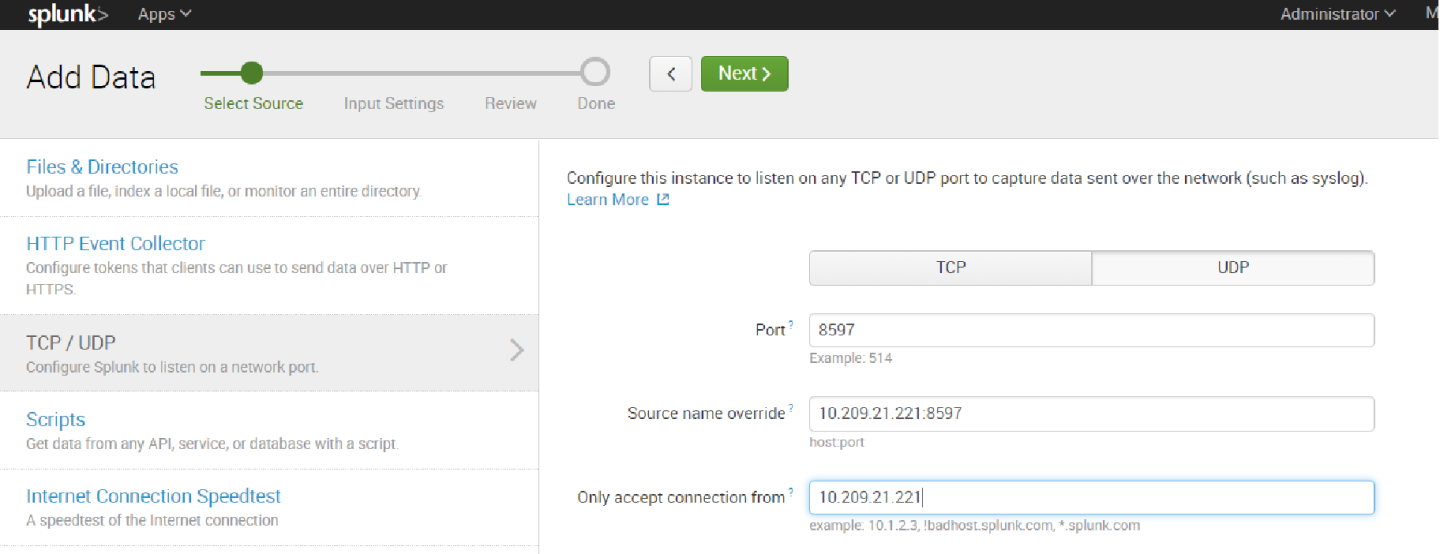
9. Click the TCP or UDP button to choose between a TCP or UDP input, and enter a port number in the “Port” field.
10. In the “Source name override” field, enter a new source name to override the default source value, if required.
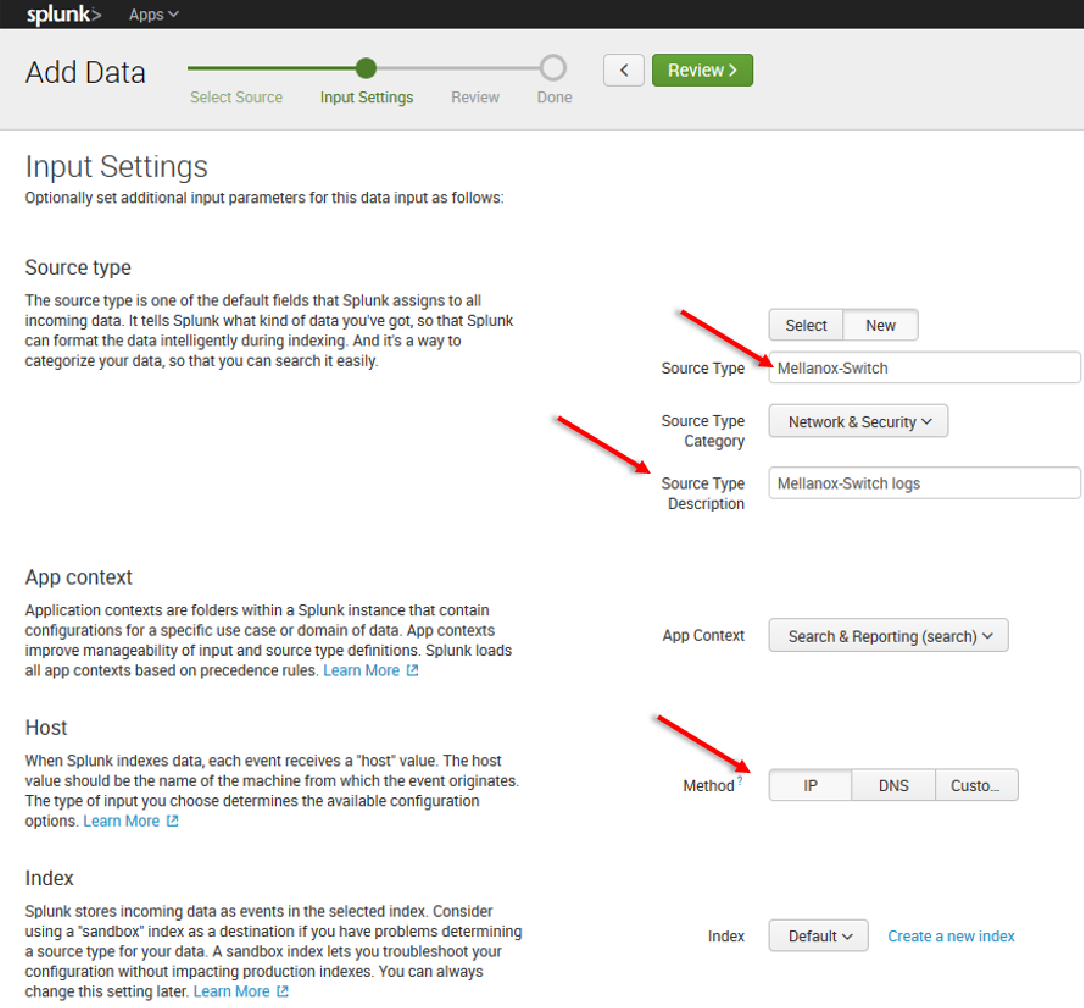
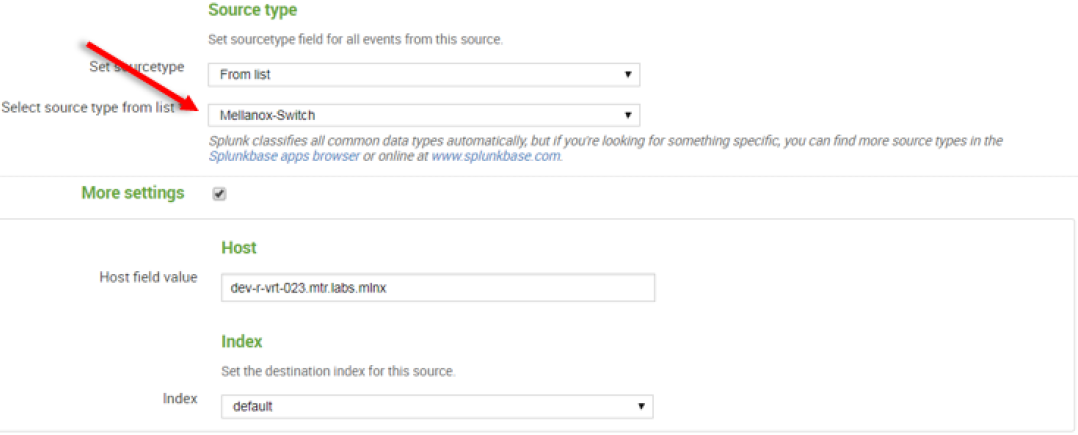
11. Click “Next” to continue to the Input Settings page where we will create a new source type called Mellanox-Switch.
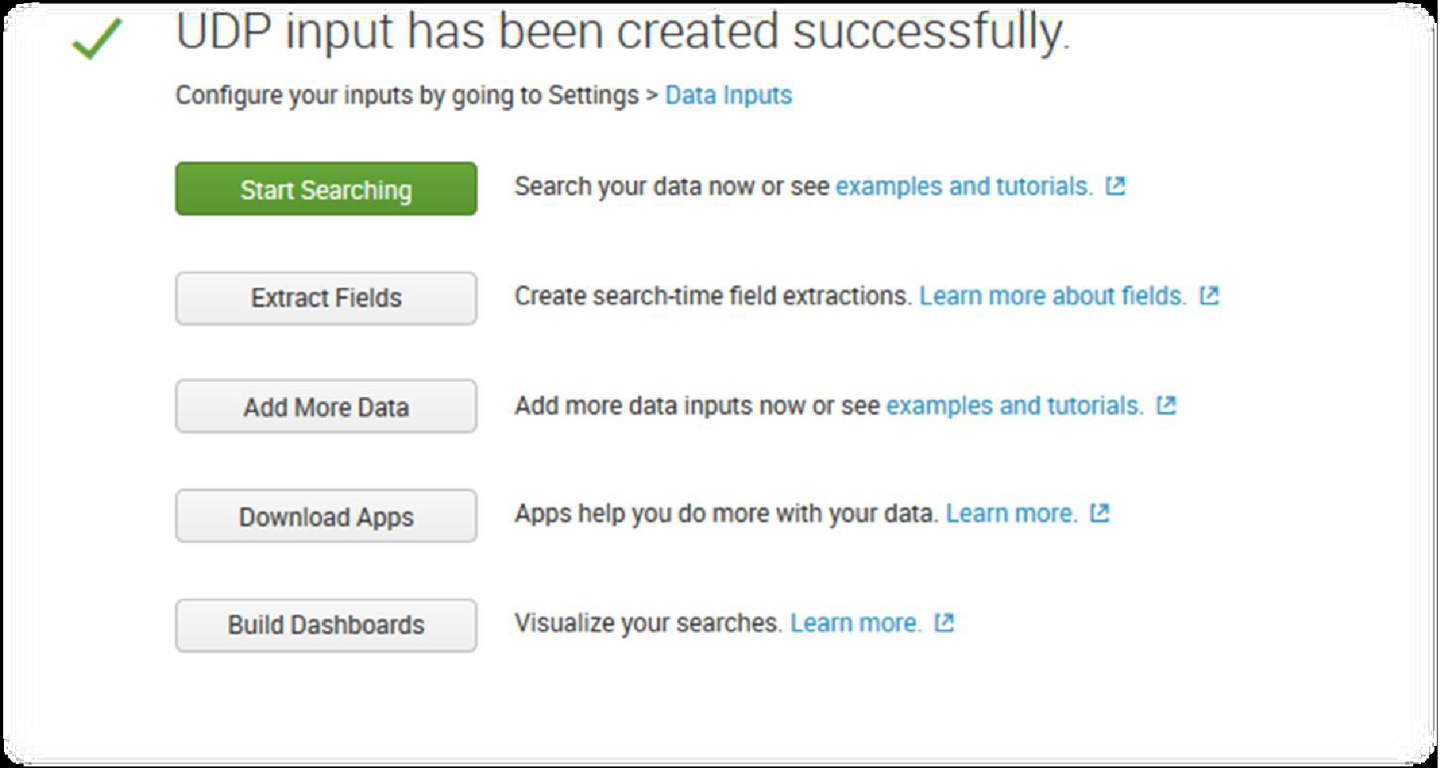
12. Click Next > Review > Done > Start Searching
SNMP represents an incredibly rich source of data that you can get into Splunk for visibility across a very diverse IT landscape.
SNMP agents may also send notifications, called Traps, to an SNMP trap listening daemon.
Getting Started
Browse to Splunkbase and download the SNMP Modular Input from https://splunkbase.splunk.com/app/1537/.
To install, simply untar the file to SPLUNK_HOME/etc/apps and restart Splunk.
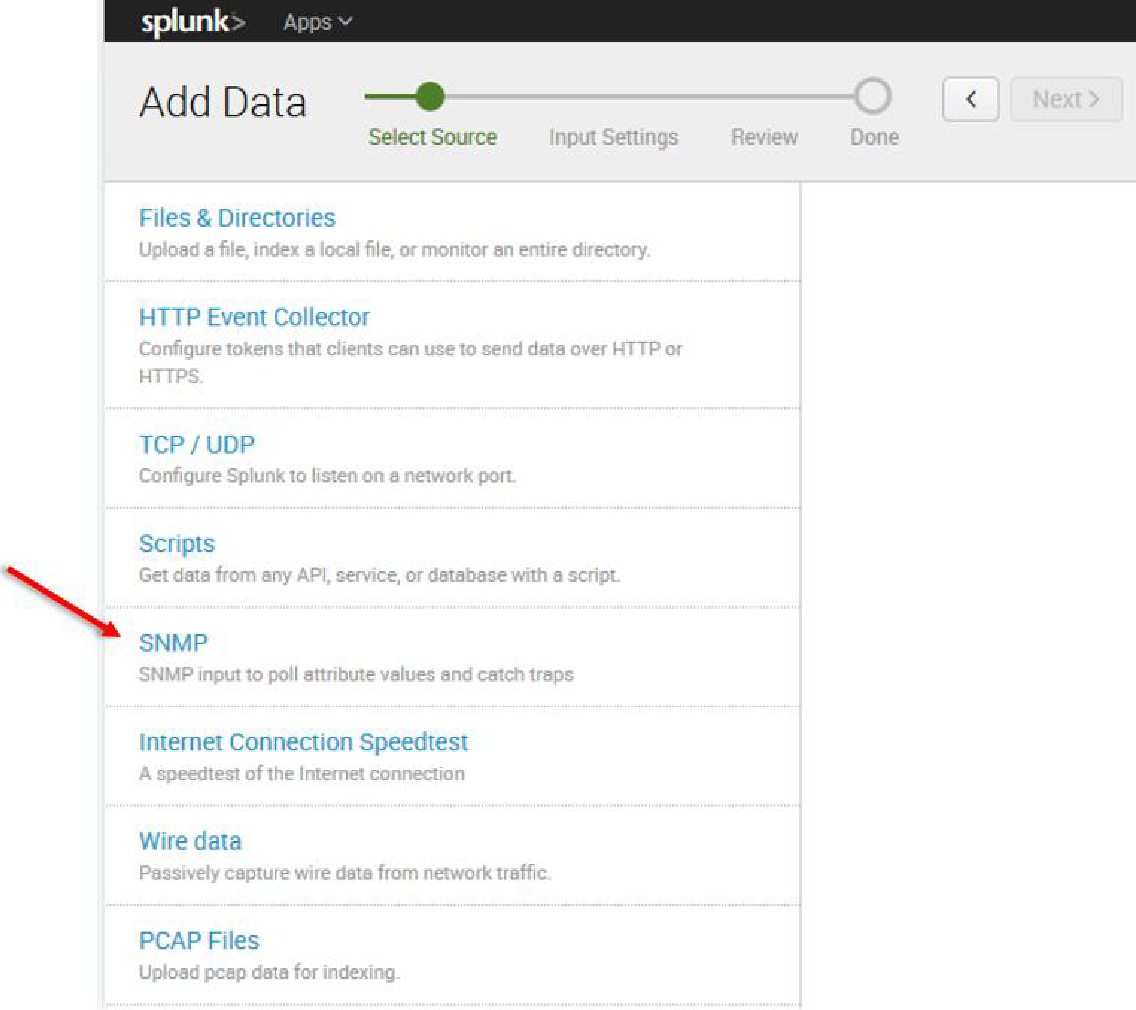
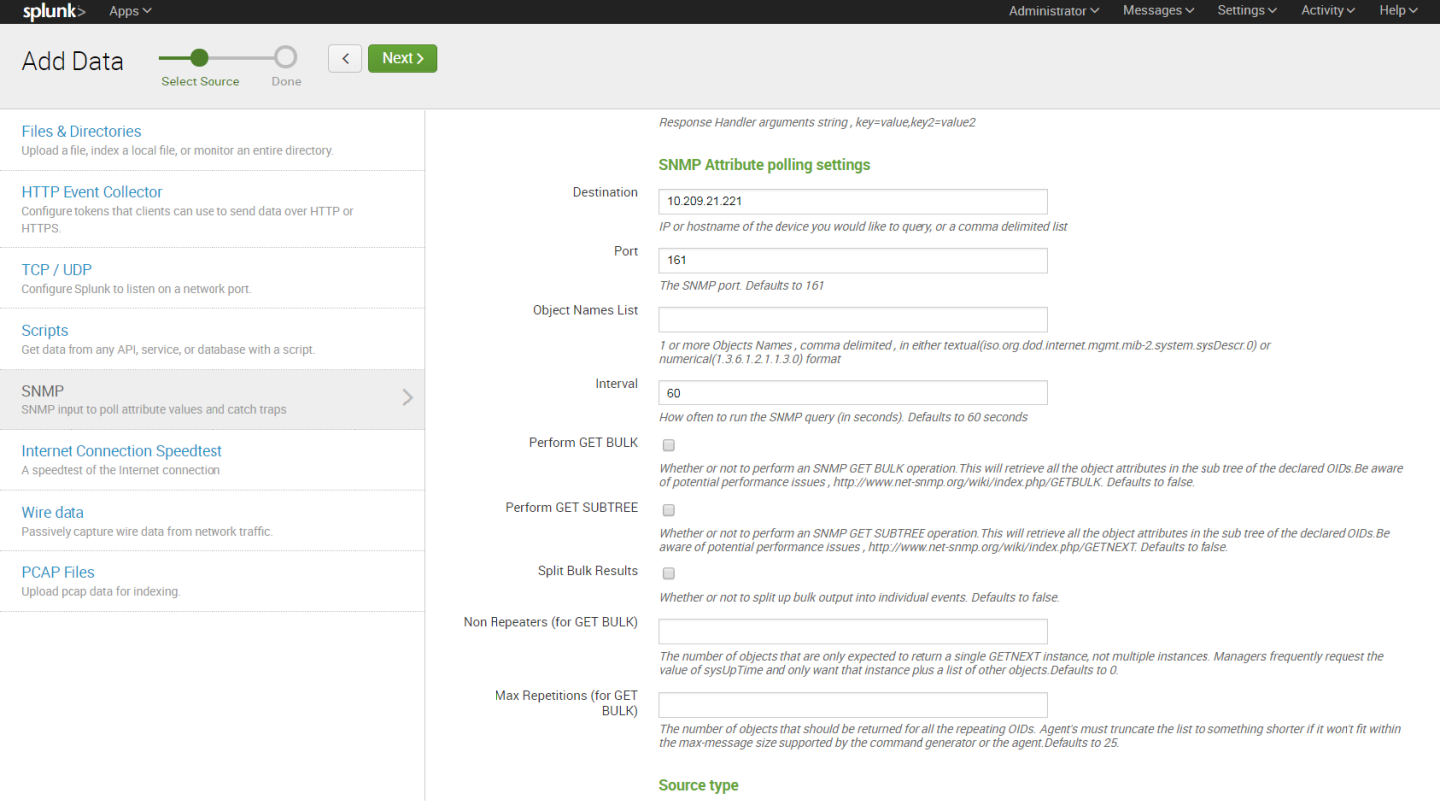
Configuration
Login to the Splunk WebUI and go to Manager > Add Data > Monitor > SNMP > New, and set up your input data.
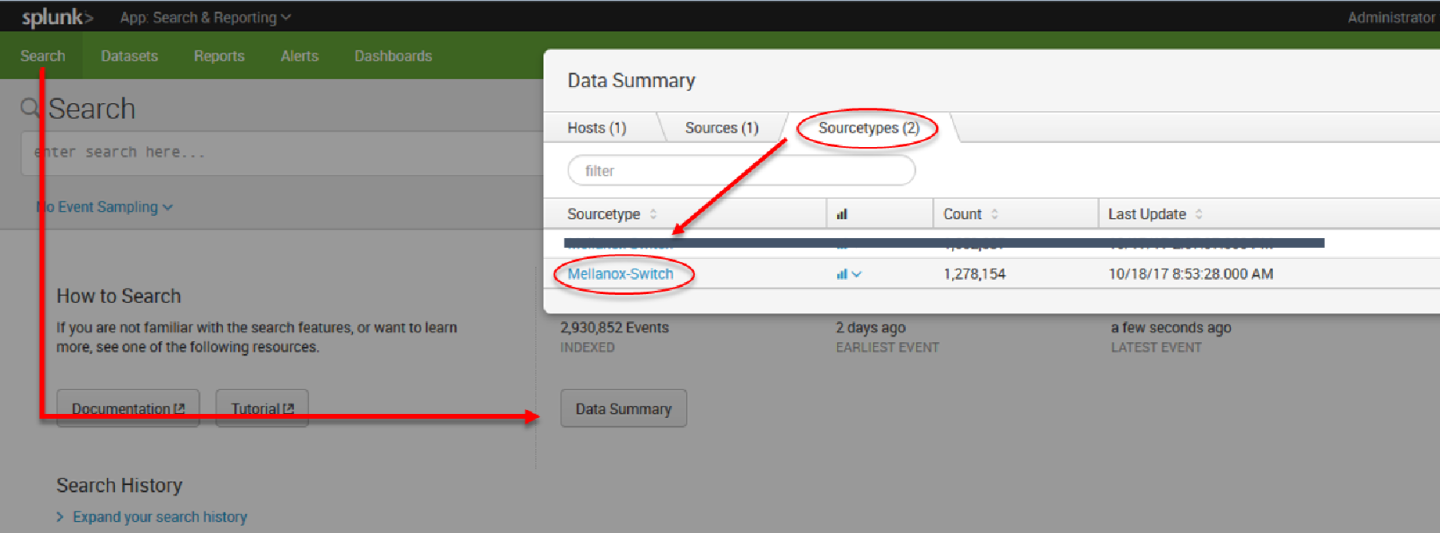
13. After configuration is complete it is recommend to run Mellanox-Switch again: Search > Data Summary > Sourcetypes > Mellanox-Switch.
14. Select “Mellanox-Switch” and “Add to search”.
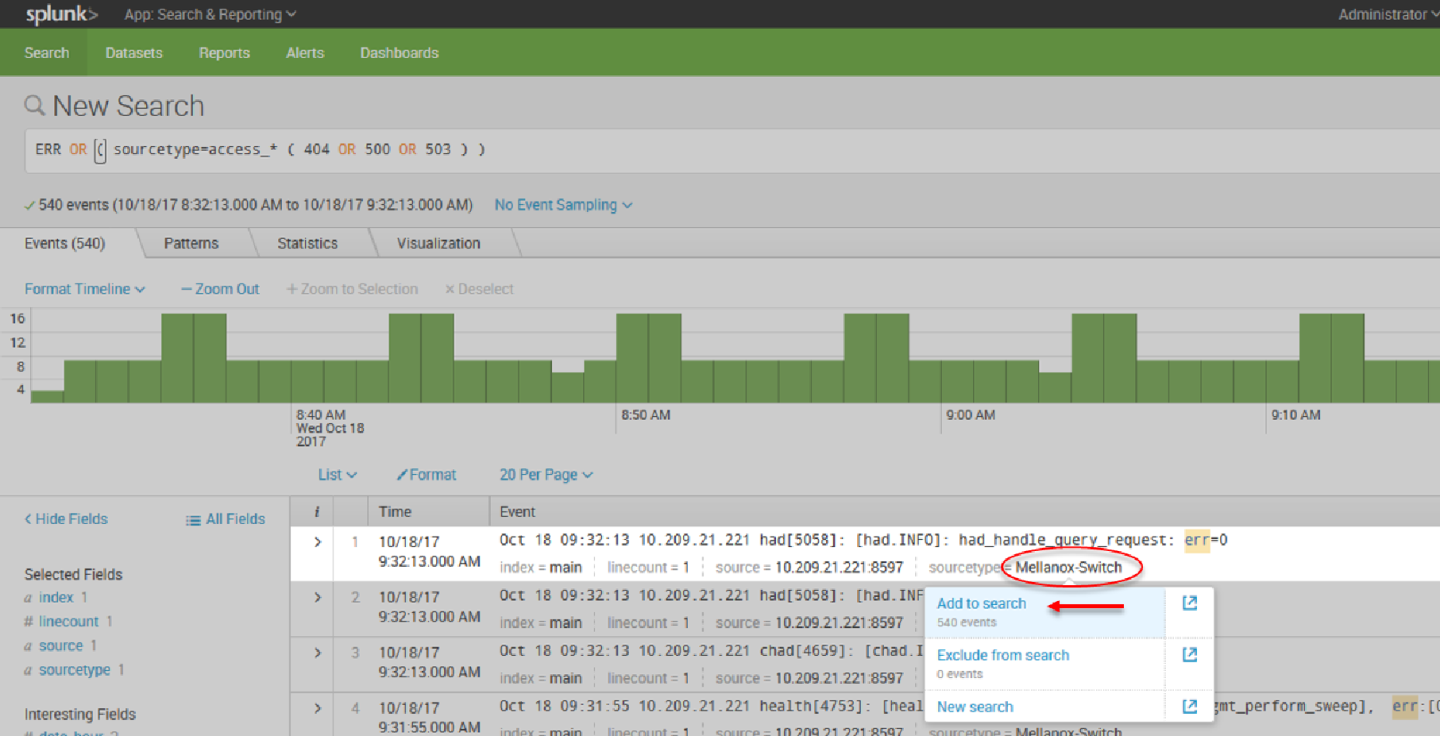
15. You can add to search any value that is relevant for you.
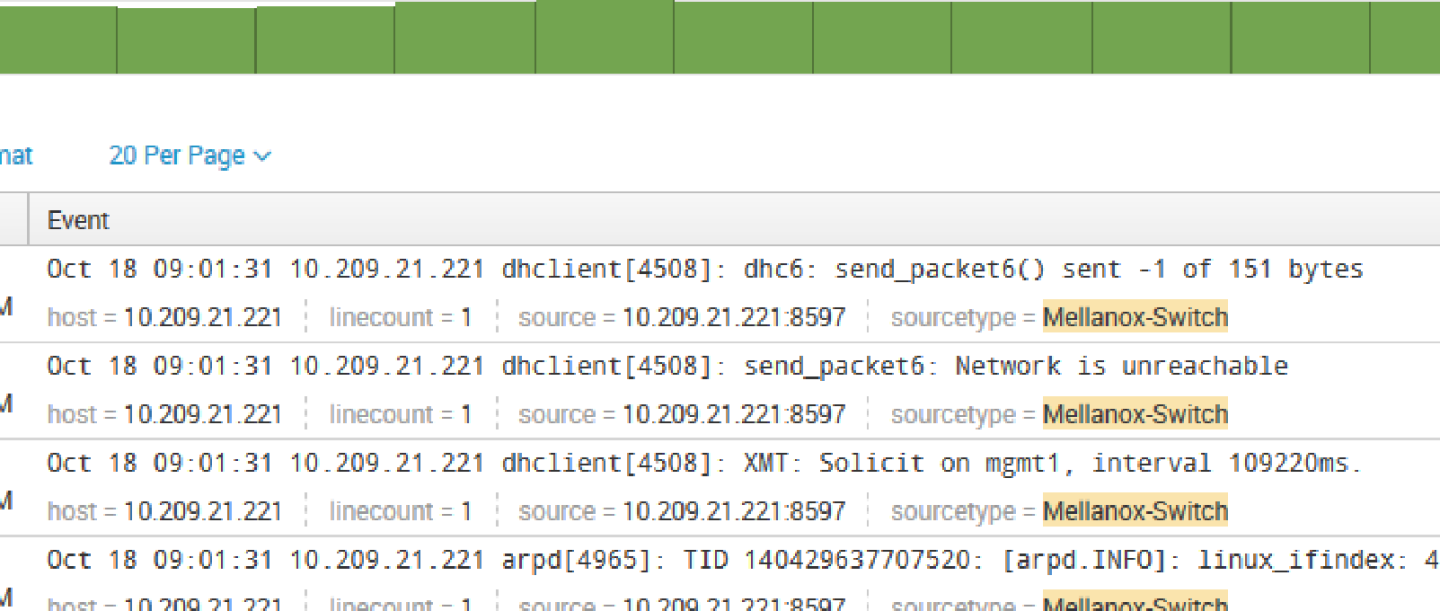
Patterns can be viewed not on real time and you can create alert on most repeatable events.