Telemetry
UFM Telemetry allows tracking network bandwidth, congestion, errors, and latency. UFM offers the following telemetry features:
Real-time monitoring views
Multiple attributes monitoring
Intelligent Counters: provide error and congestion counters
InfiniBand port-based error counters
InfiniBand congestion XmitWait counter-based congestion measurement
InfiniBand port-based bandwidth data
The following actions may be taken with the telemetry session panels:
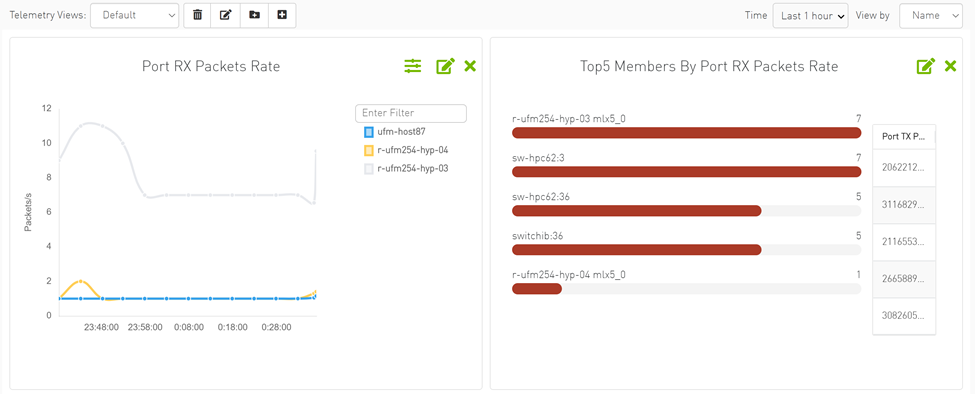
Rearranging – using a simple drag-and-drop function
Resizing – by hovering over the panel's border
It is also possible to get a larger view of a telemetry session by clicking the pop-out button on the top right-hand corner of each panel.
Telemetry Session Objects and Attributes
Monitored objects may be ports or devices in the fabric.
Monitored attributes can be raw counters or calculated counters:
A raw attribute is a simple attribute to be monitored (e.g., Port TX Wait)
A calculated attribute is an attribute that has been calculated based on one or more counters (e.g., PortXmitPktsRate)
Telemetry contains multiple views; the user can create, edit, and delete views.
Telemetry supports two types of panels, time-series which show the relationship between time and counter value for a specific device, and topX, which show all ports with pick by counter greater than topX value.
TopX is not supported in the case of the ibpm telemetry provider. The telemetry provider is hidden in this case.
The panel can be created by filling in the following model:
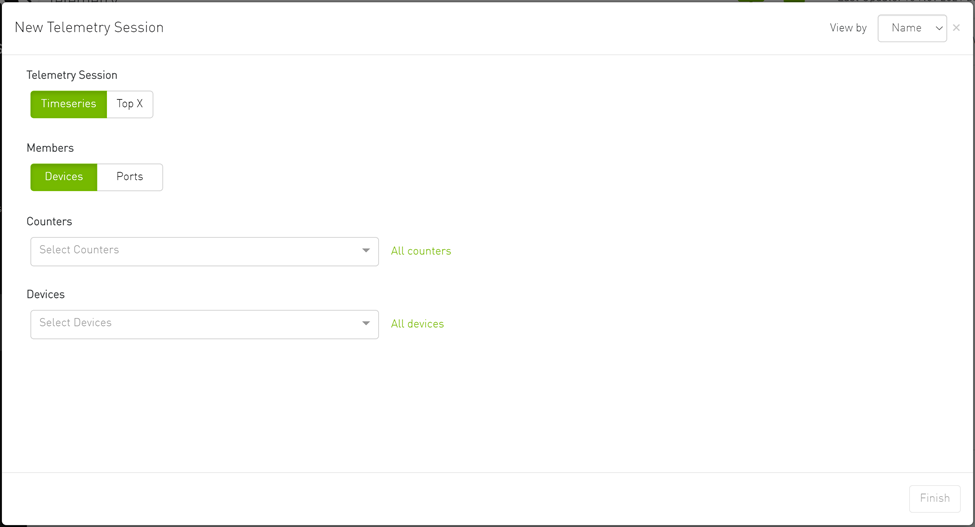
The user can select one of the following telemetry session modes:
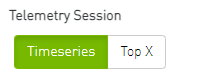
Timeseries: Provide the user with historical/live time-series graphs of the selected counters for the selected devices/ports.
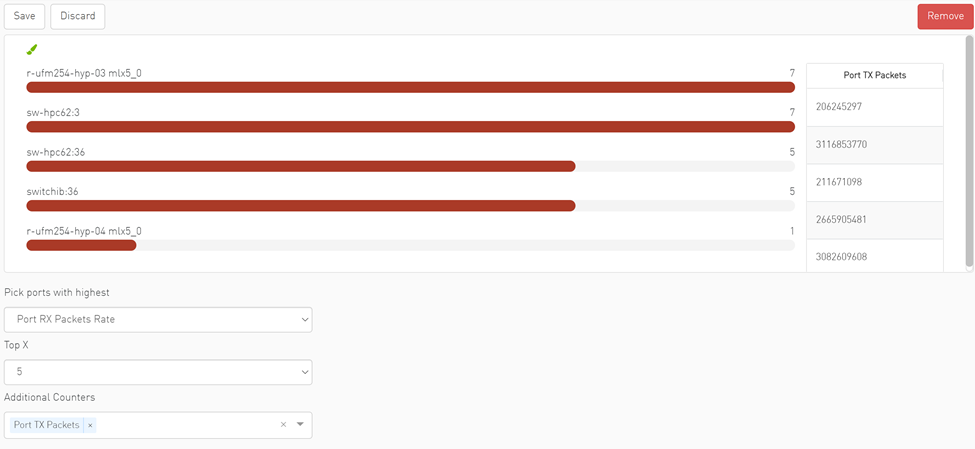
Top X: Provides the user with Top X ports by the selected counters (where X is 5, 10, 15, 20).
You can select the members grouping type; Devices or Ports:
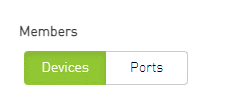
In case the selected telemetry session is Top-X, only the ports are supported.
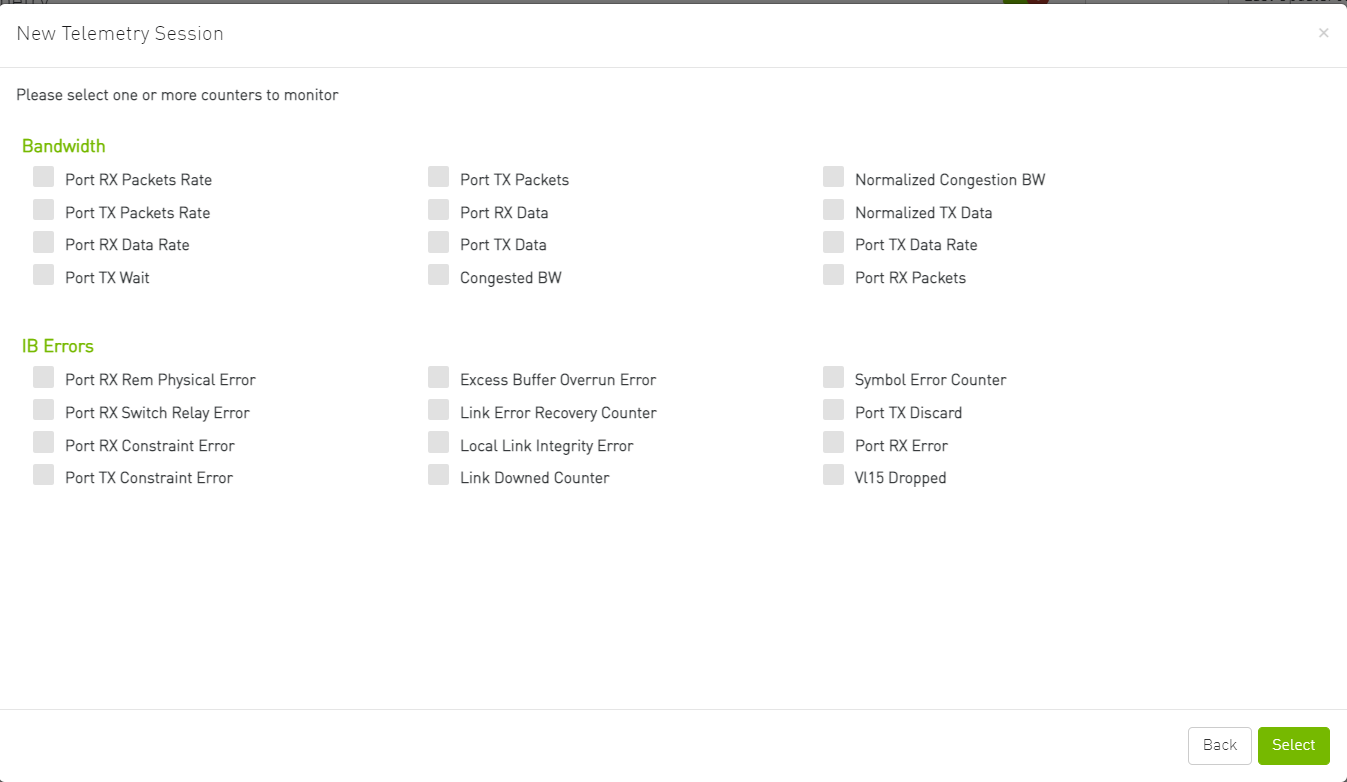
The user can select one or more counters from the counters dropdown menu:
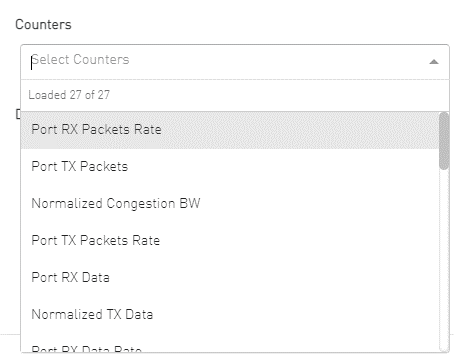
Alternatively, the user can get a full view of all the supported counters and select one or more by clicking on the "All Counters" button:
The user can select one or more devices/ports from the relevant dropdown menu:
Devices:

Alternatively, the user can choose to get a full view of the devices by clicking on the "All Devices" button:

com.atlassian.confluence.content.render.xhtml.XhtmlException: Missing required attribute: {http://atlassian.com/resource/identifier}value
Ports:
After switching from "Devices" to "Ports," you user can view the ports’ dropdown menu:
Alternatively, the user can choose to get a full view of the ports by clicking on the "All Ports" button.
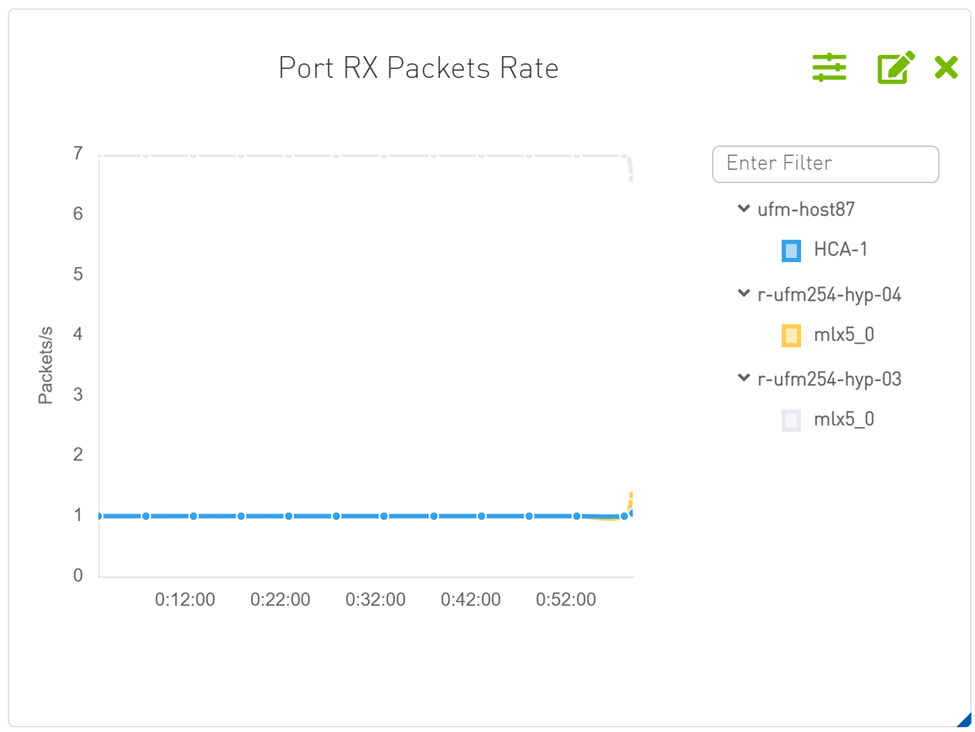
Data aggregation can be changed in the timeseries panel by grouping the members by device or ports; this functionality is an option in the context menu. Therefore, if the timeseries panel is created with the "Devices" members, the panel shows each port in an individual line by right-clicking and then grouping by ports.
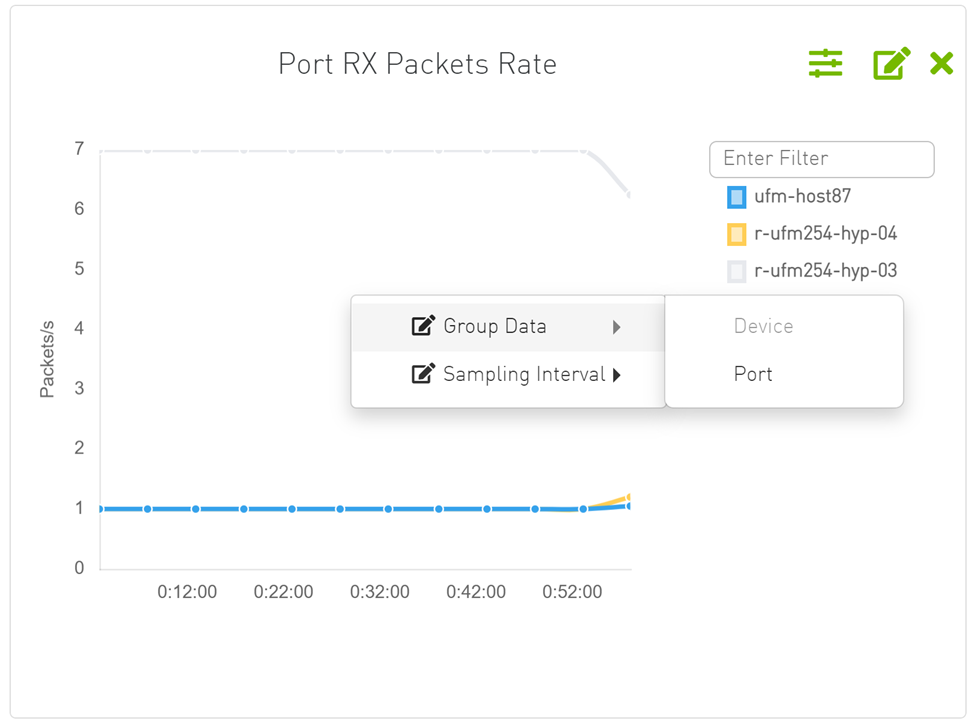
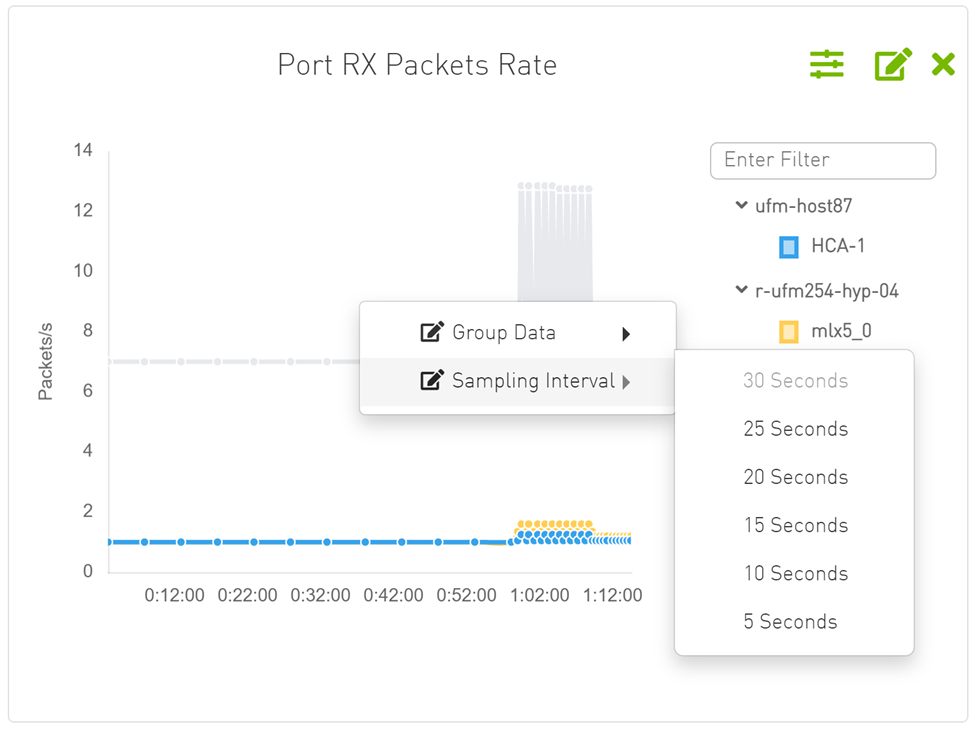
The Telemetry obtains live data from the server's each specific interval which equals the default session interval. The interval can be changed from the sampling rate option in the context menu.
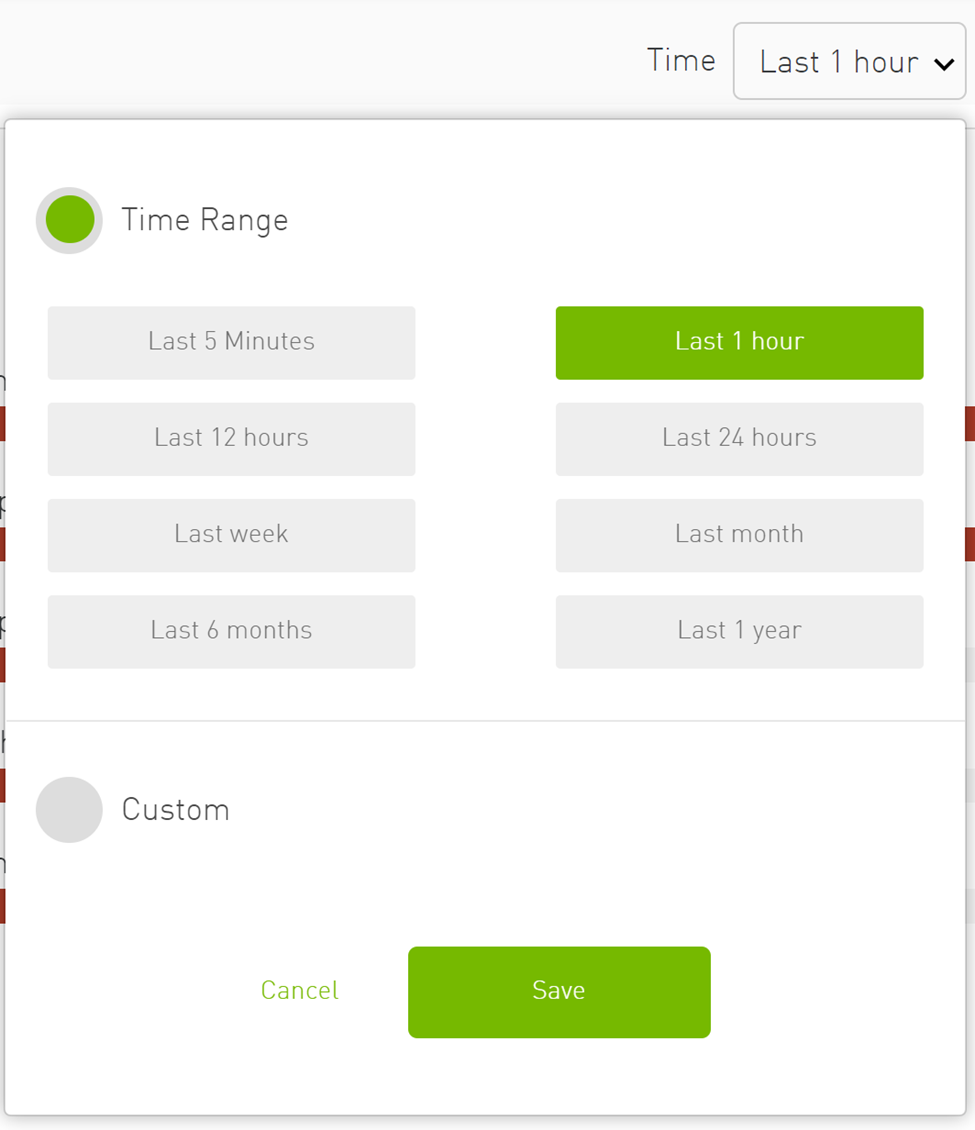
The starting time of timeseries panel can be changed from the time calendar at the top of the page, time can be "Time Range" or "Custom". In case the "Custom" option is chosen, only history data is shown.
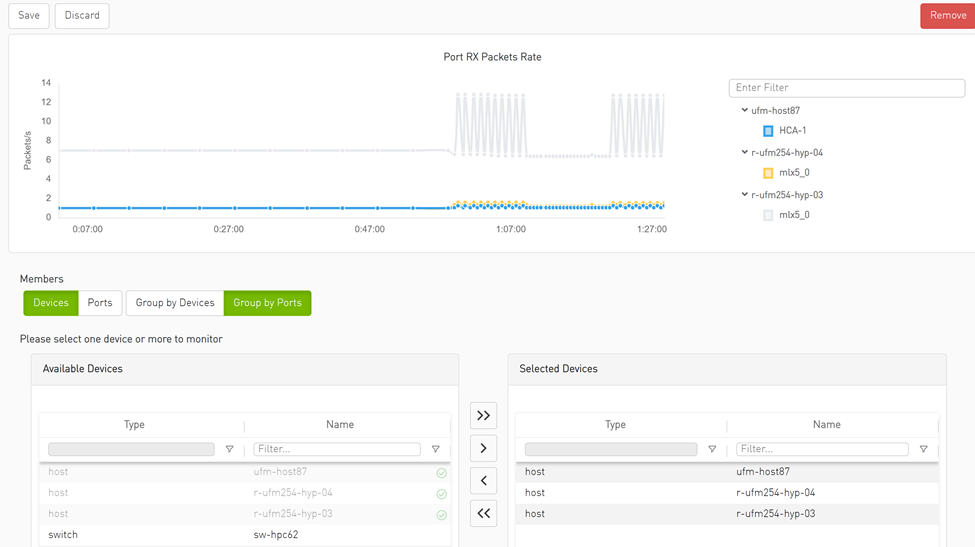
The panel can be edited by changing members, members' type and grouping. The changes can be discarded or saved. The panel can also be deleted.

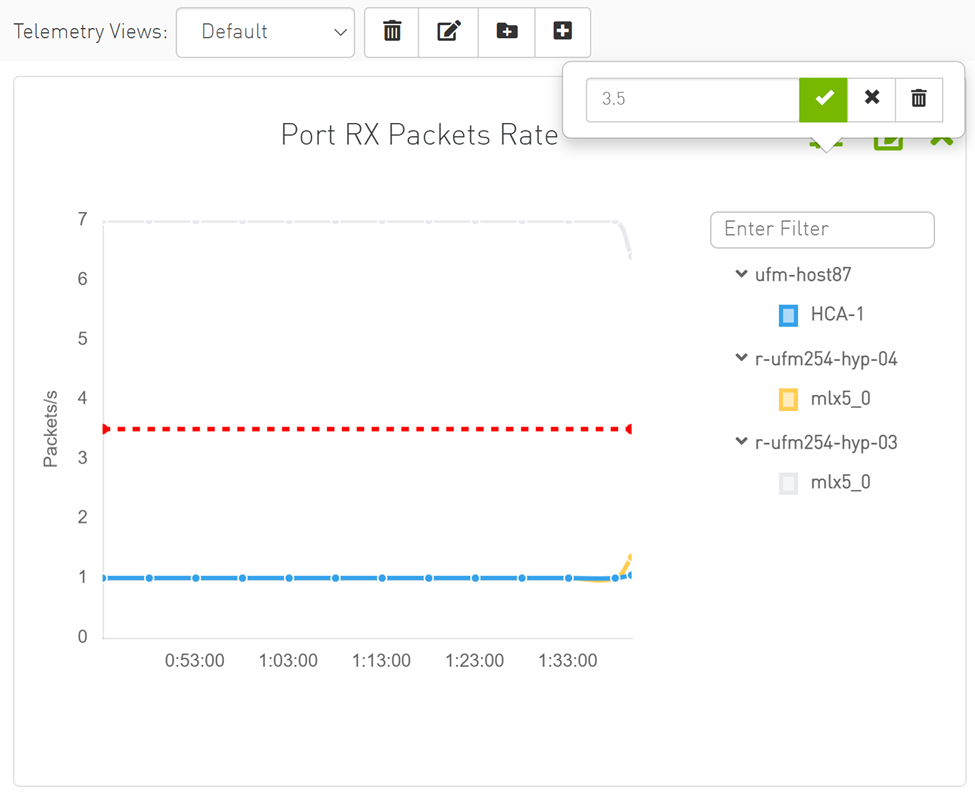
The threshold is supported in Telemetry as a line drawn at the threshold value.
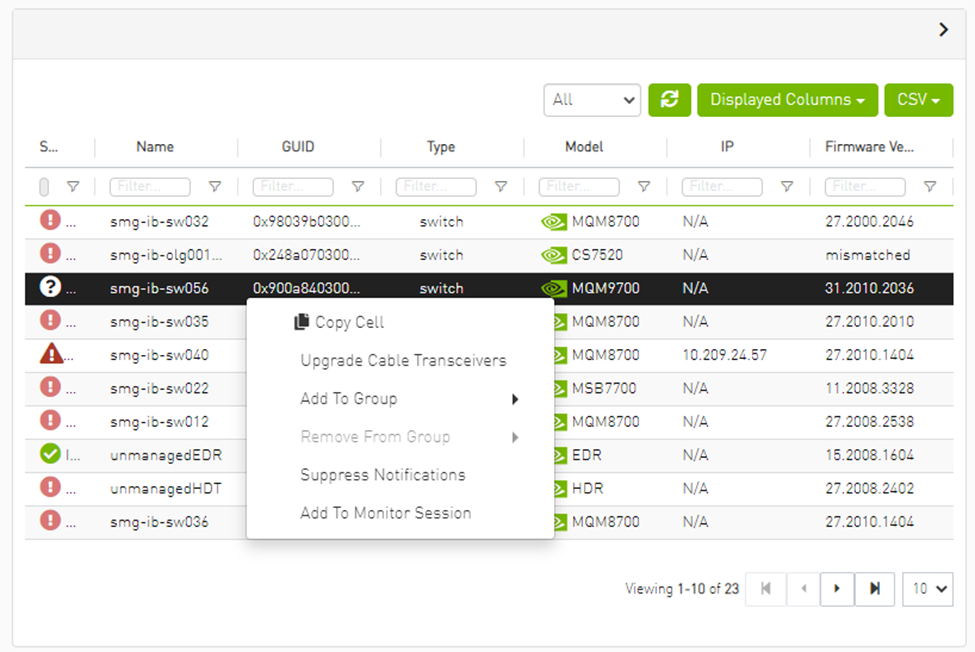
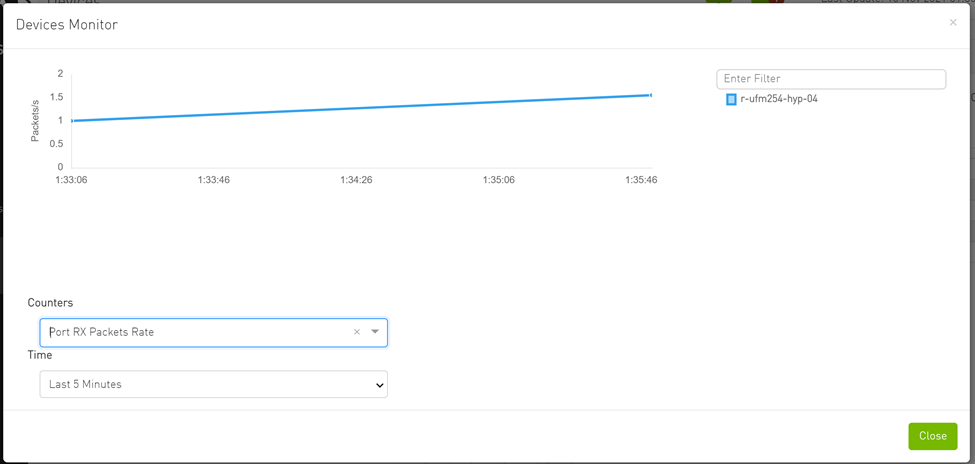
In the Devices table, the user can see telemetry data for one or multiple devices as timeseries chart by clicking on the monitoring option in the context menu.
Setting up telemetry deploys UFM Telemetry as bare metal on the same machine. Historical data is sent to SQLite database on the server and live data becomes available via UFM UI or REST API.
The UFM Telemetry feature is enabled by default and the provider is the UFM Telemetry. The user may change the provider via flag in conf/gv.cfg
The user may also disable the History Telemetry feature in the same section.
            [Telemetry]
history_enabled=True
There is an option to configure parameters on a telemetry configuration file which takes effect after restarting the UFM or failover in HA mode.
The launch_ibdiagnet_config.ini default file is located under /opt/ufm/conf/telemetry_defaults and is copied to the telemetry configuration location ( (/opt/ufm/conf/telemetry) upon startup UFM.
All values taken from the default file take effect at the deployed configuration file except for the following:
hca
scope_file
plugin_env_PROMETHEUS_ENDPOINT
plugin_env_PROMETHEUS_INDEXES
config_watch_enabled=true;
plugin_env_PROMETHEUS_CSET_DIR
num_iterations
plugin_env_CLX_RESTART_FILE
The following attributes are configurable via the gv.cfg:
sample_rate (gv.cfg → dashboard_interval) – only if manual_config is set to false
prometheus_port
As of UFM v6.11.0, UFM can can support any numeric counters from the Prometheus endpoint. The list of supported counters are fetched upon starting the UFM from all the endpoints that are configured.
Some of the implemented changes are as follows:
Counter naming – all counters naming convention is extracted from the Prometheus endpoint. The default cst file is configured as follows:
“Infiniband_LinkIntegrityErrors=^LocalLinkIntegrityErrorsExtended$” to get this name to the UFM.
Counters received as floats should contain a suffix such as: Infiniband_CBW_f=^infiniband_CBW$Attribute units – To see units of a specific counter on the UI graphs, configure the cset file to have the counter returned as “counter_name_u_unit”.
Telemetry History:
The SQLite history table (ufm_telemetry.db – telemetry_calculated), contains the new naming convention of the telemetry counters.
In the case of an upgrade, all previous columns that were configured are renamed following the new naming convention, and then, the data is saved.
if a new counter that is not in the table needs to be supported, the table is altered upon UFM start.New counter/cset to fetch – if there is a new cset/counter that needs to be supported AFTER the UFM already started, preform system restart.
Created New API/UfmRestV2/telemetry/counters for the UI visualization. This API returns a dictionary containing the counters that the UFM supports, based on the fetched URLs and their units (if known).
This feature allows brining up another telemetry instance (local or remote) or use a different cset file.
To enable this feature, under the [Telemetry] section in gv.cfg,the flag named “additional_cset_url” holds the list of additional URLs to be fetched.
the URLs should be separated by “ “ (with a space) and should follow the following format: http://<IP>:<PORT>/csv/<CSET_NAME>. For example http://10.10.10.10:9001/csv/minimal http://10.10.10.10:9002/csv/test.
Only csv extensions are supported.
Each UFM Telemetry instance run by UFM can support multiple cset (counters set) in parallel.If the user would like to have a second cset file fetched by UFM and exposed by the same UFM Telemetry instance, the new cset file should be placed under conf/telemetry/prometheus_configs/cset/ and configured in gv.cfg to fetch its data as described above.
There is an option to run a second instance of the UFM Telemetry to bring three additional counters – eff_ber, raw_ver, and dev_temperature (those counters are not supported in the default flow). To enable this feature, enable the flag “secondary_telemetry” under the Telemetry section in gv.cfg.All the configurations for the second telemetry can be found under conf/secondary_telemetry/, where the defaults are located under conf/secondary_telemetry_defaults/.