1. Debug Versions of ELF Files
Often, after a binary is built, especially if it is built with debug information (-g compiler flag), it gets stripped before deploying or installing. In this case, ELF sections that contain useful information, such as non-export function names or unwind information, can get stripped as well.
One solution is to deploy or install the original unstripped library instead of the stripped one, but in many cases this would be inconvenient. Nsight Systems can use missing information from alternative locations.
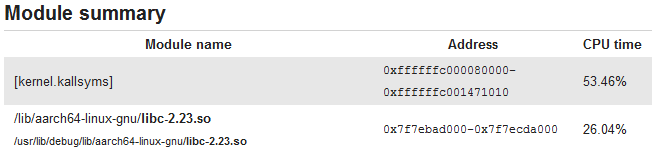
For target devices with Ubuntu, see Debug Symbol Packages. These packages typically install debug ELF files with /usr/lib/debug prefix. Nsight Systems can find debug libraries there, and if it matches the original library (e.g., the built-in BuildID is the same), it will be picked up and used to provide symbol names and unwind information.
Many packages have debug companions in the same repository and can be directly installed with APT (apt-get). Look for packages with the -dbg suffix. For other packages, refer to the Debug Symbol Packages wiki page on how to add the debs package repository. After setting up the repository and running apt-get update, look for packages with -dbgsym suffix.
To verify that a debug version of a library has been picked up and downloaded from the target device, look in the Module Summary section of Analysis Summary:
2. Reading Your Report in GUI
2.1. Generating a New Report
Users can generate a new report by stopping a profiling session. If a profiling session has been canceled, a report will not be generated, and all collected data will be discarded.
A new .qdrep file will be created and put into the same directory as the project file (.qdproj).
2.3. Sharing a Report File
Report files (.qdrep) are self-contained and can be shared with other users of Nsight Systems. The only requirement is that the same or newer version of Nsight Systems is always used to open report files.
Project files (.qdproj) are currently not shareable, since they contain full paths to the report files.
To quickly navigate to the directory containing the report file, right click on it in the Project Explorer, and choose Show in folder... in the context menu.
2.4. Report Tab
While generating a new report or loading an existing one, a new tab will be created. The most important parts of the report tab are:
-
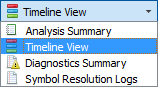
View selector — Allows switching between Analysis Summary, Timeline View, Diagnostics Summary, and Symbol Resolution Logs views.
-
Timeline — This is where all charts are displayed.
-
Function table — Located below the timeline, it displays statistical information about functions in the target application in multiple ways.
Additionally, the following controls are available:
-
Zoom slider — Allows you to vertically zoom the charts on the timeline.
2.5. Analysis Summary View
This view shows a summary of the profiling session. In particular, it is useful to review the project configuration used to generate this report. Information from this view can be selected and copied using the mouse cursor.
2.6. Timeline View
The timeline view consists of two main controls: the timeline at the top, and a bottom pane that contains the events view and the function table. In some cases, when sampling of a process has not been enabled, the function table might be empty and hidden.
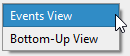
The bottom view selector sets the view that is displayed in the bottom pane.
2.6.1. Timeline
Timeline is a versatile control that contains a tree-like hierarchy on the left, and corresponding charts on the right.
Contents of the hierarchy depend on the project settings used to collect the report. For example, if a certain feature has not been enabled, corresponding rows will not be show on the timeline.
To display trace events in the Events View right-click a timeline row and select the “Show in Events View” command. The events of the selected row and all of its sub-rows will be displayed in the Events View.
If a timeline row has been selected for display in the Events View then double-clicking a timeline item on that row will automatically scroll the content of the Events View to make the corresponding Events View item visible and select it.
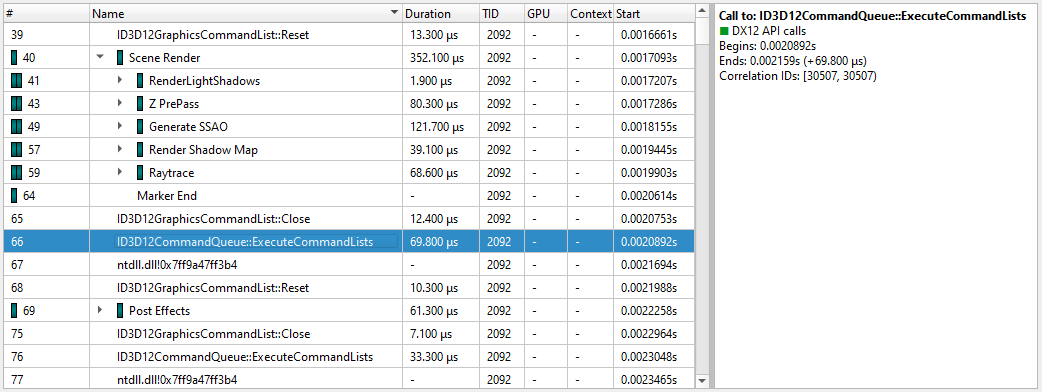
2.6.2. Events View
The Events View provides a tabular display of the trace events. The view contents can be searched and sorted.
Double-clicking an item in the Events View automatically focuses the Timeline View on the corresponding timeline item.
API calls, GPU executions, and debug markers that occurred within the boundaries of a debug marker are displayed nested to that debug marker. Multiple levels of nesting are supported.
Events view recognizes these types of debug markers:
-
NVTX
-
Vulkan VK_EXT_debug_marker markers, VK_EXT_debug_utils labels
-
PIX events and markers
-
OpenGL KHR_debug markers
2.6.3. Function Table Modes
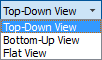
The function table can work in three modes:
-
Top-Down View — In this mode, expanding top-level functions provides information about the callee functions. One of the top-level functions is typically the main function of your application, or another entry point defined by the runtime libraries.
-
Bottom-Up View — This is a reverse of the Top-Down view. On the top level, there are functions directly hit by the sampling profiler. To explore all possible call chains leading to these functions, you need to expand the subtrees of the top-level functions.
-
Flat View — This view enumerates all functions ever observed by the profiler, even if they have never been directly hit, but just appeared somewhere on the call stack. This view typically provides a high-level overview of which parts of the code are CPU-intensive.
Each of the views helps understand particular performance issues of the application being profiled. For example:
-
When trying to find specific bottleneck functions that can be optimized, the Bottom-Up view should be used. Typically, the top few functions should be examined. Expand them to understand in which contexts they are being used.
-
To navigate the call tree of the application and while generally searching for algorithms and parts of the code that consume unexpectedly large amount of CPU time, the Top-Down view should be used.
-
To quickly assess which parts of the application, or high level parts of an algorithm, consume significant amount of CPU time, use the Flat view.
The Top-Down and Bottom-Up views have Self and Total columns, while the Flat view has a Flat column. It is important to understand the meaning of each of the columns:
-
Top-Down view
-
Self column denotes the relative amount of time spent executing instructions of this particular function.
-
Total column shows how much time has been spent executing this function, including all other functions called from this one. Total values of sibling rows sum up to the Total value of the parent row, or 100% for the top-level rows.
-
-
Bottom-Up view
-
Self column for top-level rows, as in the Top-Down view, shows how much time has been spent directly in this function. Self times of all top-level rows add up to 100%.
-
Self column for children rows breaks down the value of the parent row based on the various call chains leading to that function. Self times of sibling rows add up to the value of the parent row.
-
-
Flat view
-
Flat column shows how much time this function has been anywhere on the call stack. Values in this column do not add up or have other significant relationships.
Note:
If low-impact functions have been filtered out, values may not add up correctly to 100%, or to the value of the parent row. This filtering can be disabled.
Contents of the symbols table is tightly related to the timeline. Users can apply and modify filters on the timeline, and they will affect which information is displayed in the symbols table:
-
-
Per-thread filtering — Each thread that has sampling information associated with it has a checkbox next to it on the timeline. Only threads with selected checkboxes are represented in the symbols table.
-
Time filtering — A time filter can be setup on the timeline by pressing the left mouse button, dragging over a region of interest on the timeline, and then choosing Filter by selection in the dropdown menu. In this case, only sampling information collected during the selected time range will be used to build the symbols table.
Note:
If too little sampling data is being used to build the symbols table (for example, when the sampling rate is configured to be low, and a short period of time is used for time-based filtering), the numbers in the symbols table might not be representative or accurate in some cases.
2.6.4. Filter Dialog
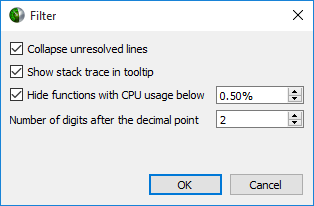
- Collapse unresolved lines is useful if some of the binary code does not have symbols. In this case, subtrees that consist of only unresolved symbols get collapsed in the Top-Down view, since they provide very little useful information.
- Hide functions with CPU usage below X% is useful for large applications, where the sampling profiler hits lots of function just a few times. To filter out the "long tail," which is typically not important for CPU performance bottleneck analysis, this checkbox should be selected.
2.7. Diagnostics Summary View
This view shows important messages. Some of them were generated during the profiling session, while some were added while processing and analyzing data in the report. Messages can be one of the following types:
-
Informational messages
-
Warnings
-
Errors
To draw attention to important diagnostics messages, a summary line is displayed on the timeline view in the top right corner:
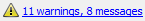
Information from this view can be selected and copied using the mouse cursor.
2.8. Symbol Resolution Logs View
This view shows all messages related to the process of resolving symbols. It might be useful to debug issues when some of the symbol names in the symbols table of the timeline view are unresolved.
3. Broken Backtraces on Tegra
In Nsight Systems Embedded Platforms Edition, in the symbols table there is a special entry called Broken backtraces. This entry is used to denote the point in the call chain where the unwinding algorithms used by Nsight Systems could not determine what is the next (caller) function.
Broken backtraces happen because there is no information related to the current function that the unwinding algorithms can use. In the Top-Down view, these functions are immediate children of the Broken backtraces row.
One can eliminate broken backtraces by modifying the build system to provide at least one kind of unwind information. The types of unwind information, used by the algorithms in Nsight Systems, include the following:
For ARMv7 binaries:
-
DWARF information in ELF sections: .debug_frame, .zdebug_frame, .eh_frame, .eh_frame_hdr. This information is the most precise. .zdebug_frame is a compressed version of .debug_frame, so at most one of them is typically present. .eh_frame_hdr is a companion section for .eh_frame and might be absent.
Compiler flag: -g.
-
Exception handling information in EHABI format provided in .ARM.exidx and .ARM.extab ELF sections. .ARM.extab might be absent if all information is compact enough to be encoded into .ARM.exidx.
Compiler flag: -funwind-tables.
-
Frame pointers (built into the .text section).
Compiler flag: -fno-omit-frame-pointer.
For Aarch64 binaries:
-
DWARF information in ELF sections: .debug_frame, .zdebug_frame, .eh_frame, .eh_frame_hdr. See additional comments above.
Compiler flag: -g.
-
Frame pointers (built into the .text section).
Compiler flag: -fno-omit-frame-pointer.
The following ELF sections should be considered empty if they have size of 4 bytes: .debug_frame, .eh_frame, .ARM.exidx. In this case, these sections only contain termination records and no useful information.
For GCC, use the following compiler invocation to see which compiler flags are enabled in your toolchain by default (for example, to check if -funwind-tables is enabled by default):
$ gcc -Q --help=common
For GCC and Clang, add -### to the compiler invocation command to see which compiler flags are actually being used.
Since EHABI and DWARF information is compiled on per-unit basis (every .cpp or .c file, as well as every static library, can be built with or without this information), presence of the ELF sections does not guarantee that every function has necessary unwind information.
Frame pointers are required by the Aarch64 Procedure Call Standard. Adding frame pointers slows down execution time, but in most cases the difference is negligible.
4. Launch Processes in Stopped State
In many cases, it is important to profile an application from the very beginning of its execution. When launching processes, Nsight Systems takes care of it by making sure that the profiling session is fully initialized before making the exec() system call on Linux, and by using the JDWP protocol on Android.
If the process launch capabilities of Nsight Systems are not sufficient, the application should be launched manually, and the profiler should be configured to attach to the already launched process. One approach would be to call sleep() somewhere early in the application code, which would provide time for the user to attach to the process in Nsight Systems Embedded Platforms Edition, but there are two other more convenient mechanisms that can be used on Linux, without the need to recompile the application. (Note that the rest of this section is only applicable to Linux-based target devices, not Windows or Android.)
Both mechanisms ensure that between the time the process is created (and therefore its PID is known) and the time any of the application's code is called, the process is stopped and waits for a signal to be delivered before continuing.
4.1. LD_PRELOAD
The first mechanism uses LD_PRELOAD environment variable. It only works with dynamically linked binaries, since static binaries do not invoke the runtime linker, and therefore are not affected by the LD_PRELOAD environment variable.
-
For ARMv7 binaries, preload
/opt/nvidia/nsight_systems/libLauncher32.so
-
Otherwise if running from host, preload
/opt/nvidia/nsight_systems/libLauncher64.so
-
Otherwise if running from CLI, preload
[installation_directory]/libLauncher64.so
The most common way to do that is to specify the environment variable as part of the process launch command, for example:
$ LD_PRELOAD=/opt/nvidia/nsight_systems/libLauncher64.so ./my-aarch64-binary --arguments
When loaded, this library will send itself a SIGSTOP signal, which is equivalent to typing Ctrl+Z in the terminal. The process is now a background job, and you can use standard commands like jobs, fg and bg to control them. Use jobs -l to see the PID of the launched process.
When attaching to a stopped process, Nsight Systems will send SIGCONT signal, which is equivalent to using the bg command.
4.2. Launcher
The second mechanism can be used with any binary. Use [installation_directory]/launcher to launch your application, for example:
$ /opt/nvidia/nsight_systems/launcher ./my-binary --arguments
The process will be launched, daemonized, and wait for SIGUSR1 signal. After attaching to the process with Nsight Systems, the user needs to manually resume execution of the process from command line:
$ pkill -USR1 launcher
|
Note: |
Note that pkill will send the signal to any process with the matching name. If that is not desirable, use kill to send it to a specific process. The standard output and error streams are redirected to /tmp/stdout_<PID>.txt and /tmp/stderr_<PID>.txt. |
The launcher mechanism is more complex and less automated than the LD_PRELOAD option, but gives more control to the user.
5. Import NVTXT
ImportNvtxt is an utility which allows conversion of a NVTXT file to a Nsight Systems report file (*.qdrep) or to merge it with an existing report file.
Note: NvtxtImport supports custom TimeBase values. Only these values are supported:
-
Manual — timestamps are set using absolute values.
-
Relative — timestamps are set using relative values with regards to report file which is being merged with nvtxt file.
-
ClockMonotonicRaw — timestamps values in nvtxt file are considered to be gathered on the same target as the report file which is to be merged with nvtxt using clock_gettime(CLOCK_MONOTONIC_RAW, ...) call.
-
CNTVCT — timestamps values in nvtxt file are considered to be gathered on the same target as the report file which is to be merged with nvtxt using CNTVCT values.
You can get usage info via help message:
Print help message:
-h [ --help ]
Show information about report file:
--cmd info -i [--input] arg
Create report file from existing nvtxt file:
--cmd create -n [--nvtxt] arg -o [--output] arg [-m [--mode] mode_name mode_args] [--target <Hw:Vm>] [--update_report_time]
Merge nvtxt file to existing report file:
--cmd merge -i [--input] arg -n [--nvtxt] arg -o [--output] arg [-m [--mode] mode_name mode_args] [--target <Hw:Vm>] [--update_report_time]
-
lerp - Insert with linear interpolation
--mode lerp --ns_a arg --ns_b arg [--nvtxt_a arg --nvtxt_b arg]
-
lin - insert with linear equation
--mode lin --ns_a arg --freq arg [--nvtxt_a arg]
-
ns_a - a nanoseconds value
-
ns_b - a nanoseconds value (greater than ns_a)
-
nvtxt_a - an nvtxt file's time unit value corresponding to ns_a nanoseconds
-
nvtxt_b - an nvtxt file's time unit value corresponding to ns_b nanoseconds
-
freq - the nvtxt file's timer frequency
-
--target <Hw:Vm> - specify target id, e.g. --target 0:1
-
--update_report_time - prolong report's profiling session time while merging if needed. Without this option all events outside the profiling session time window will be skipped during merging.
Commands
Info
To find out report's start and end time use info command.
Usage:
ImportNvtxt --cmd info -i [--input] arg
Example:
ImportNvtxt info Report.qdrep
Analysis start (ns)	83501026500000
Analysis end (ns)	83506375000000
Create
You can create a report file using existing NVTXT with create command.
Usage:
ImportNvtxt --cmd create -n [--nvtxt] arg -o [--output] arg [-m [--mode] mode_name mode_args]
-
lerp — insert with linear interpolation.
-
lin — insert with linear equation.
Usage for lerp mode is:
--mode lerp --ns_a arg --ns_b arg [--nvtxt_a arg --nvtxt_b arg]
-
ns_a — a nanoseconds value.
-
ns_b — a nanoseconds value (greater than ns_a).
-
nvtxt_a — an nvtxt file's time unit value corresponding to ns_a nanoseconds.
-
nvtxt_b — an nvtxt file's time unit value corresponding to ns_b nanoseconds.
If nvtxt_a and nvtxt_b are not specified, they are repectively set to nvtxt file's minimum and maximum time value.
Usage for lin mode is:
--mode lin --ns_a arg --freq arg [--nvtxt_a arg]
-
ns_a — a nanoseconds value.
-
freq — the nvtxt file's timer frequency.
-
nvtxt_a — an nvtxt file's time unit value corresponding to ns_a nanoseconds.
If nvtxt_a is not specified, it is set to nvtxt file's minimum time value.
Examples:
ImportNvtxt --cmd create -n Sample.nvtxt -o Report.qdrep
The output will be a new generated report file which can be opened and viewed by Nsight Systems.
Merge
To merge NVTXT file with an existing report file use merge command.
Usage:
ImportNvtxt --cmd merge -i [--input] arg -n [--nvtxt] arg -o [--output] arg [-m [--mode] mode_name mode_args]
-
lerp — insert with linear interpolation.
-
lin — insert with linear equation.
Usage for lerp mode is:
--mode lerp --ns_a arg --ns_b arg [--nvtxt_a arg --nvtxt_b arg]
-
ns_a — a nanoseconds value.
-
ns_b — a nanoseconds value (greater than ns_a).
-
nvtxt_a — an nvtxt file's time unit value corresponding to ns_a nanoseconds.
-
nvtxt_b — an nvtxt file's time unit value corresponding to ns_b nanoseconds.
If nvtxt_a and nvtxt_b are not specified, they are repectively set to nvtxt file's minimum and maximum time value.
Usage for lin mode is:
--mode lin --ns_a arg --freq arg [--nvtxt_a arg]
-
ns_a — a nanoseconds value.
-
freq — the nvtxt file's timer frequency.
-
nvtxt_a — an nvtxt file's time unit value corresponding to ns_a nanoseconds.
If nvtxt_a is not specified, it is set to nvtxt file's minimum time value.
Time values in <filename.nvtxt> are assumed to be nanoseconds if no mode specified.
Example
ImportNvtxt --cmd merge -i Report.qdrep -n Sample.nvtxt -o NewReport.qdrep
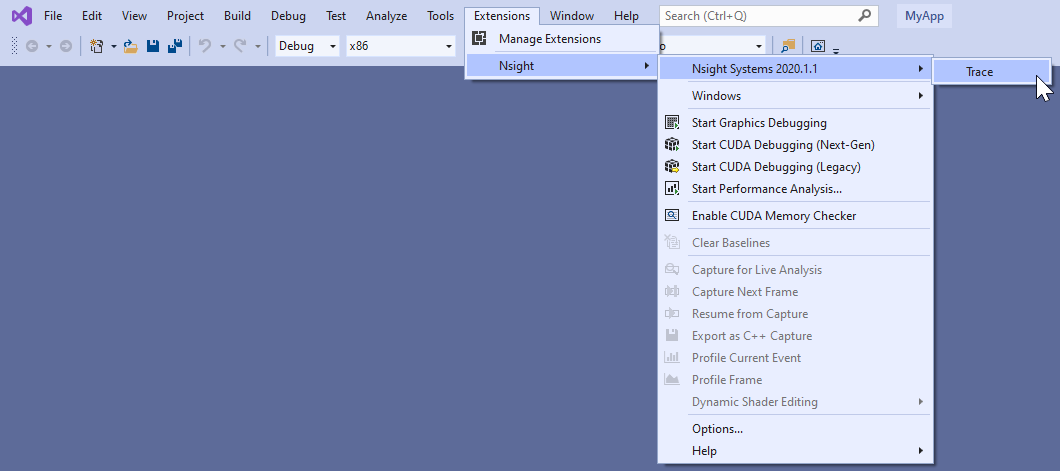
Visual Studio Integration
NVIDIA Nsight Integration is a Visual Studio extension that allows you to access the power of Nsight Systems from within Visual Studio.
When Nsight Systems is installed along with NVIDIA Nsight Integration, Nsight Systems activities will appear under the NVIDIA Nsight menu in the Visual Studio menu bar. These activities launch Nsight Systems with the current project settings and executable.
-
Target application path
-
Command line parameters
-
Working folder
If the "Trace" command has already been used with this Visual Studio project then Nsight Systems will load the respective Nsight Systems project and any previously captured trace sessions will be available for review using the Nsight Systems project explorer tree.
7. Troubleshooting
- Close the host application.
- Restart the target device.
- Start the host application and connect to the target device.
To enable logging on the host, refer to this config file:
host-linux-x64/nvlog.config.template
When reporting any bugs please include the build version number as described in the Help → About dialog. If possible, attach log files and report (.qdrep) files, as they already contain necessary version information.
Nsight Systems uses a settings file (NVIDIA Nsight Systems.ini) on the host to store information about loaded projects, report files, window layout configuration, etc. Location of the settings file is described in the Help → About dialog. Deleting the settings file will restore Nsight Systems to a fresh state, but all projects and reports will disappear from the Project Explorer.
GUI Troubleshooting
If opening the Nsight Systems Linux GUI fails with the following error, you may be missing some required libraries:
This application failed to start because it could not find or load the Qt platform plugin "xcb" in "". Available platform plugins are: xcb. Reinstalling the application may fix this problem.
Launch Nsight Systems using the following command line to determine which libraries are missing and install them.
$ QT_DEBUG_PLUGINS=1 ./nsight-sys
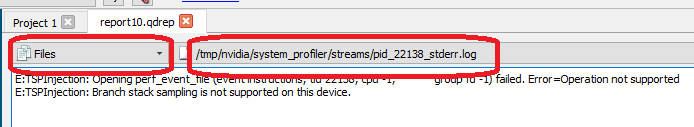
If the workload does not run when launched via Nsight Systems or the timeline is empty, check the stderr.log and stdout.log (click on drop-down menu showing Timeline View and click on Files) to see the errors encountered by the app.
Android Targets
When connecting to an Android-based device, Nsight Systems installs its executable and library files into the following directory:
/data/local/tmp/com.nvidia.nsightsystems.tools/
Logs on the target device are collected into this file:
/data/local/tmp/com.nvidia.nsightsystems.tools/nsys.log
-
Close the host application.
-
Place nvlog.config from host directory to /sdcard/ directory on target.
-
Restart the target device.
-
From ADB shell, launch the following command:
/data/local/tmp/com.nvidia.nsightsystems.tools/nsys --daemon --debug
On rooted Android devices, the command above should be started from superuser (e.g., adb shell su -c ...).
-
Start the host application and connect to the target device.
Please note that in some cases, debug logging can significantly slow down the profiler
Symbol Resolution
If stack trace information is missing symbols and you have a symbol file, you can manually re-resolve using the ResolveSymbols utility. You will find this utility in the [installation_path]\Host directory. This utility works with ELF format files or files where each line is in the format <start><length><name>.
| Short | Long | Argument | Description |
|---|---|---|---|
| -h | --help | Help message providing information about available options. | |
| -l | --process-list | Print global process IDs list | |
| -s | --sym-file | filename | Path to symbol file |
| -b | --base-addr | address | If set then <start> in symbol file is treated as relative address starting from this base address |
| -p | --global-pid | pid | Which process in the report should be resolved. May be omitted if there is only one process in the report. |
| -f | --force | This option forces use of a given symbol file. | |
| -i | --report | filename | Path to the report with unresolved symbols. |
| -o | --output | filename | Path and name of the output file. If it is omitted then "resolved" suffix is added to the original filename. |
Verbose Logging on Linux Targets
Verbose logging is available when connecting to a Linux-based device from the GUI on the host. This extra debug information is not available when launching via the command line. Nsight Systems installs its executable and library files into the following directory:
/opt/nvidia/nsight_systems/
-
Close the host application.
-
Restart the target device.
-
Place nvlog.config from host directory to the /opt/nvidia/nsight_systems directory on target.
-
From SSH console, launch the following command:
sudo /opt/nvidia/nsight_systems/nsys --daemon --debug
-
Start the host application and connect to the target device.
Logs on the target devices are collected into this file (if enabled):
nsys.log
in the directory where nsys command was launched.
Please note that in some cases, debug logging can significantly slow down the profiler.
Verbose Logging on Windows Targets
Verbose logging is available when connecting to a Windows-based device from the GUI on the host. Nsight Systems installs its executable and library files into the following directory by default:
C:\Program Files\NVIDIA Corporation\Nsight Systems 2020.3
-
Close the host application.
-
Terminate the nsight-sys-agent process.
-
Place nvlog.config from host directory next to Nsight Systems Windows agent on the target device
-
Local Windows target:
C:\Program Files\NVIDIA Corporation\Nsight Systems 2020.3\target-windows-x64
-
Remote Windows target:
C:\Users\<user name>\AppData\Local\Temp\nvidia\nsight_systems
-
-
Start the host application and connect to the target device.
Logs on the target devices are collected into this file (if enabled):
nsight-sys.log
in the same directory as Nsight Systems Windows agent.
Please note that in some cases debug logging can significantly slow down the profiler.
QNX Troubleshooting
-
Make sure that tracelogger utility is available and can be run on the target.
-
Make sure that /tmp directory is accessible and supports sub-directories.
-
When switching between Nsight Systems versions, processes related to the previous version, including profiled applications forked by the daemon, must be killed before the new version is used. If you experience issues after switching between Nsight Systems versions, try rebooting the target.
Other Resources
Looking for information to help you use Nsight Systems the most effectively? Here are some more resources you might want to review:
Feature Videos
Short videos, only a minute or two, to introduce new features.
- 2019.3.6 release video - Statistics Driven Profiling
Blog Posts
NVIDIA developer blogs, these are longer form, technical pieces written by tool and domain experts.
Conference Presentations
- GTC 2019 - Using Nsight Tools to Optimize the NAMD Molecular Dynamics Simulation Program
- GTC 2019 - Optimizing Facebook AI Workloads for NVIDIA GPUs
- GTC 2018 - Optimizing HPC Simulation and Visualization Codes Using NVIDIA Nsight Systems
- GTC 2018 - Israel - Boost DNN Training Performance using NVIDIA Tools
- Siggraph 2018 - Taming the Beast; Using NVIDIA Tools to Unlock Hidden GPU Performance
For More Support
To file a bug report or to ask a question on the Nsight Systems forums, you will need to register with the NVIDIA Developer Program. See the FAQ. You do not need to register to read the forums.
After that, you can access Nsight Systems Forums and the NVIDIA Bug Tracking System.
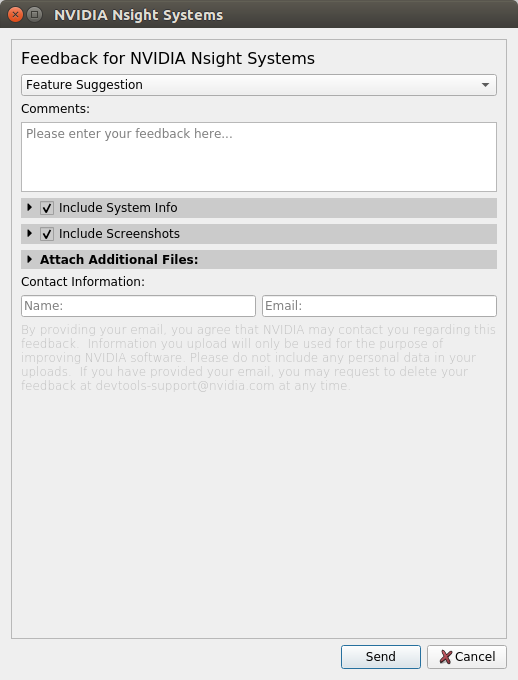
To submit feedback directly from the GUI, go to Help->Send Feedback and fill out the form. Enter your email address if you would like to hear back from the Nsight Systems team.
Notices
Notice
NVIDIA® Nsight™ Systems User GuideSend Feedback
THE INFORMATION IN THIS GUIDE AND ALL OTHER INFORMATION CONTAINED IN NVIDIA DOCUMENTATION REFERENCED IN THIS GUIDE IS PROVIDED “AS IS.” NVIDIA MAKES NO WARRANTIES, EXPRESSED, IMPLIED, STATUTORY, OR OTHERWISE WITH RESPECT TO THE INFORMATION FOR THE PRODUCT, AND EXPRESSLY DISCLAIMS ALL IMPLIED WARRANTIES OF NONINFRINGEMENT, MERCHANTABILITY, AND FITNESS FOR A PARTICULAR PURPOSE. Notwithstanding any damages that customer might incur for any reason whatsoever, NVIDIA’s aggregate and cumulative liability towards customer for the product described in this guide shall be limited in accordance with the NVIDIA terms and conditions of sale for the product.
THE NVIDIA PRODUCT DESCRIBED IN THIS GUIDE IS NOT FAULT TOLERANT AND IS NOT DESIGNED, MANUFACTURED OR INTENDED FOR USE IN CONNECTION WITH THE DESIGN, CONSTRUCTION, MAINTENANCE, AND/OR OPERATION OF ANY SYSTEM WHERE THE USE OR A FAILURE OF SUCH SYSTEM COULD RESULT IN A SITUATION THAT THREATENS THE SAFETY OF HUMAN LIFE OR SEVERE PHYSICAL HARM OR PROPERTY DAMAGE (INCLUDING, FOR EXAMPLE, USE IN CONNECTION WITH ANY NUCLEAR, AVIONICS, LIFE SUPPORT OR OTHER LIFE CRITICAL APPLICATION). NVIDIA EXPRESSLY DISCLAIMS ANY EXPRESS OR IMPLIED WARRANTY OF FITNESS FOR SUCH HIGH RISK USES. NVIDIA SHALL NOT BE LIABLE TO CUSTOMER OR ANY THIRD PARTY, IN WHOLE OR IN PART, FOR ANY CLAIMS OR DAMAGES ARISING FROM SUCH HIGH RISK USES.
NVIDIA makes no representation or warranty that the product described in this guide will be suitable for any specified use without further testing or modification. Testing of all parameters of each product is not necessarily performed by NVIDIA. It is customer’s sole responsibility to ensure the product is suitable and fit for the application planned by customer and to do the necessary testing for the application in order to avoid a default of the application or the product. Weaknesses in customer’s product designs may affect the quality and reliability of the NVIDIA product and may result in additional or different conditions and/or requirements beyond those contained in this guide. NVIDIA does not accept any liability related to any default, damage, costs or problem which may be based on or attributable to: (i) the use of the NVIDIA product in any manner that is contrary to this guide, or (ii) customer product designs.
Other than the right for customer to use the information in this guide with the product, no other license, either expressed or implied, is hereby granted by NVIDIA under this guide. Reproduction of information in this guide is permissible only if reproduction is approved by NVIDIA in writing, is reproduced without alteration, and is accompanied by all associated conditions, limitations, and notices.
Trademarks
NVIDIA, the NVIDIA logo, and cuBLAS, CUDA, CUDA-GDB, CUDA-MEMCHECK, cuDNN, cuFFT, cuSPARSE, DIGITS, DGX, DGX-1, DGX Station, NVIDIA DRIVE, NVIDIA DRIVE AGX, NVIDIA DRIVE Software, NVIDIA DRIVE OS, NVIDIA Developer Zone (aka "DevZone"), GRID, Jetson, NVIDIA Jetson Nano, NVIDIA Jetson AGX Xavier, NVIDIA Jetson TX2, NVIDIA Jetson TX2i, NVIDIA Jetson TX1, NVIDIA Jetson TK1, Kepler, NGX, NVIDIA GPU Cloud, Maxwell, Multimedia API, NCCL, NVIDIA Nsight Compute, NVIDIA Nsight Eclipse Edition, NVIDIA Nsight Graphics, NVIDIA Nsight Integration, NVIDIA Nsight Systems, NVIDIA Nsight Visual Studio Edition, NVLink, nvprof, Pascal, NVIDIA SDK Manager, Tegra, TensorRT, Tesla, Visual Profiler, VisionWorks and Volta are trademarks and/or registered trademarks of NVIDIA Corporation in the United States and other countries. Other company and product names may be trademarks of the respective companies with which they are associated.