1. Profiling Linux Targets from the GUI
1.1. Connecting to the Target Device
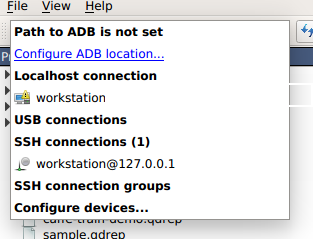
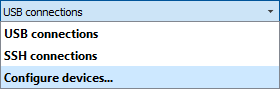
Nsight Systems provides a simple interface to profile on localhost or manage multiple connections to Linux or Windows based devices via SSH. The network connections manager can be launched through the device selection dropdown:
On x86_64:
On Tegra:
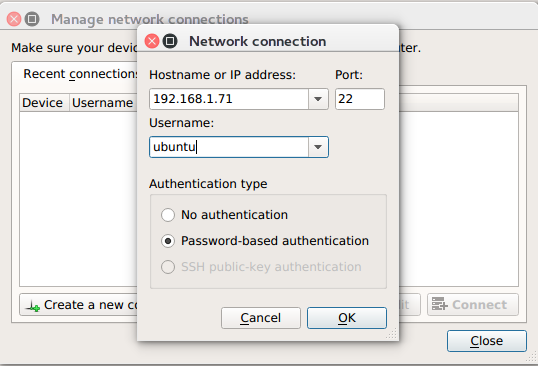
The dialog has simple controls that allow adding, removing, and modifying connections:
Security notice: SSH is only used to establish the initial connection to a target device, perform checks, and upload necessary files. The actual profiling commands and data are transferred through a raw, unencrypted socket. Nsight Systems should not be used in a network setup where MITM (man-in-the-middle) attack is possible, or where untrusted parties may have network access to the target device.
While connecting to the target device, you will be prompted to input the user's password. Please note that if you choose to remember the password, it will be stored in plain text in the configuration file on the host. Stored passwords are bound to the public key fingerprint of the remote device.
The No authentication option is useful for devices configured for passwordless login using root username. To enable such a configuration, edit the file /etc/ssh/sshd_config on the target and specify the following option:
PermitRootLogin yes
Then set empty password using passwd and restart the SSH service with service ssh restart.
Open ports: The Nsight Systems daemon requires port 22 and port 45555 to be open for listening. You can confirm that these ports are open with the following command:
sudo firewall-cmd --list-ports --permanent
sudo firewall-cmd --reload
To open a port use the following command, skip --permanent option to open only for this session:
sudo firewall-cmd --permanent --add-port 45555/tcp
sudo firewall-cmd --reload
Likewise, if you are running on a cloud system, you must open port 22 and port 45555 for ingress.
Kernel Version Number - To check for the version number of the kernel support of Nsight Systems on a target device, run the following command on the remote device:
cat /proc/quadd/version
Minimal supported version is 1.82.
Additionally, presence of Netcat command (nc) is required on the target device. For example, on Ubuntu this package can be installed using the following command:
sudo apt-get install netcat-openbsd
1.2. System-Wide Profiling Options
1.2.1. Linux x86_64
System-wide profiling is available on x86 for Linux targets only when run with root privileges.
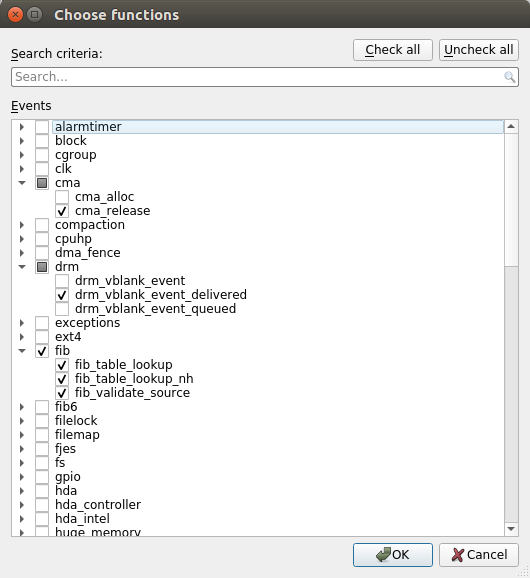
Ftrace Events Collection
Select Ftrace events
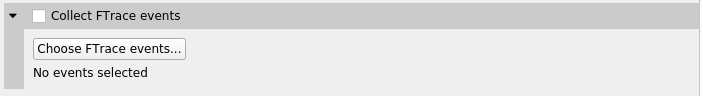
Choose which events you would like to collect.
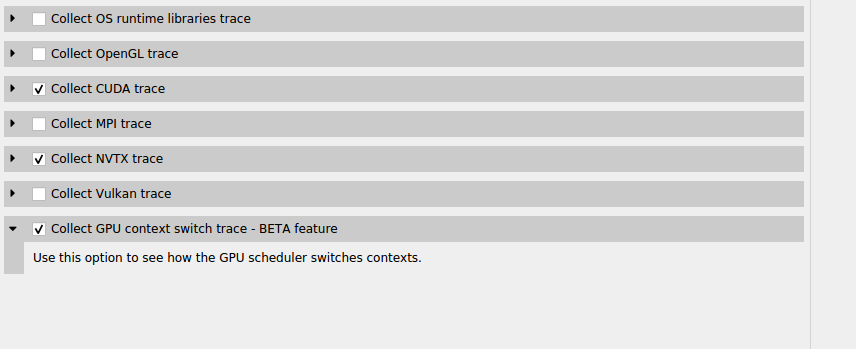
GPU Context Switch Trace
Tracing of context switching on the GPU is enabled with driver r435.17 or higher.
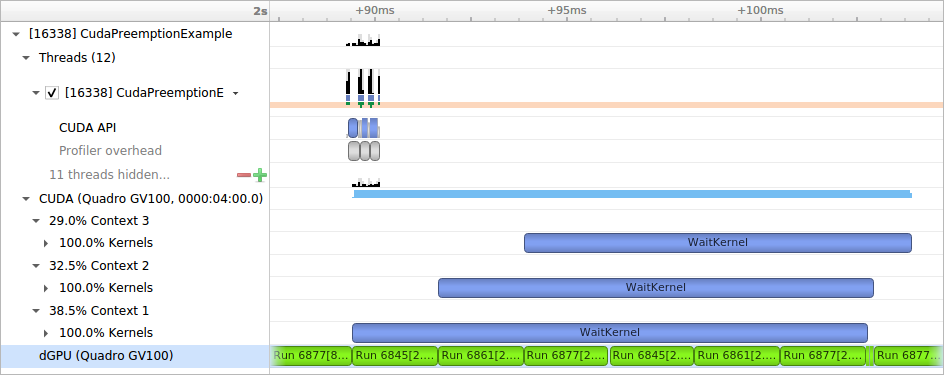
Here is a screenshot showing three CUDA kernels running simultaneously in three different CUDA contexts on a single GPU.
1.2.2. Linux for Tegra
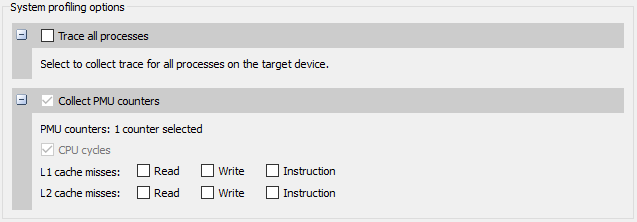
Trace all processes – On compatible devices (with kernel module support version 1.107 or higher), this enables trace of all processes and threads in the system. Scheduler events from all tasks will be recorded.
Collect PMU counters – This allows you to choose which PMU (Performance Monitoring Unit) counters Nsight Systems will sample. Enable specific counters when interested in correlating cache misses to functions in your application.
1.3. Target Sampling Options
Target sampling behavior is somewhat different for Nsight Systems Workstation Edition and Nsight Systems Embedded Platforms Edition.
Target Sampling Options for Workstation
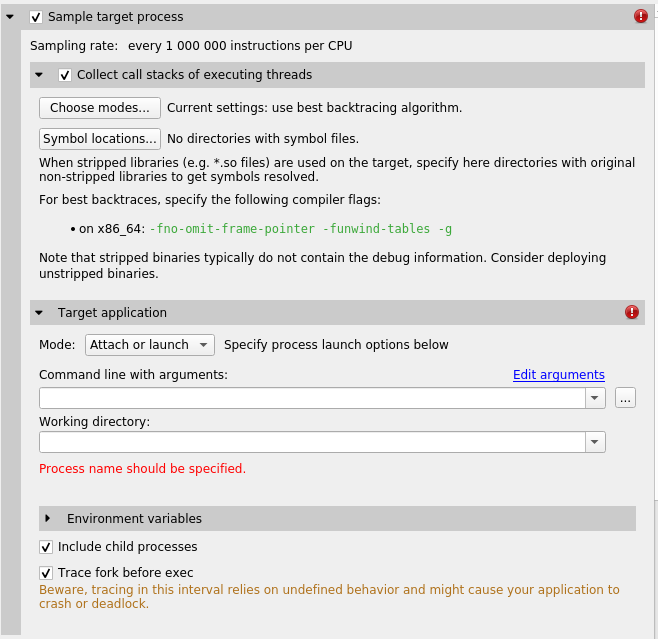
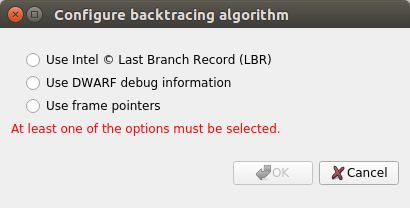
Three different backtrace collections options are available when sampling CPU instruction pointers. Backtraces can be generated using Intel (c) Last Branch Record (LBR) registers. LBR backtraces generate minimal overhead but the backtraces have limited depth. Backtraces can also be generated using DWARF debug data. DWARF backtraces incur more overhead than LBR backtraces but have much better depth. Finally, backtraces can be generated using frame pointers. Frame pointer backtraces incur medium overhead and have good depth but only resolve frames in the portions of the application and its libraries (including 3rd party libraries) that were compiled with frame pointers enabled. Normally, frame pointers are disabled by default during compilation.
By default, Nsight Systems will use Intel(c) LBRs if available and fall back to using dwarf unwind if they are not. Choose modes... will allow you to override the default.
The Include child processes switch controls whether API tracing is only for the launched process, or for all existing and new child processes of the launched process. If you are running your application through a script, for example a bash script, you need to set this checkbox.
The Include child processes switch does not control sampling in this version of Nsight Systems. The full process tree will be sampled regardless of this setting. This will be fixed in a future version of the product.
Nsight Systems can sample one process tree. Sampling here means interrupting each processor after a certain number of events and collecting an instruction pointer (IP)/backtrace sample if the processor is executing the profilee.
When sampling the CPU on a workstation target, Nsight Systems traces thread context switches and infers thread state as either Running or Blocked. Note that Blocked in the timeline indicates the thread may be Blocked (Interruptible) or Blocked (Uninterruptible). Blocked (Uninterruptible) often occurs when a thread has transitioned into the kernel and cannot be interrupted by a signal. Sampling can be enhanced with OS runtime libraries tracing; see OS Runtime Libraries Trace for more information.
Target Sampling Options for Embedded Linux
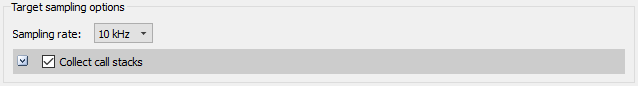
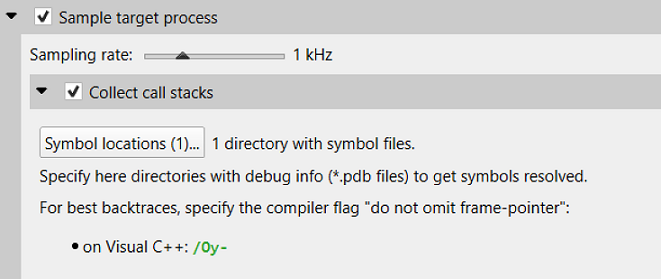
Currently Nsight Systems can only sample one process. Sampling here means that the profilee will be stopped periodically, and backtraces of active threads will be recorded.
Most applications use stripped libraries. In this case, many symbols may stay unresolved. If unstripped libraries exist, paths to them can be specified using the Symbol locations... button. Symbol resolution happens on host, and therefore does not affect performance of profiling on the target.
Additionally, debug versions of ELF files may be picked up from the target system. Refer to Debug Versions of ELF Files for more information.
1.4. Hotkey Trace Start/Stop
Nsight Systems Workstation Edition can use hotkeys to control profiling. Press the hotkey to start and/or stop a trace session from within the target application’s graphic window. This is useful when tracing games and graphic applications that use fullscreen display. In these scenarios switching to Nsight Systems' UI would unnecessarily introduce the window manager's footprint into the trace. To enable the use of Hotkey check the Hotkey checkbox in the project settings page:
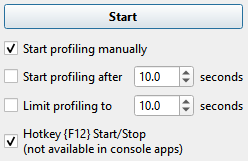
The default hotkey is F12.
1.5. Launching and Attaching to Processes
Nsight Systems Embedded Platforms Edition can work with Linux-based devices in three modes:
-
Attaching to a process by name
-
Attaching to a process by name, or launching a new process
-
Attaching to a process by its PID
The purpose of the configuration here is to define which process the profiler will attach to for sampling and tracing. Additionally, the profiler can launch a process prior to attaching to it, ensuring that all environment variables are set correctly to successfully collect trace information.
In Attach only mode, the process is selected by its name and command line arguments, as visible using the ps tool.
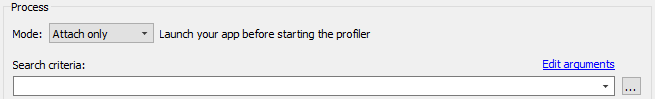
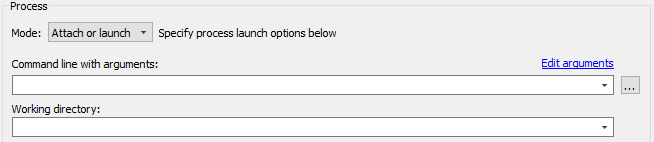
In Attach or launch mode, the process is to first search as if in the Attach only mode, but if it is not found, the process is launched using the same path and command line arguments. If NVTX, CUDA, or other trace settings are selected, the process will be automatically launched with appropriate environment variables.
Note that in some cases, the capabilities of Nsight Systems are not sufficient to correctly launch the application; for example, if certain environment variables have to be corrected. In this case, the application has to be started manually and Nsight Systems should be used in Attach only mode.
The Edit arguments... link will open an editor window, where every command line argument is edited on a separate line. This is convenient when arguments contain spaces or quotes.
To properly populate the Search criteria field based on a currently running process on the target system, use the Select a process button on the right, which has ellipsis as the caption. The list of processes is automatically refreshed upon opening.
Attach by PID mode should be used to connect to a specific process.
To choose one of the currently running processes on the target system, use the Select a process button on the right.
2. Profiling Windows Targets from the GUI
Profiling on Windows devices is similar to the profiling on Linux devices. Please refer to the Profiling Linux Targets from the GUI section for the detailed documentation and connection information. The major differences on the platforms are listed below:
Remoting to a Windows Based Machine
To perform remote profiling to a target Windows based machines, install and configure an OpenSSH Server on the target machine.
Hotkey Trace Start/Stop
Nsight Systems Workstation Edition can use hotkeys to control profiling. Press the hotkey to start and/or stop a trace session from within the target application’s graphic window. This is useful when tracing games and graphic applications that use fullscreen display. In these scenarios switching to Nsight Systems' UI would unnecessarily introduce the window manager's footprint into the trace. To enable the use of Hotkey check the Hotkey checkbox in the project settings page:
The default hotkey is F12.
Changing the Default Hotkey Binding - A different hotkey binding can be configured by setting the HotKeyIntValue configuration field in the config.ini file.
Set the decimal numeric identifier of the hotkey you would like to use for triggering start/stop from the target app graphics window. The default value is 123 which corresponds to 0x7B, or the F12 key.
Virtual key identifiers are detailed in MSDN's Virtual-Key Codes.
Note that you must convert the hexadecimal values detailed in this page to their decimal counterpart before using them in the file. For example, to use the F1 key as a start/stop trace hotkey, use the following settings in the config.ini file:
HotKeyIntValue=112
Target Sampling Options on Windows
Nsight Systems can sample one process tree. Sampling here means interrupting each processor periodically. The sampling rate is defined in the project settings and is either 100Hz, 1KHz (default value), 2Khz, 4KHz, or 8KHz.
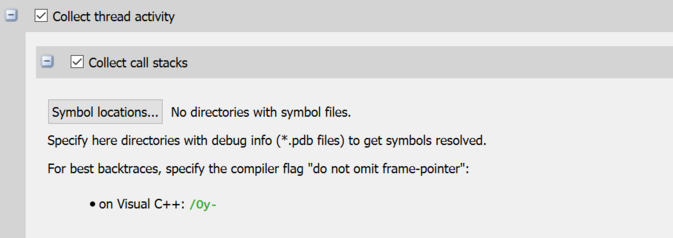
On Windows, Nsight Systems can collect thread activity of one process tree. Collecting thread activity means that each thread context switch event is logged and (optionally) a backtrace is collected at the point that the thread is scheduled back for execution. Thread states are displayed on the timeline.
If it was collected, the thread backtrace is displayed when hovering over a region where the thread execution is blocked.
Symbol Locations
Symbol resolution happens on host, and therefore does not affect performance of profiling on the target.
Press the Symbol locations... button to open the Configure debug symbols location dialog.
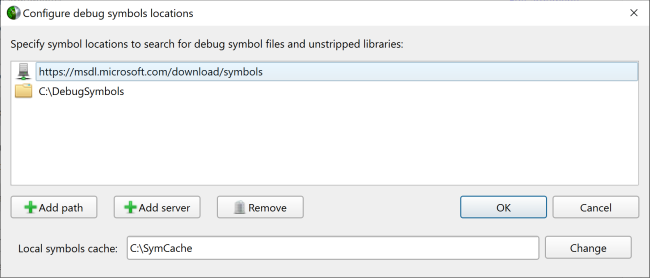
Use this dialog to specify:
-
Paths of PDB files
-
Symbols servers
-
The location of the local symbol cache
To use a symbol server:
-
Install Debugging Tools for Windows, a part of the Windows 10 SDK.
-
Add the symbol server URL using the Add Server button.
Information about Microsoft's public symbol server, which enables getting Windows operating system related debug symbols can be found here.
3. Profiling Android Targets from the GUI
Profiling on Android devices is similar to the profiling on Linux devices. Please refer to the Profiling Linux Targets from the GUI section for the detailed documentation. The major differences on the platforms are listed below:
Configuring Your Android Device
To work with Nsight Systems, the target Android device should be configured for USB debugging in the Developer options settings menu. Please refer to Android development documentation to learn how to configure the device for USB debugging.
On the host, a compatible USB driver should be installed. Please refer to device manufacturer's documentation to learn how to obtain and install the driver.
Connect your target device via a USB cable and power it on (or wake it up). Make sure that you have the adb command available (it is part of Android SDK Platform Tools package). Nsight Systems can only connect to devices that are marked as device in the output of the adb devices command. Make sure you can enter the ADB shell of the target device by running adb shell on the host.
Launch the Nsight Systems application. On the first launch, a new project called Project 1 is created automatically.
When connecting to the target device, Nsight Systems will validate it and install its daemon into the following location on the device:
/data/local/tmp/com.nvidia.nsightsystems.tools/
Once the daemon and all required files are installed correctly, a green check mark will appear and Device is ready text will be displayed:
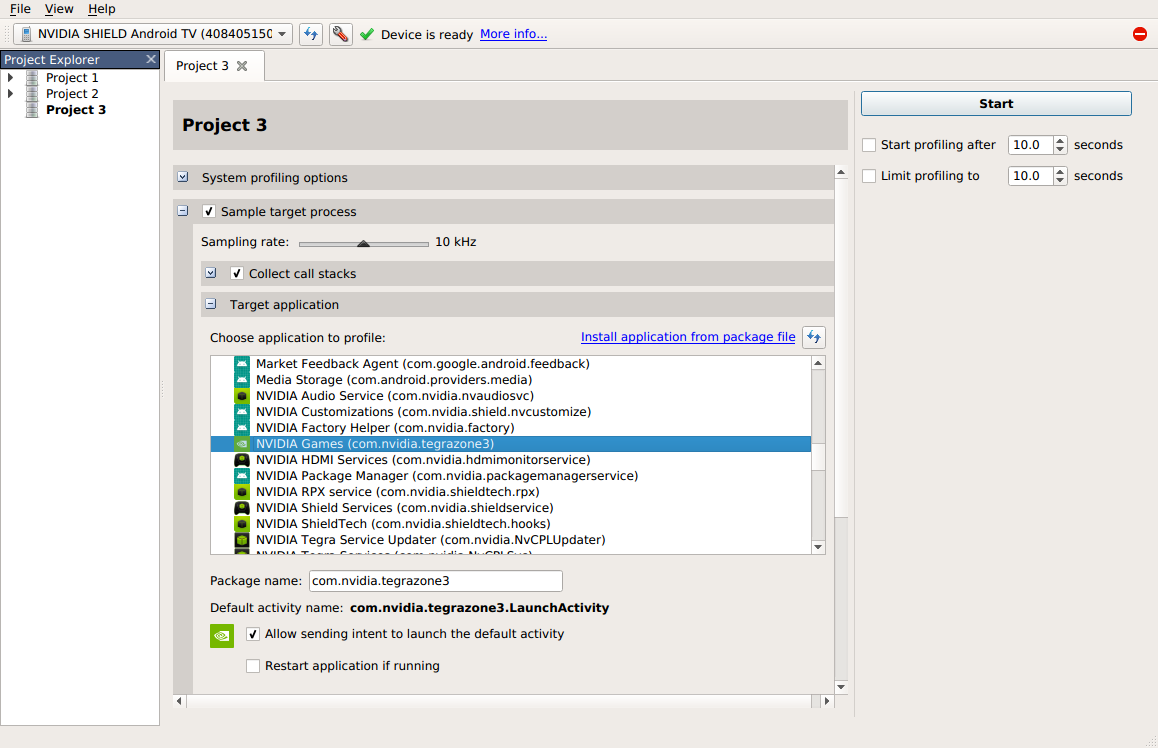
Application
This section allows you to choose which application to profile. All information will be collected about the main process of the selected application, except when the Trace all processes checkbox is enabled.
For non-rooted Android devices, the list of applications only shows information about debuggable applications. By default, applications that are being developed using the Android SDK already contain the debuggable option in their manifests.
On rooted Android devices, profiling of all applications is allowed.
For convenience, the application list also shows the process identifiers (PID) of processes correlated to the listed packages. To refresh this information, use the button in the upper right corner of the list.
The two checkboxes below the application list are important to ensure that the correct launch or attach behavior is configured.
Allow sending intent to launch the default activity, when unselected, forces the profiler to attach to a running process. If no processes are found to correlate to the specified application name, the profiling session fails to start with an error message. When selected, Nsight Systems may launch the default intent of the selected application to make sure it is running and appears on top of the screen on the target device.
In some applications, especially in early stages of development, common bugs related to handling the lifecycle of activities can be found. In such cases, sending the default intent may lead to undesired behavior or even crashes of the profilee. Leaving the checkbox unselected ensures that the profiler does not affect the application.
Restart application if running is a convenient option in two cases:
-
When profiling from the very beginning of the application is desired.
-
When using some of the trace features described below. They require that a special library is injected into the application in runtime, which happens when the application is paused by the Android runtime's virtual machine just after starting. In this case, enabling this option helps ensure that the application is always restarted and the injection always happens, as opposed to potentially attaching to the application's process without injection.
Collect NVTX trace. See NVTX Trace for more information.
Collect OpenGL trace. See OpenGL Trace for more information.
4. Profiling QNX Targets from the GUI
Profiling on QNX devices is similar to the profiling on Linux devices. Please refer to the Profiling Linux Targets from the GUI section for the detailed documentation. The major differences on the platforms are listed below:
-
Backtrace sampling is not supported. Instead backtraces are collected for long OS runtime libraries calls. Please refer to the OS Runtime Libraries Trace section for the detailed documentation.
-
CUDA support is limited to CUDA 9.0+
-
Filesystem on QNX device might be mounted read-only. In that case Nsight Systems is not able to install target-side binaries, required to run the profiling session. Please make sure that target filesystem is writable before connecting to QNX target. For example, make sure the following command works:
echo XX > /xx && ls -l /xx
5. CLI Profiling on Linux
5.1. Installing the CLI on Your Target
The Nsight Systems CLI provides a simple interface to collect on a target without using the GUI. The collected data can then be copied to any system and analyzed later.
The CLI is distributed in the Target directory of the standard Nsight Systems download package. Users who want to install the CLI as a standalone tool can do so by copying the files within the Target directory. If you want the CLI output file (.qdstrm) to be auto-converted (to .qdrep) after the analysis is complete, you will need to copy the host directory as well.
If you wish to run the CLI without root (recommended mode), you will want to install in a directory where you have full access.
5.2. Command Line Options
The Nsight Systems command lines can have one of two forms:
nsys [global_option]or
nsys [command_switch][optional command_switch_options][application] [optional application_options]All command line options are case sensitive. For command switch options, when short options are used, the parameters should follow the switch after a space; e.g. -s cpu. When long options are used, the switch should be followed by an equal sign and then the parameter(s); e.g. --sample=cpu.
For this version of Nsight Systems, you must launch a process from the command line to begin analysis. If an instance of the requested process is already running when the CLI command is issued, the collection will fail. The launched process will be terminated when collection is complete unless the user specifies the --kill none option (details below).
The Nsight Systems CLI supports concurrent analysis by using sessions. Each Nsight Systems session is defined by a sequence of CLI commands that define one or more collections (e.g. when and what data is collected). A session begins with either a start, launch, or profile command. A session ends with a shutdown command, when a profile command terminates, or, if requested, when all the process tree(s) launched in the session exit. Multiple sessions can run concurrently on the same system.
A couple of notes about the use of paths in your command line.
-
The Nsight Systems command line interface does not handle paths with spaces properly. Please use paths without spaces
-
If you run a command (like python X Y Z) from a directory where the command is not located (like /home/mystuff), and the directory includes a sub-directory with the same name as the command (like /home/mystuff/python), the command line parser will interpret that as "/home/mystuff/python X Y Z". This will not work because python, in this context, would reference the directory, not an executable. Please either run from the command's home directory or use the full path to the command.
5.2.1. CLI Global Options
| Short | Long | Description |
|---|---|---|
| -h | --help | Help message providing information about available command switches and their options. |
| -v | --version | Output Nsight Systems CLI version information. |
5.3. CLI Command Switches
The Nsight Systems command line interface can be used in two modes. You may launch your application and begin analysis with options specified to the nsys profile command. Alternatively, you can control the launch of an application and data collection using interactive CLI commands.
| Command | Description |
|---|---|
| profile | A fully formed profiling description requiring and accepting no further input. The command switch options used (see below table) determine when the collection starts, stops, what collectors are used (e.g. API trace, IP sampling, etc.), what processes are monitored, etc. |
| start | Start a collection in interactive mode. The start command can be executed before or after a launch command. |
| stop | Stop a collection that was started in interactive mode. When executed, all active collections stop, the CLI process terminates but the application continues running. |
| cancel | Cancels an existing collection started in interactive mode. All data already collected in the current collection is discarded. |
| launch | In interactive mode, launches an application in an environment that supports the requested options. The launch command can be executed before or after a start command. |
| shutdown | Disconnects the CLI process from the launched application and forces the CLI process to exit. If a collection is pending or active, it is cancelled |
| export | Generates an export file from an existing .qdrep file. For more information about the exported formats see the /documentation/nsys-exporter directory in your Nsight Systems installation directory. |
| status | Reports on the status of a CLI-based collection or the suitability of the profiing environment. |
| sessions | Gives information about all sessions running on the system. |
| nvprof | Special option to help with transition from legacy NVIDIA nvprof tool. Calling nsys nvprof [options] will provide the best available translation of nvprof [options] See Migrating from NVIDIA nvprof topic for details. No additional functionality of nsys will be available when using this option. Note: Not available on IBM Power targets. |
5.3.1. CLI Profile Command Switch Options
After choosing the profile command switch, the following options are available. Usage:
nsys [global-options] profile [options] <application> [application-arguments]| Short | Long | Possible Parameters | Default | Switch Description |
|---|---|---|---|---|
| -t | --trace | cublas, cuda, cudnn, nvtx, opengl, openacc, openmp, osrt, mpi, vulkan, none | cuda, opengl, nvtx, osrt | Select the API(s) to be traced. The osrt switch controls the OS runtime libraries tracing. Multiple APIs can be selected, separated by commas only (no spaces). Since OpenACC, cuDNN and cuBLAS APIs are tightly linked with CUDA, selecting one of those APIs will automatically enable CUDA tracing. See information on --mpi-impl option below if mpi is selected. If the none option is selected, no APIs are traced and no other API can be selected. Note: cublas, cudnn, opengl, and vulkan are not available on IBM Power target. |
| --mpi-impl | openmpi,mpich | openmpi | When using --trace=mpi to trace MPI APIs use --mpi-impl to specify which MPI implementation the application is using. If you are using a different MPI implementation, see Tracing MPI API calls section below. Calling --mpi-impl without --trace=mpi is not supported. | |
| -s | --sample | cpu, none | cpu | Select whether or not to collect CPU samples. If none is selected, sampling is disabled. |
| -b | --backtrace | fp,lbr,dwarf,none | lbr | Select the backtrace method to use while sampling. The option lbr uses Intel(c) Corporation's Last Branch Records, available only with Intel(c) CPUs codenamed Haswell and later. The option fp is frame pointer and assumes that frame pointers were enabled during compilation. The option dwarf uses DWARF's CFI (Call Frame Information). |
| --command-file | < filename > | none | Open a file that contains profile switches and parse the switches. Note additional switches on the command line will override switches in the file. | |
| -y | --delay | < seconds > | 0 | Collection start delay in seconds. |
| -d | --duration | < seconds > | NA | Collection duration in seconds, duration must be greater than zero. Note that the profiler does not detach from the application, it lives until application termination. |
| -e | --env-var | A=B | NA | Set environment variable(s) for the application process to be launched. Environment variables should be defined as A=B. Multiple environment variables can be specified as A=B,C=D. |
| --osrt-threshold | < nanoseconds > | 1000 ns | Set the minimum time that a OS Runtime event must take before it is collected. Setting this value too low can cause high application overhead and seriously increase the size of your results file. Note: Not available for IBM Power targets. | |
| --cudabacktrace | true,false | false | When tracing CUDA APIs, this option enables collection of a backtrace when a CUDA API is invoked. This may lead to significant runtime overhead. See the --cudabacktrace-threshold switch. Note: CPU sampling must be enabled to collect CUDA API backtraces. Note: Not available on IBM Power Targets. | |
| --cudabacktrace-threshold | < nanoseconds > | 1000 ns | Set the duration, in nanoseconds, that CUDA APIs must execute before backtraces are collected. Setting this value too low can cause high application overhead and seriously increase the size of your results file. Note: Not relevant to IBM Power targets. | |
| -o | --output | < filename > | report# | Set the .qdstrm filename. Any %q{ENV_VAR} pattern in the name will be substituted with the value of the environment variable. Any %h pattern in the filename will be substituted with the hostname of the system. The extension .qdstrm will be automatically appended. The default is report1.qdstrm, with the number incrementing to avoid overwriting files, in /home/user/nvidia_nsight_systems working directory. |
| --export | sqlite, none | none | Create additional output file(s) based on the data collected. Current options are sqlite or none. WARNING: If the collection captures a large amount of data, creating the database file may take several minutes to complete. | |
| --stats | true, false | false | Generate summary statistics after the collection. WARNING: When set to true, an SQLite database will be created after the collection. If the collection captures a large amount of data, creating the database file may take several minutes to complete. | |
| -f | --force-overwrite | true, false | false | If true, overwrite all existing result files with same output filename (.qdstrm,.qdrep, .sqlite) |
| -w | --show-output | true, false | true | If true, send target process’ stdout and stderr streams to the console. |
| -n | --inherit-environment | true, false | true | When true, the current environment variables and the tool’s environment variables will be specified for the launched process. When false, only the tool’s environment variables will be specified for the launched process. |
| -x | --stop-on-exit | true, false | true | If true, stop collecting automatically when the launched process has exited or when the duration expires - whichever occurs first. If false, duration must be set and the collection stops only when the duration expires. Nsight Systems does not officially support runs longer than 5 minutes. |
| --wait | primary,all | all | If primary, the CLI will wait on the application process termination. If all, the CLI will additionally wait on re-parented processes created by the application. | |
| --trace-fork-before-exec | true, false | false | If true, trace any child process after fork and before they call one of the exec functions. Beware, tracing in this interval relies on undefined behavior and might cause your application to crash or deadlock. | |
| -c | --capture-range | none, cudaProfilerApi, nvtx | none | When -c cudaProfilerApi (or nvtx) is used, profiling will start only when cudaProfilerStart API is invoked or the specified NVTX range (specified using -p/--nvtx-capture) is started in the application. |
| --stop-on-range-end | true,false | true | Stop profiling when the capture range ends. Applicable only when used along with --capture-range option. | |
| -p | --nvtx-capture | range@domain,range,range@ | Specify NVTX capture range. See below for details. This option is applicable only when used along with --capture-range=nvtx. | |
| --ftrace | Collect ftrace events. Argument should list events to collect as: subsystem1/event1,subsystem2/event2. Requires root. No ftrace events are collected by default. Note: Not available on IBM Power targets. | |||
| --ftrace-keep-user-config | Skip initial ftrace setup and collect already configured events. Default resets the ftrace configuration. | |||
| --gpuctxsw | true,false | false | Trace GPU context switches. Note that this requires driver r435.17 or later and root permission. Not available on IBM Power targets. | |
| --kill | none, sigkill, sigterm, signal number | sigterm | Send signal to the target application's process group. | |
| --session-new | [a-Z][0-9,a-Z,spaces] | profile-<id>-<application> | Name the session created by the command. Name must start with an alphabetical character followed by printable or space characters. Any %q{ENV_VAR} pattern will be substituted with the value of the environment variable. Any %h pattern will be substituted with the hostname of the system. Any %% pattern will be substituted with %. |
5.3.2. CLI Launch Command Switch Options
After choosing the launch command switch, the following options are available. Usage:
nsys [global-options] launch [options] <application> [application-arguments]| Short | Long | Possible Parameters | Default | Switch Description |
|---|---|---|---|---|
| -t | --trace | cublas, cuda, cudnn, nvtx, opengl, openacc, openmp, osrt, mpi, vulkan, none | cuda, opengl, nvtx, osrt | Select the API(s) to be traced. The osrt switch controls the OS runtime libraries tracing. Multiple APIs can be selected, separated by commas only (no spaces). Since OpenACC, cuDNN and cuBLAS APIs are tightly linked with CUDA, selecting one of those APIs will automatically enable CUDA tracing. See information on --mpi-impl option below if mpi is selected. If the none option is selected, no APIs are traced and no other API can be selected. Note: cublas, cudnn, opengl, and vulkan are not available on IBM Power target. |
| --mpi-impl | openmpi,mpich | openmpi | When using --trace=mpi to trace MPI APIs use --mpi-impl to specify which MPI implementation the application is using. If you are using a different MPI implementation, see Tracing MPI API calls section below. Calling --mpi-impl without --trace=mpi is not supported. | |
| -s | --sample | cpu, none | cpu | Select whether or not to collect CPU samples. If none is selected, sampling is disabled. |
| -b | --backtrace | fp,lbr,dwarf,none | lbr | Select the backtrace method to use while sampling. The option lbr uses Intel(c) Corporation's Last Branch Records, available only with Intel(c) CPUs codenamed Haswell and later. The option fp is frame pointer and assumes that frame pointers were enabled during compilation. The option dwarf uses DWARF's CFI (Call Frame Information). |
| --command-file | < filename > | none | Open a file that contains launch switches and parse the switches. Note additional switches on the command line will override switches in the file. | |
| -e | --env-var | A=B | NA | Set environment variable(s) for the application process to be launched. Environment variables should be defined as A=B. Multiple environment variables can be specified as A=B,C=D. |
| --osrt-threshold | < nanoseconds > | 1000 ns | Set the minimum time that a OS Runtime event must take before it is collected. Setting this value too low can cause high application overhead and seriously increase the size of your results file. Note: Not available for IBM Power targets. | |
| --cudabacktrace | true,false | false | When tracing CUDA APIs, this option enables collection of a backtrace when a CUDA API is invoked. This may lead to significant runtime overhead. See the --cudabacktrace-threshold switch. Note: CPU sampling must be enabled to collect CUDA API backtraces. Note: Not available on IBM Power targets. | |
| --cudabacktrace-threshold | < nanoseconds > | 1000 ns | Set the duration, in nanoseconds, that CUDA APIs must execute before backtraces are collected. Setting this value too low can cause high application overhead and seriously increase the size of your results file.Note: Not relevant to IBM Power targets. | |
| -w | --show-output | true, false | true | If true, send target process’ stdout and stderr streams to the console |
| -n | --inherit-environment | true, false | true | When true, the current environment variables and the tool’s environment variables will be specified for the launched process. When false, only the tool’s environment variables will be specified for the launched process. |
| -p | --nvtx-capture | message@idomain | none | Specify NVTX capture range. See below for details. |
| --trace-fork-before-exec | true, false | false | If true, trace any child process after fork and before they call one of the exec functions. Beware, tracing in this interval relies on undefined behavior and might cause your application to crash or deadlock. | |
| --wait | primary,all | all | If primary, the CLI will wait on the application process termination. If all, the CLI will additionally wait on re-parented processes created by the application. | |
| --session | session identifier | none | Launch the application in the indicated session. The option argument must represent a valid session name or ID as reported by nsyssessions list. Any %q{ENV_VAR} pattern will be substituted with the value of the environment variable. Any %h pattern will be substituted with the hostname of the system. Any %% pattern will be substituted with %. | |
| --session-new | [a-Z][0-9,a-Z,spaces] | [default] | Launch the application in a new session. Name must start with an alphabetical character followed by printable or space characters. Any %q{ENV_VAR} pattern will be substituted with the value of the environment variable. Any %h pattern will be substituted with the hostname of the system. Any %% pattern will be substituted with %. |
5.3.3. CLI Start Command Switch Options
After choosing the start command switch, the following options are available. Usage:
nsys [global-options] start [options]| Short | Long | Possible Parameters | Default | Switch Description |
|---|---|---|---|---|
| -c | --capture-range | none, cudaProfilerApi, nvtx | none | If set to cudaProfilerApi, profiling will start on the first call to cudaProfilerStart. Valid only with CUDA tracing enabled. If set to nvtx the profiling will start when the first NVTX capture range is started (see below for NVTX capture range definition). |
| -o | --output | < filename > | report# | Set the .qdstrm filename. Any %q{ENV_VAR} pattern in the name will be substituted with the value of the environment variable. Any %h pattern in the filename will be substituted with the hostname of the system. The extension .qdstrm will be automatically appended. The default is report1.qdstrm, with the number incrementing to avoid overwriting files, in /home/user/nvidia_nsight_systems working directory. |
| --export | sqlite, none | none | Create additional output file(s) based on the data collected. Current options are sqlite or none. WARNING: If the collection captures a large amount of data, creating the database file may take several minutes to complete. | |
| --stats | true, false | false | Generate summary statistics after the collection. WARNING: When set to true, an SQLite database will be created after the collection. If the collection captures a large amount of data, creating the database file may take several minutes to complete. | |
| -f | --force-overwrite | true, false | false | If true, overwrite all existing result files with same output filename (.qdstrm,.qdrep, .sqlite) |
| -x | --stop-on-exit | true, false | true | If true, stop collecting automatically when all tracked processes have exited or when stop command is issued - whichever occurs first. If false, stop only on stop command. Note: When this is true, stop command is optional. Nsight Systems does not officially support runs longer than 5 minutes. |
| --stop-on-range-end | true, false | true | If true, stop collecting when the specified capture range ends. Valid only when --capture-range is set. | |
| --ftrace | Collect ftrace events. Argument should list events to collect as: subsystem1/event1,subsystem2/event2. Requires root. No ftrace events are collected by default. Note: Not supported on IBM Power targets. | |||
| --ftrace-keep-user-config | Skip initial ftrace setup and collect already configured events. Default resets the ftrace configuration. | |||
| --gpuctxsw | true,false | false | Trace GPU context switches. Note that this requires driver r435.17 or later and root permission. Not supported on IBM Power targets. | |
| --session | session identifier | none | Start the application in the indicated session. The option argument must represent a valid session name or ID as reported by nsyssessions list. Any %q{ENV_VAR} pattern will be substituted with the value of the environment variable. Any %h pattern will be substituted with the hostname of the system. Any %% pattern will be substituted with %. | |
| --session-new | [a-Z][0-9,a-Z,spaces] | [default] | Start the application in a new session. Name must start with an alphabetical character followed by printable or space characters. Any %q{ENV_VAR} pattern will be substituted with the value of the environment variable. Any %h pattern will be substituted with the hostname of the system. Any %% pattern will be substituted with %. |
5.3.4. CLI Export Command Switch Options
After choosing the export command switch, the following options are available. Usage:
nsys [global-options] export [options] [qdrep-file]| Short | Long | Possible Parameters | Default | Switch Description |
|---|---|---|---|---|
| -o | --output | <filename> | <inputfile.ext> | Set the .output filename. The default is the .qdrep filename with the extension for the chosen format. |
| -t | --type | sqlite, hdr, text, json, info | sqlite | Export format type. HDF format is supported only on x86_64 Linux and Windows |
| -f | --force-overwrite | true, false | false | If true, overwrite existing result file |
| -q | --quiet | true, false | false | If true, do not display progress bar |
| --separate-strings | true,false | false | Output stored strings and thread names separately, with one value per line. This affects JSON and text output only. |
5.3.5. CLI Status Command Switch Options
After choosing the status command switch, the following options are available. Usage:
nsys [global-options] status [options]| Short | Long | Possible Parameters | Default | Switch Description |
|---|---|---|---|---|
| <none> | Returns current state of the CLI. | |||
| -e | --environment | Returns information about the system regarding suitability of the profiling environment. | ||
| --session | session identifier | none | Print the status of the indicated session. The option argument must represent a valid session name or ID as reported by nsyssessions list. Any %q{ENV_VAR} pattern will be substituted with the value of the environment variable. Any %h pattern will be substituted with the hostname of the system. Any %% pattern will be substituted with %. |
5.3.6. CLI Shutdown Command Switch Options
After choosing the shutdown command switch, the following options are available. Usage:
nsys [global-options] shutdown [options]| Short | Long | Possible Parameters | Default | Switch Description |
|---|---|---|---|---|
| --kill | none, sigkill, sigterm, signal number | sigterm | Send signal to the target application's process group. | |
| --session | session identifier | none | Shutdown the indicated session. The option argument must represent a valid session name or ID as reported by nsys sessions list. Any %q{ENV_VAR} pattern will be substituted with the value of the environment variable. Any %h pattern will be substituted with the hostname of the system. Any %% pattern will be substituted with %. |
5.3.7. CLI Cancel Command Switch Options
After choosing the cancel command switch, the following options are available. Usage:
nsys [global-options] cancel [options]| Short | Long | Possible Parameters | Default | Switch Description |
|---|---|---|---|---|
| --session | session identifier | none | Cancel the indicated session. The option argument must represent a valid session name or ID as reported by nsyssessions list. Any %q{ENV_VAR} pattern will be substituted with the value of the environment variable. Any %h pattern will be substituted with the hostname of the system. Any %% pattern will be substituted with %. |
5.3.8. CLI Stop Command Switch Options
After choosing the stop command switch, the following options are available. Usage:
nsys [global-options] stop [options]| Short | Long | Possible Parameters | Default | Switch Description |
|---|---|---|---|---|
| --session | session identifier | none | Stop the indicated session. The option argument must represent a valid session name or ID as reported by nsyssessions list. Any %q{ENV_VAR} pattern will be substituted with the value of the environment variable. Any %h pattern will be substituted with the hostname of the system. Any %% pattern will be substituted with %. |
5.3.9. CLI Sessions Command Switch Subcommands
After choosing the sessions command switch, the following subcommands are available. Usage:
nsys [global-options] sessions [subcommand]| Subcommand | Description |
|---|---|
| list | List all active sessions including ID, name, and state information |
5.4. Example Single Command Lines
Version Information
nsys -vEffect: Prints tool version information to the screen.
Default analysis run
nsys profile <application> [application-arguments]Effect: Launch the application using the given arguments. Start collecting immediately and end collection when the application stops. Trace CUDA, OpenGL, NVTX, and OS runtime libraries APIs. Collect CPU sampling information. Profile any child processes. Generate the report#.qdstrm file in the default location, incrementing the report number if needed to avoid overwriting any existing output files.
Limited trace only run
nsys profile --trace=cuda,nvtx -d 20 --sample=none
-o my_test <application> [application-arguments]
Effect: Launch the application using the given arguments. Start collecting immediately and end collection after 20 seconds or when the application ends. Trace CUDA and NVTX APIs only. Do not collect CPU sampling information. Profile any child processes. Generate the output file as my_test.qdstrm in the current working directory.
Delayed start run
nsys profile -e TEST_ONLY=0 -y 20 <application> [application-arguments]Effect: Set environment variable TEST_ONLY=0. Launch the application using the given arguments. Start collecting after 20 seconds and end collection at application exit. Trace CUDA, OpenGL, NVTX, and OS runtime libraries APIs. Collect CPU sampling information. Profile any child processes. Generate the report#.qdstrm file in the default location, incrementing if needed to avoid overwriting any existing output files.
Collect ftrace events
nsys profile --ftrace=drm/drm_vblank_event -d 20Effect: Collect ftrace drm_vblank_event events for 20 seconds. Generate the report#.qdstrm file in the current working directory. Note that ftrace event collection requires running as root. To get a list of ftrace events available from the kernel, run the following:
sudo cat /sys/kernel/debug/tracing/available_events
Typical case: profile a Python script that uses CUDA
nsys profile --trace=cuda,cudnn,cublas,osrt,nvtx --delay=60 python my_dnn_script.pyEffect: Launch a Python script and start profiling it 60 seconds after the launch, tracing CUDA, cuDNN, cuBLAS, OS runtime APIs, and NVTX.
Typical case: profile an app that uses Vulkan
nsys profile --trace=vulkan,osrt,nvtx --delay=60 ./myappEffect: Launch an app and start profiling it 60 seconds after the launch, tracing Vulkan, OS runtime APIs, and NVTX.
5.5. Example Interactive CLI Command Sequences
Collect from beginning of application, end manually
nsys start --stop-on-exit=false
nsys launch --trace=cuda,nvtx --sample=none <application> [application-arguments]
nsys stop
Effect: Create interactive CLI process and set it up to begin collecting as soon as an application is launched. Launch the application, set up to allow tracing of CUDA and NVTX only. Stop only when explicitly requested. Generate the report#.qdstrm in the default location.
Note:
If you start a collection and fail to stop the collection (or if you are allowing it to stop on exit, and the application runs for too long) your system’s storage space may be filled with collected data causing significant issues for the system. Nsight Systems will collect a different amount of data/sec depending on options, but in general Nsight Systems does not support runs of more than 5 minutes duration.
Run application, begin collection manually, run until process ends
nsys launch -w true <application> [application-arguments]
nsys start
Effect: Create interactive CLI and launch an application set up for default analysis. Send application output to the terminal. No data is collected until you manually start collection at area of interest. Profile until the application ends. Generate the report#.qdstrm in the default location.
Note:
If you launch an application and that application and any descendants exit before start is called Nsight Systems will create a fully formed .qdstrm file containing no data.
Run application, start/stop collection using cudaProfilerStart/Stop
nsys start -c cudaProfileApi
nsys launch -w true <application> [application-arguments]
Effect: Create interactive CLI process and set it up to begin collecting as soon as a cudaProfileStart() is detected. Launch application for default analysis, sending application output to the terminal. Stop collection at next call to cudaProfilerStop, when the user calls nsys stop, or when the root process terminates. Generate the report#.qdstrm in the default location.
Note:
If you call nsys launch before nsys start -c cudaProfilerApi and the code contains a large number of short duration cudaProfilerStart/Stop pairs, Nsight Systems may be unable to process them correctly, causing a fault. This will be corrected in a future version.
Note:
The Nsight Systems CLI does not support multiple calls to the cudaProfilerStart/Stop API at this time.
Run application, start/stop collection using NVTX
nsys start -c nvtx
nsys launch -w true -p MESSAGE@DOMAIN <application> [application-arguments]
Effect: Create interactive CLI process and set it up to begin collecting as soon as an NVTX range with given message in given domain (capture range) is opened. Launch application for default analysis, sending application output to the terminal. Stop collection when all capture ranges are closed, when the user calls nsys stop, or when the root process terminates. Generate the report#.qdstrm in the default location.
Note:
The Nsight Systems CLI only triggers the profiling session for the first capture range.
NVTX capture range can be specified:
-
Message@Domain: All ranges with given message in given domain are capture ranges. For example:
nsys launch -w true -p profiler@service ./appThis would make the profiling start when the first range with message "profiler" is opened in domain "service".
-
Message@*: All ranges with given message in all domains are capture ranges. For example:
nsys launch -w true -p profiler@* ./appThis would make the profiling start when the first range with message "profiler" is opened in any domain.
-
Message: All ranges with given message in default domain are capture ranges. For example:
nsys launch -w true -p profiler ./appThis would make the profiling start when the first range with message "profiler" is opened in the default domain.
-
By default only messages, provided by NVTX registered strings are considered to avoid additional overhead. To enable non-registered strings check please launch your application with NSYS_NVTX_PROFILER_REGISTER_ONLY=0 environment:
nsys launch -w true -p profiler@service -e NSYS_NVTX_PROFILER_REGISTER_ONLY=0 ./app
Run application, start/stop collection multiple times
The interactive CLI supports multiple sequential collections per launch.
nsys launch <application> [application-arguments]
nsys start
nsys stop
nsys start
nsys stop
nsys shutdown --kill sigkill
Effect: Create interactive CLI and launch an application set up for default analysis. Send application output to the terminal. No data is collected until the start command is executed. Collect data from start until stop requested, generate report#.qdstrm in the current working directory. Collect data from second start until the secont stop request, generate report#.qdstrm (incremented by one) in the current working directory. Shutdown the interactive CLI and send sigkill to the target application's process group.
Note:
Calling nsys cancel after nsys start will cancel the collection without generating a report.
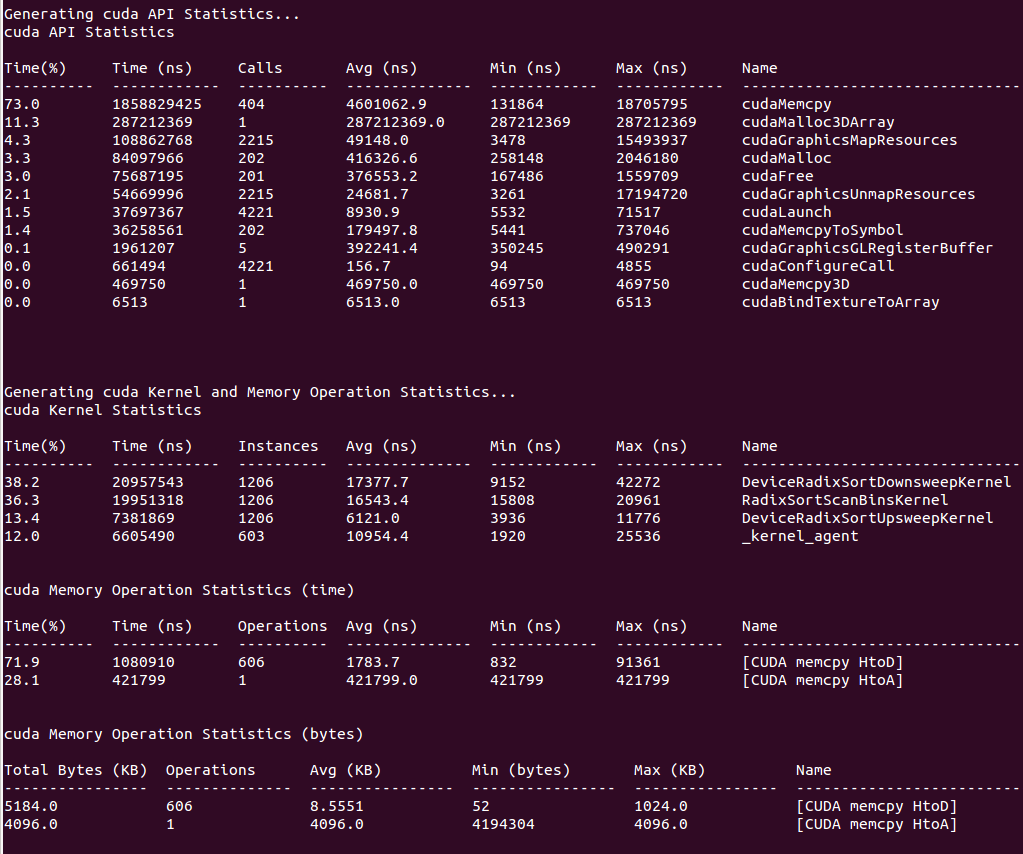
5.6. Example Output from --stats Option
You use the --stats option with the nsys profile or nsys start command to generate a set of useful summary statistics.
If your run traces CUDA, these include CUDA API, Kernel, and Memory Operation statistics:
If your run traces OS runtime events or NVTX push-pop ranges:
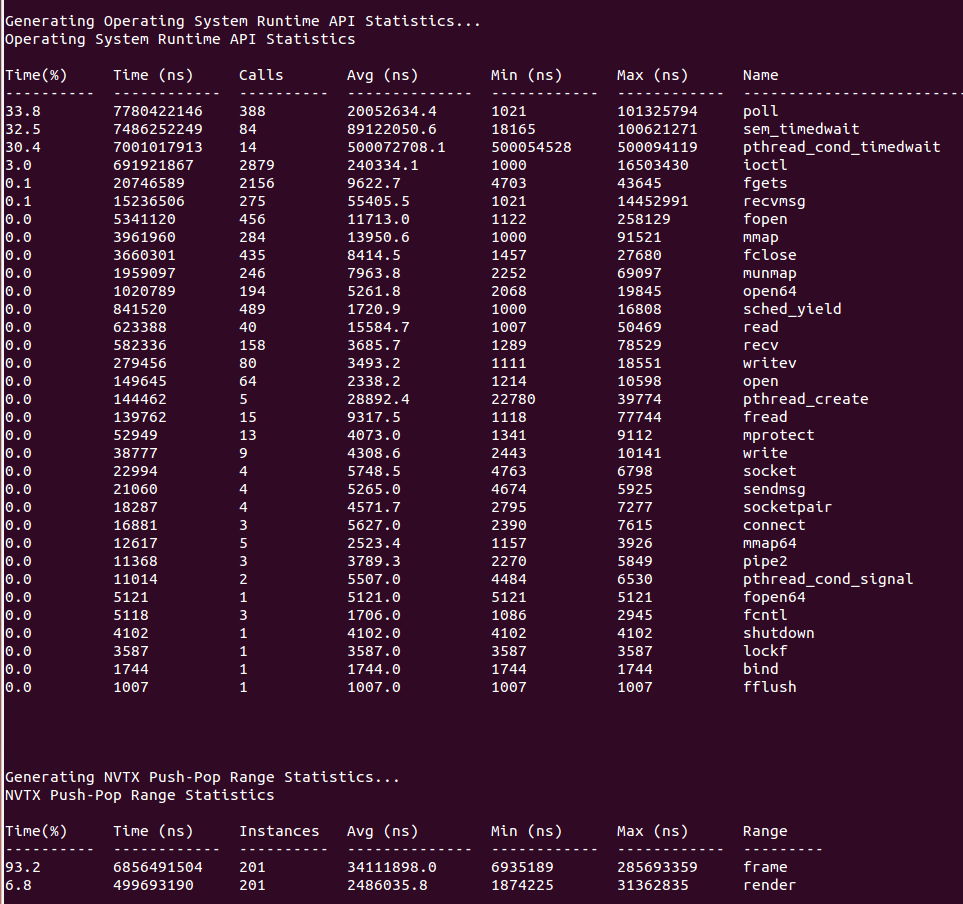
Recipes for these statistics as well as documentation on how to create your own metrics will be available in a future version of the tool.
5.7. Importing and Viewing Command Line Results Files
The CLI generates a .qdstrm file. The .qdstrm file is an intermediate result file, not intended for multiple imports. It needs to be processed, either by importing it into the GUI or by using the standalone QdstrmImporter to generate an optimized .qdrep file. Use this .qdrep file when re-opening the result on the same machine, opening the result on a different machine, or sharing results with teammates.
This version of Nsight Systems will attempt to automatically convert the .qdstrm file to a .qdrep file with the same name after the run finishes if the required libraries are available. The ability to turn off auto-conversion will be added in a later version.
Import Into the GUI
The CLI and host GUI versions must match to import a .qdstrm file successfully. The host GUI is backward compatible only with .qdrep files.
Copy the .qdstrm file you are interested in viewing to a system where the Nsight Systems host GUI is installed. Launch the Nsight Systems GUI. Select File->Import... and choose the .qdstrm file you wish to open.
The import of really large, multi-gigabyte, .qdstrm files may take up all of the memory on the host computer and lock up the system. This will be fixed in a later version.
Create .qdrep Using QdstrmImporter
The CLI and QdstrmImporter versions must match to convert a .qdstrm file into a .qdrep file. This .qdrep file can then be opened in the same version or more recent versions of the GUI.
To run QdstrmImporter on the host system, find the QdstrmImporter binary in the Host-x86_64 directory in your installation. QdstrmImporter is available for all host platforms. See options below.
To run QdstrmImporter on the target system, copy the Linux Host-x86_64 directory to the target Linux system or install Nsight Systems for Linux host directly on the target. The Windows or MacOS host QdstrmImporter will not work on a Linux Target. See options below.
| Short | Long | Parameter | Description |
|---|---|---|---|
| -h | --help | Help message providing information about available options and their parameters. | |
| -v | --version | Output QdstrmImporter version information | |
| -i | --input-file | filename or path | Import .qdstrm file from this location. |
| -o | --output-file | filename or path | Provide a different file name or path for the resulting .qdrep file. Default is the same name and path as the .qdstrm file |
5.8. Using the CLI to Analyze MPI Codes
5.8.1. Tracing MPI API calls
The Nsight Systems CLI has built-in API trace support via --trace=mpi option only for the OpenMPI and MPICH implementations of MPI. It traces a default list of synchronous MPI APIs. If you require more control over the list of traced APIs or if you are using a different MPI implementation, see github nvtx pmpi wrappers.
You can use this documentation to generate a shared object to wrap a list of synchronous MPI APIs with NVTX using the MPI profiling interface (PMPI). If you set your LD_PRELOAD environment variable to the path of that object, nsys will capture and report the MPI API trace information when --trace=nvtx is used. There is no need to use --trace=MPI.
NVTX tracing is automatically enabled when MPI trace is turned on.
5.8.2. Using the CLI to Profile Applications Launched with mpirun
This version of the Nsight Systems CLI supports concurrent use of the nsys profile command. Each instance will create a separate report file.
You cannot use multiple instances of the interactive CLI concurrently, or use the interactive CLI concurrently with nsys profile in this version.
Nsight Systems can be used to profile applications launched with mpirun command. Since concurrent use of the CLI is supported only when using the nsys profile command, Nsight Systems cannot profile each node from the GUI or from the interactive CLI.
To profile everything, putting the data in one file:
nsys [nsys options] mpirun [mpi options]
To profile everything putting the data from each rank into a separate file:
mpirun [mpi options] nsys profile [nsys options]
#!/bin/bash
if [[ $OMPI_COMM_WORLD_RANK == 0 ]]; then
~/nsys/nsys profile ./myapp "$@" --mydummyargument
else
./myapp "$@"
fi
and then execute mpirun ./wrap.sh.
Note:
Currently you will need a dummy argument to the process, so that Nsight Systems can decide which process to profile. This means that your process must accept dummy arguments to take advantage of this workaround. This script as written is for Open MPI, but should be easily adaptable to other MPI implementations.
6. Migrating from NVIDIA nvprof
Using the Nsight Systems CLI nvprof Command
The nvprof command of the Nsight Systems CLI is intended to help former nvprof users transition to nsys. Many nvprof switches are not supported by nsys, often because they are now part of NVIDIA Nsight Compute.
The full nvprof documentation can be found at https://docs.nvidia.com/cuda/profiler-users-guide.
The nvprof transition guide for Nsight Compute can be found at https://docs.nvidia.com/nsight-compute/NsightComputeCli/index.html#nvprof-guide.
Any nvprof switch not listed below is not supported by the nsys nvprof command. No additional nsys functionality is available through this command. New features will not be added to this command in the future.
CLI nvprof Command Switch Options
After choosing the nvprof command switch, the following options are available. When you are ready to move to using Nsight Systems CLI directly, see Command Line Options documentation for the nsys switch(es) given below. Note that the nsys implementation and output may vary from nvprof.
Usage.
nsys nvprof [options]| Switch | Parameters (Default in Bold) | nsys switch | Switch Description |
|---|---|---|---|
| --annotate-mpi | off, openmpi, mpich | --trace=mpi AND --mpi-impl | Automatically annotate MPI calls with NVTX markers. Specify the MPI implementation installed on your machine. Only OpenMPI and MPICH implementations are supported. |
| --cpu-thread-tracing | on, off | --trace=osrt | Collect information about CPU thread API activity. |
| --profile-api-trace | none, runtime, driver,all | --trace=cuda | Turn on/off CUDA runtime and driver API tracing. For Nsight Systems there is no separate CUDA runtime and CUDA driver trace, so selecting runtime or driver is equivalent to selecting all . |
| --profile-from-start | on, off | if off use --capture-range=cudaProfilerApi | Enable/disable profiling from the start of the application. If disabled, the application can use {cu,cuda}Profiler{Start,Stop} to turn on/off profiling. |
| -t,--timeout | <nanoseconds> default=0 | --duration=seconds | If greater than 0, stop the collection and kill the launched application after timeout seconds. nvprof started counting when the CUDA driver is initialized. nsys starts counting immediately. |
| --cpu-profiling | on, off | --sampling=cpu | Turn on/off CPU profiling |
| --openacc-profiling | on, off | --trace=openacc to turn on | Enable/disable recording information from the OpenACC profiling interface. Note: OpenACC profiling interface depends on the presence of the OpenACC runtime. For supported runtimes, see CUDA Trace section of documentation |
| -o, --export-profile | <filename> | --output={filename} and/or --export=sqlite | Export named file to be imported or opened in the Nsight Systems GUI. %q{ENV_VAR} in string will be replaced with the set value of the environment variable. If not set this is an error. %h in the string is replaced with the system hostname. %% in the string is replaced with %. %p in the string is not supported currently. Any other character following % is illegal. The default is report1, with the number incrementing to avoid overwriting files, in users working directory. |
| -f, --force-overwrite | --force-overwrite=true | Force overwriting all output files with same name. | |
| -h, --help | --help | Print Nsight Systems CLI help | |
| -V, --version | --version | Print Nsight Systems CLI version information |
Next Steps
NVIDIA Visual Profiler (NVVP) and NVIDIA nvprof are deprecated. New GPUs and features will not be supported by those tools. We encourage you to make the move to Nsight Systems now. For additional information, suggestions, and rationale, see the blog series in Other Resources.
7. Profiling in a Docker on Linux Devices
Collecting data within a Docker
The following information assumes the reader is knowledgeable regarding Docker containers. For further information about Docker use in general, see the Docker documentation.
Enable Docker Collection
When starting the Docker to perform a Nsight Systems collection, additional steps are required to enable the perf_event_open system call. This is required in order to utilize the Linux kernel’s perf subsystem which provides sampling information to Nsight Systems.
There are three ways to enable the perf_event_open syscall. You can enable it by using the --privileged=true switch, adding --cap-add=SYS_ADMIN switch to your docker run command file, or you can enable it by setting the seccomp security profile if your system meets the requirements.
Secure computing mode (seccomp) is a feature of the Linux kernel that can be used to restrict an application's access. This feature is available only if the kernel is enabled with seccomp support. To check for seccomp support:
$ grep CONFIG_SECCOMP= /boot/config-$(uname -r)
The official Docker documentation says:
"Seccomp profiles require seccomp 2.2.1 which is not available on Ubuntu 14.04, Debian Wheezy, or Debian Jessie. To use seccomp on these distributions, you must download the latest static Linux binaries (rather than packages)."
{
    "name": "perf_event_open",
    "action": "SCMP_ACT_ALLOW",
    "args": []
},
Then you will be able to use the following switch when starting the Docker to apply the new seccomp profile.
--security-opt seccomp=default_with_perf.json
Launch Docker Collection
Here is an example command that has been used to launch a Docker for testing with Nsight Systems:
sudo nvidia-docker run --network=host --security-opt
seccomp=default_with_perf.json --rm -ti caffe-demo2 bash
There is a known issue where Docker collections terminate prematurely with older versions of the driver and the CUDA Toolkit. If collection is ending unexpectedly, please update to the latest versions.
After the Docker has been started, use the Nsight Systems CLI to launch a collection within the Docker. The resulting .qdstrm file can be imported into the Nsight Systems host like any other CLI result.
Notices
Notice
NVIDIA® Nsight™ Systems User GuideSend Feedback
THE INFORMATION IN THIS GUIDE AND ALL OTHER INFORMATION CONTAINED IN NVIDIA DOCUMENTATION REFERENCED IN THIS GUIDE IS PROVIDED “AS IS.” NVIDIA MAKES NO WARRANTIES, EXPRESSED, IMPLIED, STATUTORY, OR OTHERWISE WITH RESPECT TO THE INFORMATION FOR THE PRODUCT, AND EXPRESSLY DISCLAIMS ALL IMPLIED WARRANTIES OF NONINFRINGEMENT, MERCHANTABILITY, AND FITNESS FOR A PARTICULAR PURPOSE. Notwithstanding any damages that customer might incur for any reason whatsoever, NVIDIA’s aggregate and cumulative liability towards customer for the product described in this guide shall be limited in accordance with the NVIDIA terms and conditions of sale for the product.
THE NVIDIA PRODUCT DESCRIBED IN THIS GUIDE IS NOT FAULT TOLERANT AND IS NOT DESIGNED, MANUFACTURED OR INTENDED FOR USE IN CONNECTION WITH THE DESIGN, CONSTRUCTION, MAINTENANCE, AND/OR OPERATION OF ANY SYSTEM WHERE THE USE OR A FAILURE OF SUCH SYSTEM COULD RESULT IN A SITUATION THAT THREATENS THE SAFETY OF HUMAN LIFE OR SEVERE PHYSICAL HARM OR PROPERTY DAMAGE (INCLUDING, FOR EXAMPLE, USE IN CONNECTION WITH ANY NUCLEAR, AVIONICS, LIFE SUPPORT OR OTHER LIFE CRITICAL APPLICATION). NVIDIA EXPRESSLY DISCLAIMS ANY EXPRESS OR IMPLIED WARRANTY OF FITNESS FOR SUCH HIGH RISK USES. NVIDIA SHALL NOT BE LIABLE TO CUSTOMER OR ANY THIRD PARTY, IN WHOLE OR IN PART, FOR ANY CLAIMS OR DAMAGES ARISING FROM SUCH HIGH RISK USES.
NVIDIA makes no representation or warranty that the product described in this guide will be suitable for any specified use without further testing or modification. Testing of all parameters of each product is not necessarily performed by NVIDIA. It is customer’s sole responsibility to ensure the product is suitable and fit for the application planned by customer and to do the necessary testing for the application in order to avoid a default of the application or the product. Weaknesses in customer’s product designs may affect the quality and reliability of the NVIDIA product and may result in additional or different conditions and/or requirements beyond those contained in this guide. NVIDIA does not accept any liability related to any default, damage, costs or problem which may be based on or attributable to: (i) the use of the NVIDIA product in any manner that is contrary to this guide, or (ii) customer product designs.
Other than the right for customer to use the information in this guide with the product, no other license, either expressed or implied, is hereby granted by NVIDIA under this guide. Reproduction of information in this guide is permissible only if reproduction is approved by NVIDIA in writing, is reproduced without alteration, and is accompanied by all associated conditions, limitations, and notices.
Trademarks
NVIDIA, the NVIDIA logo, and cuBLAS, CUDA, CUDA-GDB, CUDA-MEMCHECK, cuDNN, cuFFT, cuSPARSE, DIGITS, DGX, DGX-1, DGX Station, NVIDIA DRIVE, NVIDIA DRIVE AGX, NVIDIA DRIVE Software, NVIDIA DRIVE OS, NVIDIA Developer Zone (aka "DevZone"), GRID, Jetson, NVIDIA Jetson Nano, NVIDIA Jetson AGX Xavier, NVIDIA Jetson TX2, NVIDIA Jetson TX2i, NVIDIA Jetson TX1, NVIDIA Jetson TK1, Kepler, NGX, NVIDIA GPU Cloud, Maxwell, Multimedia API, NCCL, NVIDIA Nsight Compute, NVIDIA Nsight Eclipse Edition, NVIDIA Nsight Graphics, NVIDIA Nsight Integration, NVIDIA Nsight Systems, NVIDIA Nsight Visual Studio Edition, NVLink, nvprof, Pascal, NVIDIA SDK Manager, Tegra, TensorRT, Tesla, Visual Profiler, VisionWorks and Volta are trademarks and/or registered trademarks of NVIDIA Corporation in the United States and other countries. Other company and product names may be trademarks of the respective companies with which they are associated.