1. Direct3D Trace
Nsight Systems has the ability to trace both the Direct3D 11 API and the Direct3D 12 API on Windows targets.
1.1. D3D11 API trace
Nsight Systems can capture information about Direct3D 11 API calls made by the profiled process. This includes capturing the execution time of D3D11 API functions, performance markers, and frame durations.
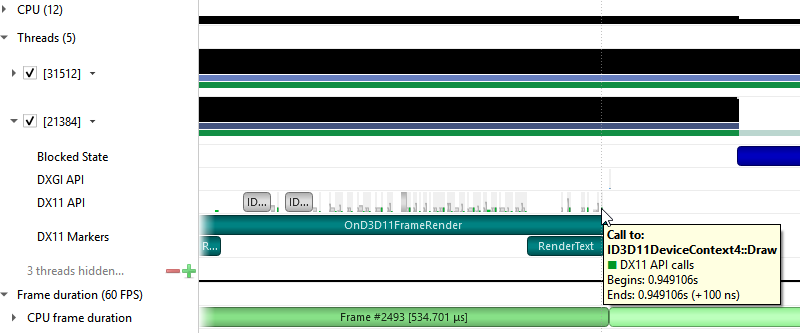
SLI Trace
Trace SLI queries and peer-to-peer transfers of D3D11 applications. Requires SLI hardware and an active SLI profile definition in the NVIDIA console.
1.2. D3D12 API Trace
Direct3D 12 is a low-overhead 3D graphics and compute API for Microsoft Windows. Information about Direct3D 12 can be found at the Direct3D 12 Programming Guide.
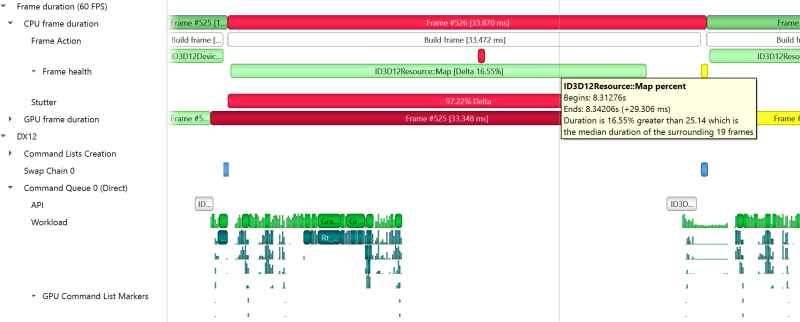
Nsight Systems can capture information about Direct3D 12 usage by the profiled process. This includes capturing the execution time of D3D12 API functions, corresponding workloads executed on the GPU, performance markers, and frame durations.
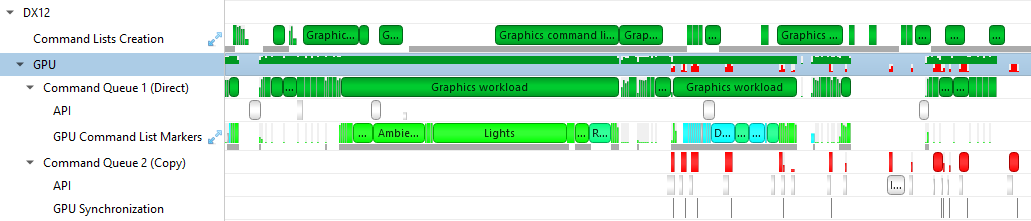
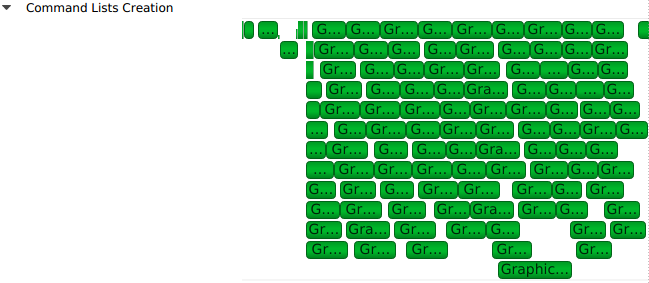
The Command List Creation row displays time periods when command lists were being created. This enables developers to improve their application’s multithreaded command list creation. Command list creation time period is measured between the call to ID3D12GraphicsCommandList::Reset and the call to ID3D12GraphicsCommandList::Close.
The GPU row shows an aggregated view of D3D12 API calls and GPU workloads. Note that not all D3D12 API calls are logged.

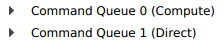
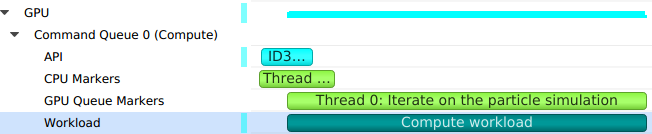
A Command Queue row is displayed for each D3D12 command queue created by the profiled application. The row’s header displays the queue's running index and its type (Direct, Compute, Copy).
The API row displays time periods where ID3D12CommandQueue::ExecuteCommandLists was called. The GPU Workload row displays time periods where workloads were executed by the GPU. The workload’s type (Graphics, Compute, Copy, etc.) is displayed on the bar representing the workload’s GPU execution.
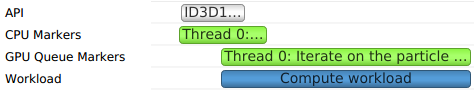
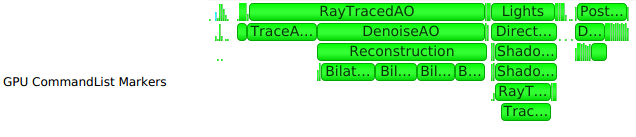
In addition, you can see the PIX command queue CPU-side performance markers, GPU-side performance markers and the GPU Command List performance markers, each in their row.


Clicking on a GPU workload highlights the corresponding ID3D12CommandQueue::ExecuteCommandLists, ID3D12GraphicsCommandList::Reset and ID3D12GraphicsCommandList::Close API calls, and vice versa.
-
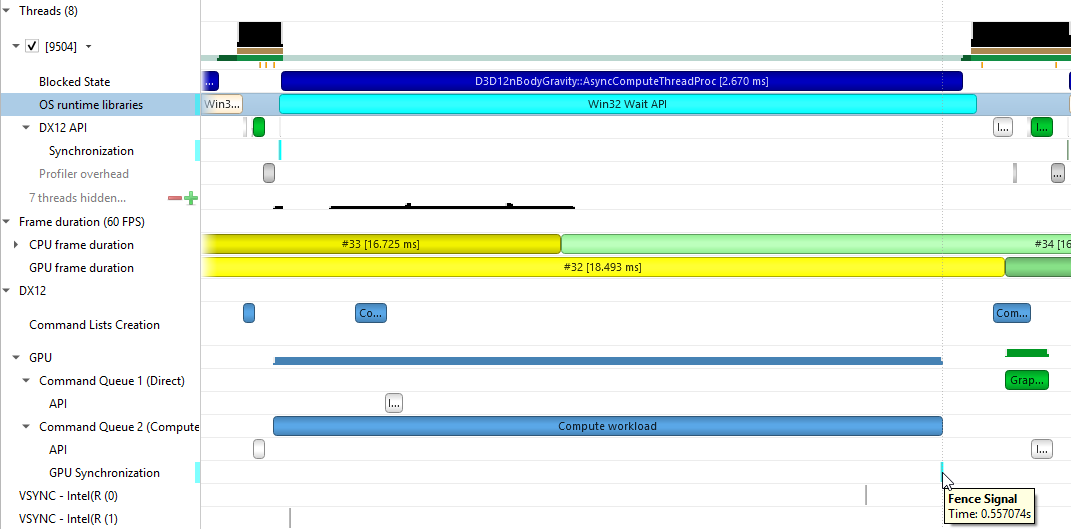
The CPU thread pushing a signal command and fence value into the command queue. This is displayed on the DX12 Synchronization sub-row of the calling thread.
-
The GPU executing that command, setting the fence value and signaling the fence. This is displayed on the GPU Queue Synchronization sub-row.
-
The CPU thread calling a Win32 wait API to block-wait until the fence is signaled. This is displayed on the Thread's OS runtime libraries row.
Clicking one of these will highlight it and the corresponding other two calls.
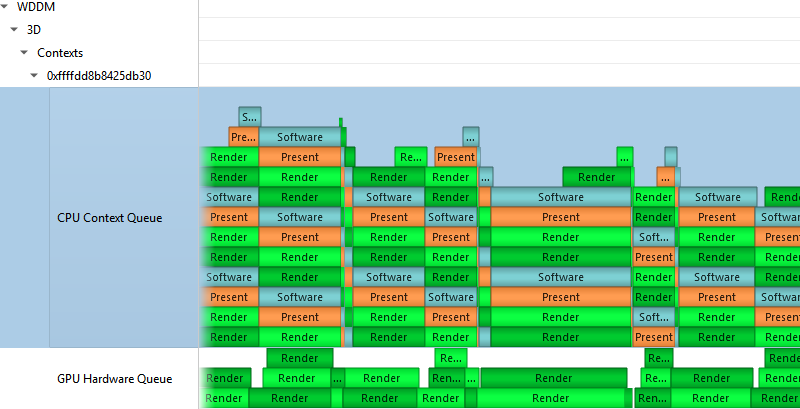
2. WDDM Queues
The Windows Display Driver Model (WDDM) architecture uses queues to send work packets from the CPU to the GPU. Each D3D device in each process is associated with one or more contexts. Graphics, compute, and copy commands that the profiled application uses are associated with a context, batched in a command buffer, and pushed into the relevant queue associated with that context.
Nsight Systems can capture the state of these queues during the trace session.
-
Render
-
Deferred
-
System
-
MMIOFlip
-
Wait
-
Signal
-
Device
-
Software
It may also be marked as a Present buffer, indicating that the application has finished rendering and requests to display the source surface.
See the Microsoft documentation for the WDDM architecture and the DXGKETW_QUEUE_PACKET_TYPE enumeration.
3. Vulkan API Trace
3.1. Vulkan Overview
Vulkan is a low-overhead, cross-platform 3D graphics and compute API, targeting a wide variety of devices from PCs to mobile phones and embedded platforms. The Vulkan API is defined by the Khronos Group. Information about Vulkan and the Khronos Group can be found at the Khronos Vulkan Site.
Nsight Systems can capture information about Vulkan usage by the profiled process. This includes capturing the execution time of Vulkan API functions, corresponding GPU workloads, debug util labels, and frame durations. Vulkan profiling is supported on both Windows and x86 Linux operating systems.
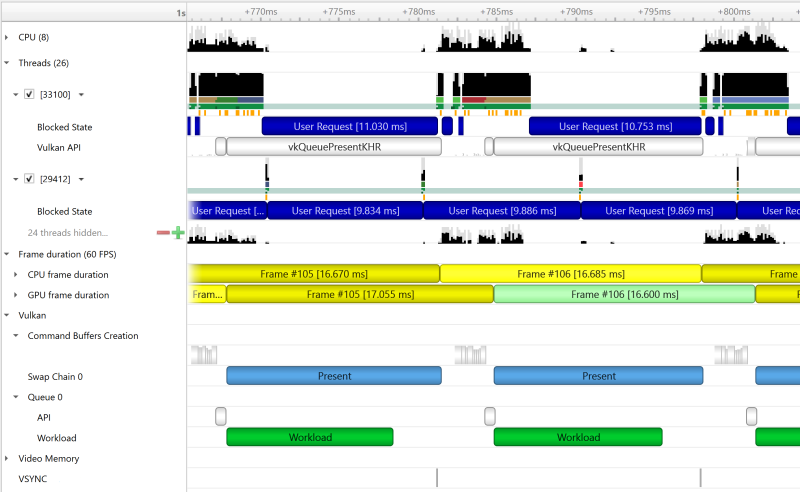
The Command Buffer Creation row displays time periods when command buffers were being created. This enables developers to improve their application’s multi-threaded command buffer creation. Command buffer creation time period is measured between the call to vkBeginCommandBuffer and the call to vkEndCommandBuffer.

The Swap chains row displays the available swap chains and the time periods where vkQueuePresentKHR was executed on each swap chain.

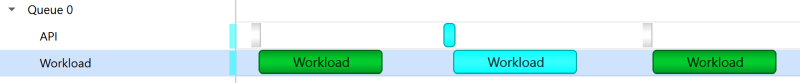
A Queue row is displayed for each Vulkan queue created by the profiled application. The API sub-row displays time periods where vkQueueSubmit was called. The GPU Workload sub-row displays time periods where workloads were executed by the GPU.

In addition, you can see Vulkan debug util labels on both the CPU and the GPU.
Clicking on a GPU workload highlights the corresponding vkQueueSubmit call, and vice versa.
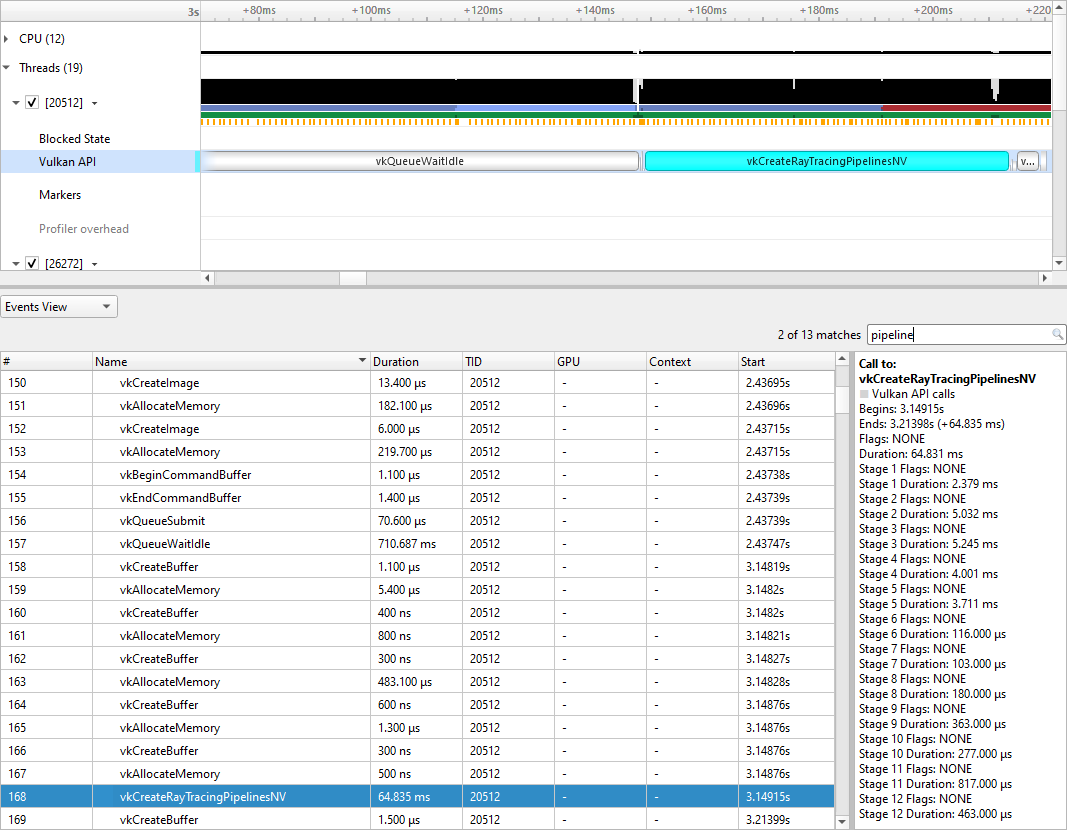
3.2. Pipeline Creation Feedback
When tracing target application calls to Vulkan pipeline creation APIs, Nsight Systems leverages the Pipeline Creation Feedback extension to collect more details about the duration of individual pipeline creation stages.
See Pipeline Creation Feedback extension for details about this extension.
Vulkan pipeline creation feedback is available on NVIDIA driver release 435 or later.
3.3. Vulkan GPU Trace Notes
-
Vulkan GPU trace is available only when tracing apps that use NVIDIA GPUs.
-
The endings of Vulkan Command Buffers execution ranges on Compute and Transfer queues may appear earlier on the timeline than their actual occurrence.
4. Stutter Analysis
4.1. FPS Overview
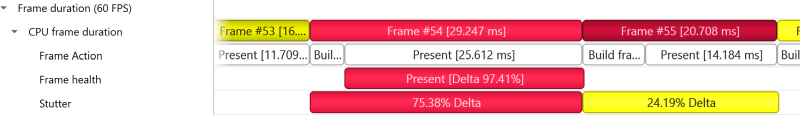
The Frame Duration section displays frame durations on both the CPU and the GPU.

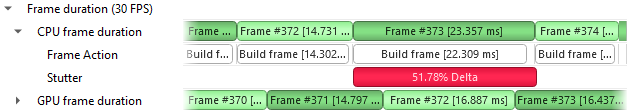
The stutter row highlights frames that are significantly longer than the other frames in their immediate vicinity.
The stutter row uses an algorithm that compares the duration of each frame to the median duration of the surrounding 19 frames. Duration difference under 4 milliseconds is never considered a stutter, to avoid cluttering the display with frames whose absolute stutter is small and not noticeable to the user.
-
Median duration is 10 ms. Frame with 13 ms time will not be reported (relative difference > 20%, absolute difference < 4 ms)
-
Median duration is 60 ms. Frame with 71 ms time will not be reported (relative difference < 20%, absolute difference > 4 ms)
-
Median duration is 60 ms. Frame with 80 ms is a stutter (relative difference > 20%, absolute difference > 4 ms, both conditions met)
OSC detection
The "19 frame window median" algorithm by itself may not work well with some cases of "oscillation" (consecutive fast and slow frames), resulting in some false positives. The median duration is not meaningful in cases of oscillation and can be misleading.
-
For every frame, calculate the median duration, 1st and 3rd quartiles of 19-frames window.
-
Calculate the delta and ratio between 1st and 3rd quartiles.
-
If the 90th percentile of 3rd – 1st quartile delta array > 4 ms AND the 90th percentile of 3rd/1st quartile array > 1.2 (120%) then mark the results with "OSC" text.
Right-clicking the Frame Duration row caption lets you choose the target frame rate (30, 60, 90 or custom frames per second).
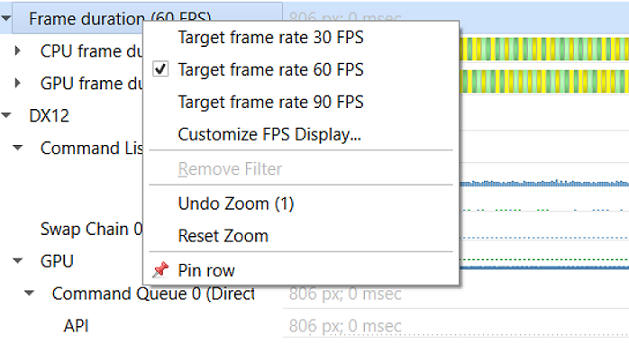
By clicking the Customize FPS Display option, a customization dialog pops up. In the dialog, you can now define the frame duration threshold to customize the view of the potentially problematic frames. In addition, you can define the threshold for the stutter analysis frames.
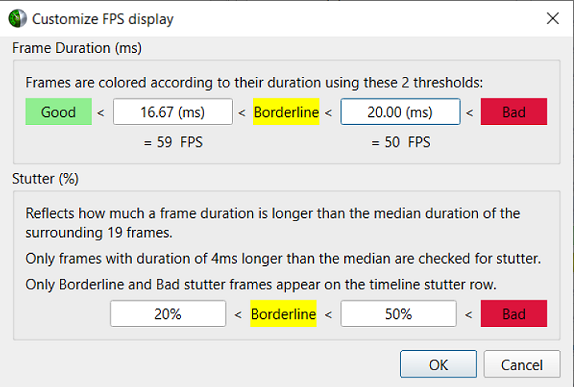
-
Green, the frame duration is shorter than required by the target FPS ratio.
-
Yellow, duration is slightly longer than required by the target FPS rate.
-
Red, duration far exceeds that required to maintain the target FPS rate.

-
The OpenGL frame boundaries are eglSwapBuffers/glXSwapBuffers/SwapBuffers calls.
-
The D3D11 and D3D12 frame boundaries are IDXGISwapChainX::Present calls.
-
The Vulkan frame boundaries are vkQueuePresentKHR calls.
-
The start time of the first GPU workload execution of this frame.
-
The start time of the first GPU workload execution of the next frame.
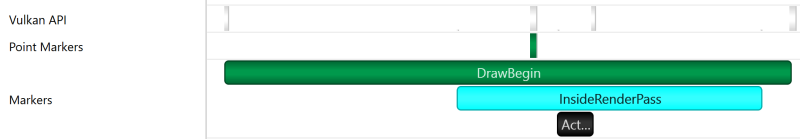
4.2. Frame Health
The Frame Health row displays actions that took significantly a longer time during the current frame, compared to the median time of the same actions executed during the surrounding 19-frames. This is a great tool for detecting the reason for frame time stuttering. Such actions may be: shader compilation, present, memory mapping, and more. Nsight Systems measures the accumulated time of such actions in each frame. For example: calculating the accumulated time of shader compilations in each frame and comparing it to the accumulated time of shader compilations in the surrounding 19 frames.
Example of a Vulkan frame health row:
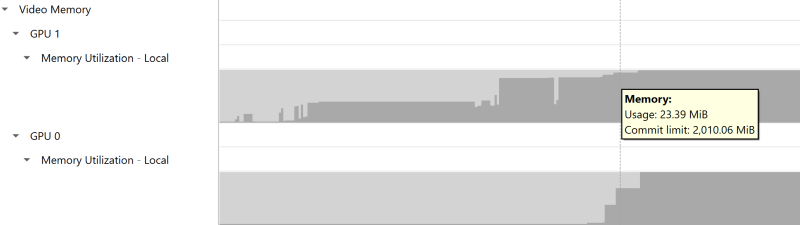
4.3. GPU Memory Utilization
The Memory Utilization row displays the amount of used local GPU memory and the commit limit for each GPU.
4.4. Vertical Synchronization
The VSYNC rows display when the monitor's vertical synchronizations occur.

5. MPI API Trace
For Linux x86_64 and Power targets, Nsight Systems is capable of capturing information about the MPI APIs executed in the profiled process. It has built-in API trace support only for the OpenMPI and MPICH implementations of MPI and only for a default list of synchronous APIs.
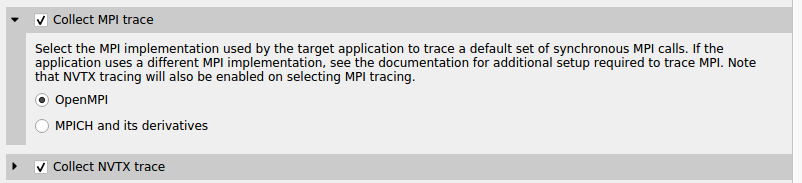
If you require more control over the list of traced APIs or if you are using a different MPI implementation, see github nvtx pmpi wrappers. You can use this documentation to generate a shared object to wrap a list of synchronous MPI APIs with NVTX using the MPI profiling interface (PMPI). If you set your LD_PRELOAD environment variable to the path of that object, Nsight Systems will capture and report the MPI API trace information when NVTX tracing is enabled.
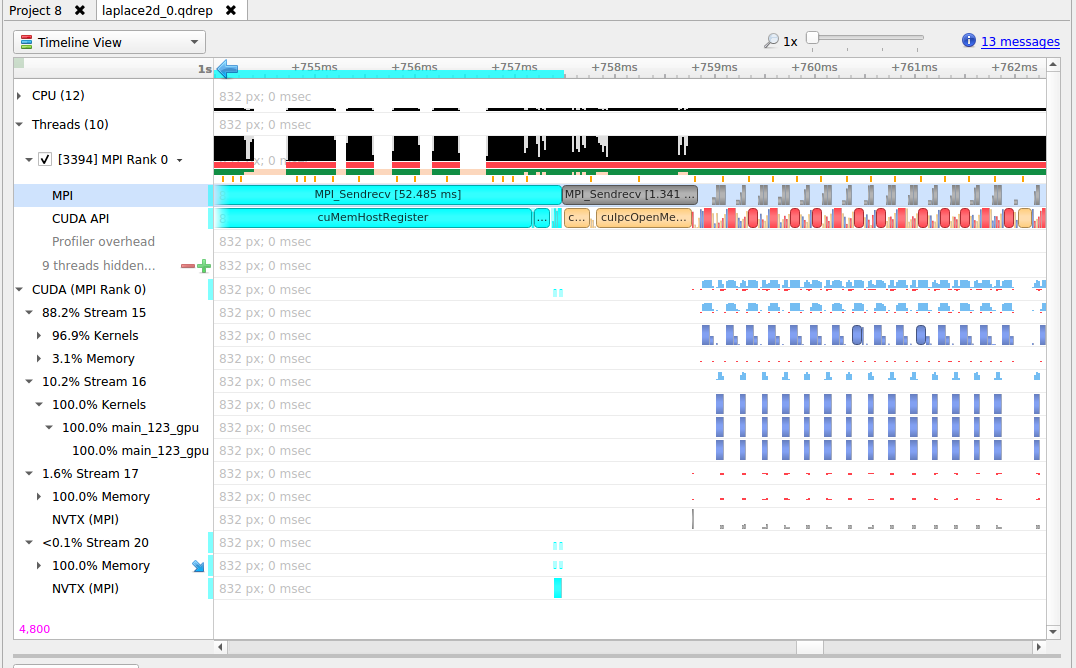
NVTX tracing is automatically enabled when MPI trace is turned on.
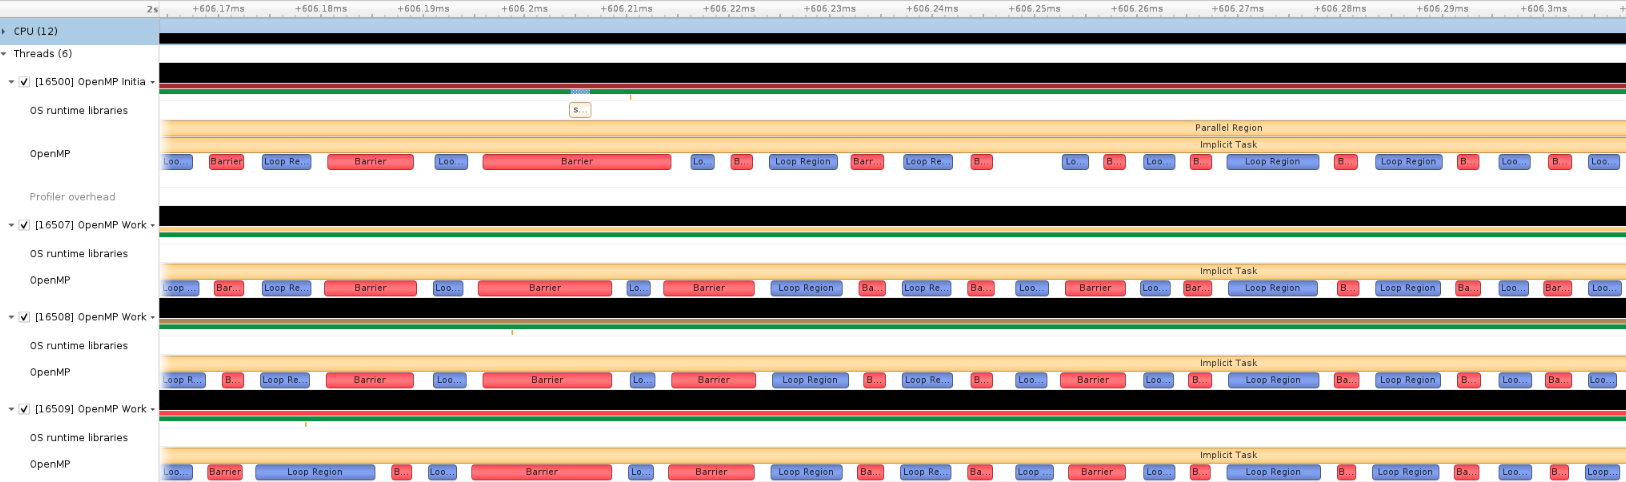
6. OpenMP Trace
Nsight Systems for Linux x86_64 and Power targets is capable of capturing information about OpenMP events. This functionality is built on the OpenMP Tools Interface (OMPT), full support is available only for OpenMP 5.0 or greater.
As an example, if you use PGI compiler 20.1 with LLVM OpenMP runtime to build your OpenMP applications, add -mp=libomp switch to enable OMPT based tracing.
Only a subset of OpenMP events are traced. These are limited to the following:
ompt_callback_parallel_begin
ompt_callback_parallel_end
ompt_callback_sync_region
ompt_callback_task_create
ompt_callback_task_schedule
ompt_callback_implicit_task
ompt_callback_master
ompt_callback_reduction
ompt_callback_task_create
ompt_callback_cancel
ompt_callback_mutex_acquire, ompt_callback_mutex_acquired
ompt_callback_mutex_acquired, ompt_callback_mutex_released
ompt_callback_mutex_released
ompt_callback_work
ompt_callback_dispatch
ompt_callback_flush
Note:
These raw OMPT events are processed and reorganized by Nsight Systems to be more user-friendly. You may not see exact same events from the list.
Example screenshot:
7. OS Runtime Libraries Trace
OS runtime libraries can be traced to gather information about low-level userspace APIs. This traces the system call wrappers and thread synchronization interfaces exposed by the C runtime and POSIX Threads (pthread) libraries. This does not perform a complete runtime library API trace, but instead focuses on the functions that can take a long time to execute, or could potentially cause your thread be unscheduled from the CPU while waiting for an event to complete.
-
Visualizing when the process is communicating with the hardware, controlling resources, performing multi-threading synchronization or interacting with the kernel scheduler.
-
Adding additional thread states by correlating how OS runtime libraries traces affect the thread scheduling:
-
Waiting — the thread is not scheduled on a CPU, it is inside of an OS runtime libraries trace and is believed to be waiting on the firmware to complete a request.
-
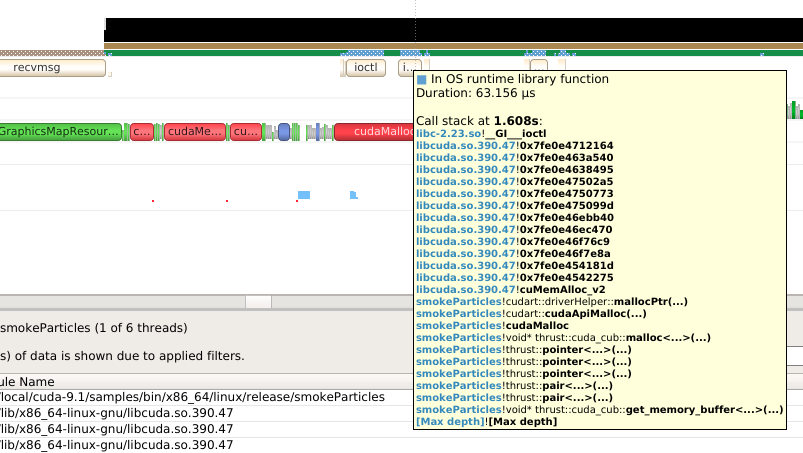
In OS runtime library function — the thread is scheduled on a CPU and inside of an OS runtime libraries trace. If the trace represents a system call, the process is likely running in kernel mode.
-
-
Collecting backtraces for long OS runtime libraries call. This provides a way to gather blocked-state backtraces, allowing you to gain more context about why the thread was blocked so long, yet avoiding unnecessary overhead for short events.
To enable OS runtime libraries tracing from Nsight Systems:
CLI — Use the -t, --trace option with the osrt parameter. See Command Line Options for more information.
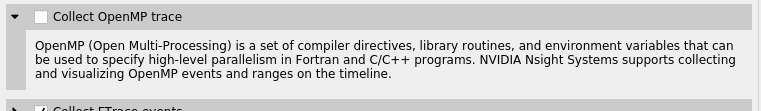
GUI — Select the Collect OS runtime libraries trace checkbox.
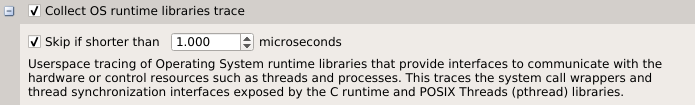
You can also use Skip if shorter than. This will skip calls shorter than the given threshold. Enabling this option will improve performances as well as reduce noise on thetimeline. We strongly encourage you to skip OS runtime libraries call shorter than 1 μs.
7.1. Locking a Resource
The functions listed below receive a special treatment. If the tool detects that the resource is already acquired by another thread and will induce a blocking call, we always trace it. Otherwise, it will never be traced.
pthread_mutex_lock
pthread_rwlock_rdlock
pthread_rwlock_wrlock
pthread_spin_lock
sem_wait
Note that even if a call is determined as potentially blocking, there is a chance that it may not actually block after a few cycles have elapsed. The call will still be traced in this scenario.
7.2. Limitations
-
Nsight Systems only traces syscall wrappers exposed by the C runtime. It is not able to trace syscall invoked through assembly code.
-
Additional thread states, as well as backtrace collection on long calls, are only enabled if sampling is turned on.
-
It is not possible to configure the depth and duration threshold when collecting backtraces. Currently, only OS runtime libraries calls longer than 80 μs will generate a backtrace with a maximum of 24 frames. This limitation will be removed in a future version of the product.
-
It is required to compile your application and libraries with the -funwind-tables compiler flag in order for Nsight Systems to unwind the backtraces correctly.
7.3. OS Runtime Libraries Trace Filters
The OS runtime libraries tracing is limited to a select list of functions. It also depends on the version of the C runtime linked to the application.
7.4. OS Runtime Default Function List
Libc system call wrappers
accept
accept4
acct
alarm
arch_prctl
bind
bpf
brk
chroot
clock_nanosleep
connect
copy_file_range
creat
creat64
dup
dup2
dup3
epoll_ctl
epoll_pwait
epoll_wait
fallocate
fallocate64
fcntl
fdatasync
flock
fork
fsync
ftruncate
futex
ioctl
ioperm
iopl
kill
killpg
listen
membarrier
mlock
mlock2
mlockall
mmap
mmap64
mount
move_pages
mprotect
mq_notify
mq_open
mq_receive
mq_send
mq_timedreceive
mq_timedsend
mremap
msgctl
msgget
msgrcv
msgsnd
msync
munmap
nanosleep
nfsservctl
open
open64
openat
openat64
pause
pipe
pipe2
pivot_root
poll
ppoll
prctl
pread
pread64
preadv
preadv2
preadv64
process_vm_readv
process_vm_writev
pselect6
ptrace
pwrite
pwrite64
pwritev
pwritev2
pwritev64
read
readv
reboot
recv
recvfrom
recvmmsg
recvmsg
rt_sigaction
rt_sigqueueinfo
rt_sigsuspend
rt_sigtimedwait
sched_yield
seccomp
select
semctl
semget
semop
semtimedop
send
sendfile
sendfile64
sendmmsg
sendmsg
sendto
shmat
shmctl
shmdt
shmget
shutdown
sigaction
sigsuspend
sigtimedwait
socket
socketpair
splice
swapoff
swapon
sync
sync_file_range
syncfs
tee
tgkill
tgsigqueueinfo
tkill
truncate
umount2
unshare
uselib
vfork
vhangup
vmsplice
wait
wait3
wait4
waitid
waitpid
write
writev
_sysctl
POSIX Threads
pthread_barrier_wait
pthread_cancel
pthread_cond_broadcast
pthread_cond_signal
pthread_cond_timedwait
pthread_cond_wait
pthread_create
pthread_join
pthread_kill
pthread_mutex_lock
pthread_mutex_timedlock
pthread_mutex_trylock
pthread_rwlock_rdlock
pthread_rwlock_timedrdlock
pthread_rwlock_timedwrlock
pthread_rwlock_tryrdlock
pthread_rwlock_trywrlock
pthread_rwlock_wrlock
pthread_spin_lock
pthread_spin_trylock
pthread_timedjoin_np
pthread_tryjoin_np
pthread_yield
sem_timedwait
sem_trywait
sem_wait
I/O
aio_fsync
aio_fsync64
aio_suspend
aio_suspend64
fclose
fcloseall
fflush
fflush_unlocked
fgetc
fgetc_unlocked
fgets
fgets_unlocked
fgetwc
fgetwc_unlocked
fgetws
fgetws_unlocked
flockfile
fopen
fopen64
fputc
fputc_unlocked
fputs
fputs_unlocked
fputwc
fputwc_unlocked
fputws
fputws_unlocked
fread
fread_unlocked
freopen
freopen64
ftrylockfile
fwrite
fwrite_unlocked
getc
getc_unlocked
getdelim
getline
getw
getwc
getwc_unlocked
lockf
lockf64
mkfifo
mkfifoat
posix_fallocate
posix_fallocate64
putc
putc_unlocked
putwc
putwc_unlocked
Miscellaneous
forkpty
popen
posix_spawn
posix_spawnp
sigwait
sigwaitinfo
sleep
system
usleep
8. NVTX Trace
The NVIDIA Tools Extension Library (NVTX) is a powerful mechanism that allows users to manually instrument their application. Nsight Systems can then collect the information and present it on the timeline.
Nsight Systems supports version 3.0 of the NVTX specification.
The following features are supported:
-
Domains
nvtxDomainCreate(), nvtxDomainDestroy()
nvtxDomainRegisterString()
-
Push-pop ranges (nested ranges that start and end in the same thread).
nvtxRangePush(), nvtxRangePushEx()
nvtxRangePop()
nvtxDomainRangePushEx()
nvtxDomainRangePop()
-
Start-end ranges (ranges that are global to the process and are not restricted to a single thread)
nvtxRangeStart(), nvtxRangeStartEx()
nvtxRangeEnd()
nvtxDomainRangeStartEx()
nvtxDomainRangeEnd()
-
Marks
nvtxMark(), nvtxMarkEx()
nvtxDomainMarkEx()
-
Thread names
nvtxNameOsThread()
-
Categories
nvtxNameCategory()
nvtxDomainNameCategory()
To learn more about specific features of NVTX, please refer to the NVTX header file: nvToolsExt.h or the NVTX documentation.
-
Add #include "nvtx3/nvToolsExt.h" in your source code. The nvtx3 directory is located in the Nsight Systems package in the Target-<architecture>/nvtx/include directory and is available via github at http://github.com/NVIDIA/NVTX.
-
Add the following compiler flag: -ldl
-
Add calls to the NVTX API functions. For example, try adding nvtxRangePush("main") in the beginning of the main() function, and nvtxRangePop() just before the return statement in the end.
For convenience in C++ code, consider adding a wrapper that implements RAII (resource acquisition is initialization) pattern, which would guarantee that every range gets closed.
-
In the project settings, select the Collect NVTX trace checkbox.
-
If you are on Android target, make sure that your application is launched by Nsight Systems. This is required so that the necessary launch environment is prepared, and the library responsible for collection of NVTX trace data is properly injected into the process.
-
If you are on Linux on Tegra, if launching the application manually, the following environment variables should be specified:
-
For ARMv7 processes:
NVTX_INJECTION32_PATH=/opt/nvidia/nsight_systems/libToolsInjection32.so
-
For ARMv8 processes:
NVTX_INJECTION64_PATH=/opt/nvidia/nsight_systems/libToolsInjection64.so
-
Typically calls to NVTX functions can be left in the source code even if the application is not being built for profiling purposes, since the overhead is very low when the profiler is not attached.
NVTX is not intended to annotate very small pieces of code that are being called very frequently. A good rule of thumb to use: if code being annotated usually takes less than 1 microsecond to execute, adding an NVTX range around this code should be done carefully.
Note:
Range annotations should be matched carefully. If many ranges are opened but not closed, Nsight Systems has no meaningful way to visualize it. A rule of thumb is to not have more than a couple dozen ranges open at any point in time. Nsight Systems does not support reports with many unclosed ranges.
9. CUDA Trace
Nsight Systems is capable of capturing information about CUDA execution in the profiled process.
-
CUDA API trace — trace of CUDA Runtime and CUDA Driver calls made by the application.
-
CUDA Runtime calls typically start with cuda prefix (e.g. cudaLaunch).
-
CUDA Driver calls typically start with cu prefix (e.g. cuDeviceGetCount).
-
-
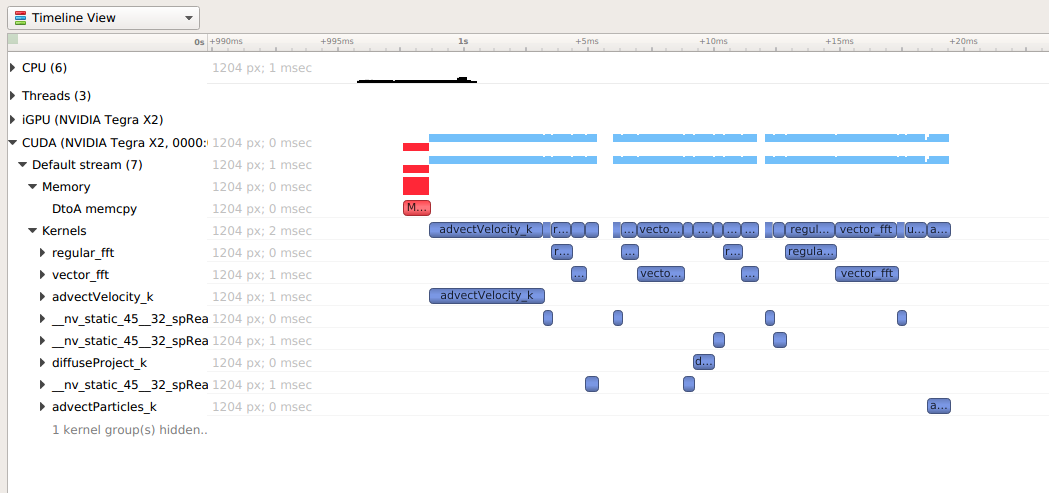
CUDA workload trace — trace of activity happening on the GPU, which includes memory operations (e.g., Host-to-Device memory copies) and kernel executions. Within the threads that use the CUDA API, additional child rows will appear in the timeline tree.
-
On Nsight Systems Workstation Edition, cuDNN and cuBLAS API tracing and OpenACC tracing.
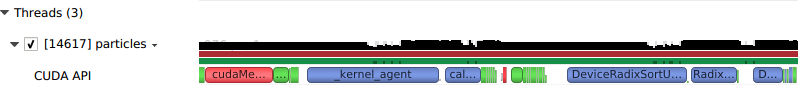
Near the bottom of the timeline row tree, the GPU node will appear and contain a CUDA node. Within the CUDA node, each CUDA context used within the process will be shown along with its corresponding CUDA streams. Steams will contain memory operations and kernel launches on the GPU. Kernel launches are represented by blue, while memory transfers are displayed in red.
The easiest way to capture CUDA information is to launch the process from Nsight Systems, and it will setup the environment for you. To do so, simply set up a normal launch and select the Collect CUDA trace checkbox.
For Nsight Systems Workstation Edition this looks like:
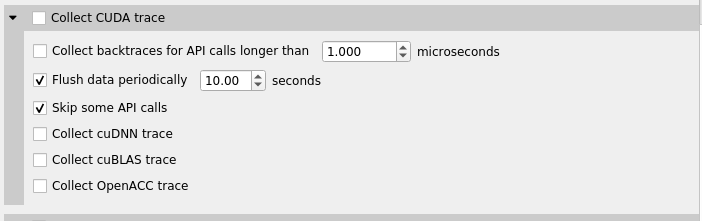
For Nsight Systems Embedded Platforms Edition this looks like:
Additional configuration parameters are available:
-
Collect backtraces for API calls longer than X seconds - turns on collection of CUDA API backtraces and sets the minimum time a CUDA API event must take before its backtraces are collected. Setting this value too low can cause high application overhead and seriously increase the size of your results file.
-
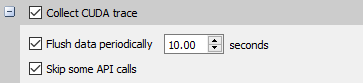
Flush data periodically — specifies the period after which an attempt to flush CUDA trace data will be made. Normally, in order to collect full CUDA trace, the application needs to finalize the device used for CUDA work (call cudaDeviceReset(), and then let the application gracefully exit (as opposed to crashing).
This option allows flushing CUDA trace data even before the device is finalized. However, it might introduce additional overhead to a random CUDA Driver or CUDA Runtime API call.
-
Skip some API calls — avoids tracing insignificant CUDA Runtime API calls (namely, cudaConfigureCall(), cudaSetupArgument(), cudaHostGetDevicePointers()). Not tracing these functions allows Nsight Systems to significantly reduce the profiling overhead, without losing any interesting data. (See CUDA Trace Filters, below)
-
For Nsight Systems Workstation Edition, Collect cuDNN trace, Collect cuBLAS trace, Collect OpenACC trace - selects which (if any) extra libraries that depend on CUDA to trace.
OpenACC versions 2.0, 2.5, and 2.6 are supported when using PGI runtime version 15.7 or greater and not compiling statically. In order to differentiate constructs, a PGI runtime of 16.1 or later is required. Note that Nsight Systems Workstation Edition does not support the GCC implementation of OpenACC at this time.
-
For Nsight Systems Embedded Platforms Edition if desired, the target application can be manually set up to collect CUDA trace. To capture information about CUDA execution, the following requirements should be satisfied:
-
The profiled process should be started with the specified environment variable, depending on the architecture of the process:
-
For ARMv7 (32-bit) processes: CUDA_INJECTION32_PATH, which should point to the injection library:
/opt/nvidia/nsight_systems/libToolsInjection32.so
-
For ARMv8 (64-bit) processes: CUDA_INJECTION64_PATH, which should point to the injection library:
/opt/nvidia/nsight_systems/libToolsInjection64.so
-
-
If the application is started by Nsight Systems, all required environment variables will be set automatically.
-
Please note that if your application crashes before all collected CUDA trace data has been copied out, some or all data might be lost and not present in the report.
9.1. Unified Memory Transfer Trace
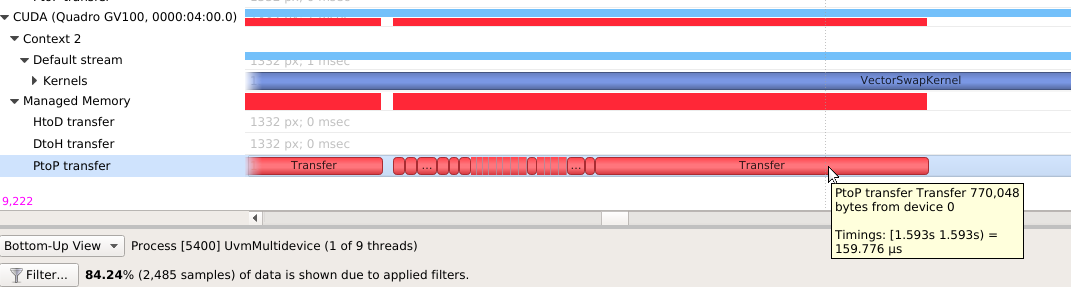
For Nsight Systems Workstation Edition, Unified Memory (also called Managed Memory) transfer trace is enabled automatically in Nsight Systems when CUDA trace is selected. It incurs no overhead in programs that do not perform any Unified Memory transfers. Data is displayed in the Managed Memory area of the timeline:
HtoD transfer indicates the CUDA kernel accessed managed memory that was residing on the host, so the kernel execution paused and transferred the data to the device. Heavy traffic here will incur performance penalties in CUDA kernels, so consider using manual cudaMemcpy operations from pinned host memory instead.
PtoP transfer indicates the CUDA kernel accessed managed memory that was residing on a different device, so the kernel execution paused and transferred the data to this device. Heavy traffic here will incur performance penalties, so consider using manual cudaMemcpyPeer operations to transfer from other devices' memory instead. The row showing these events is for the destination device -- the source device is shown in the tooltip for each transfer event.
DtoH transfer indicates the CPU accessed managed memory that was residing on a CUDA device, so the CPU execution paused and transferred the data to system memory. Heavy traffic here will incur performance penalties in CPU code, so consider using manual cudaMemcpy operations from pinned host memory instead.
9.2. CUDA Default Function List for CLI
CUDA Runtime API
cudaBindSurfaceToArray
cudaBindTexture
cudaBindTexture2D
cudaBindTextureToArray
cudaBindTextureToMipmappedArray
cudaConfigureCall
cudaCreateSurfaceObject
cudaCreateTextureObject
cudaD3D10MapResources
cudaD3D10RegisterResource
cudaD3D10UnmapResources
cudaD3D10UnregisterResource
cudaD3D9MapResources
cudaD3D9MapVertexBuffer
cudaD3D9RegisterResource
cudaD3D9RegisterVertexBuffer
cudaD3D9UnmapResources
cudaD3D9UnmapVertexBuffer
cudaD3D9UnregisterResource
cudaD3D9UnregisterVertexBuffer
cudaDestroySurfaceObject
cudaDestroyTextureObject
cudaDeviceReset
cudaDeviceSynchronize
cudaEGLStreamConsumerAcquireFrame
cudaEGLStreamConsumerConnect
cudaEGLStreamConsumerConnectWithFlags
cudaEGLStreamConsumerDisconnect
cudaEGLStreamConsumerReleaseFrame
cudaEGLStreamConsumerReleaseFrame
cudaEGLStreamProducerConnect
cudaEGLStreamProducerDisconnect
cudaEGLStreamProducerReturnFrame
cudaEventCreate
cudaEventCreateFromEGLSync
cudaEventCreateWithFlags
cudaEventDestroy
cudaEventQuery
cudaEventRecord
cudaEventRecord_ptsz
cudaEventSynchronize
cudaFree
cudaFreeArray
cudaFreeHost
cudaFreeMipmappedArray
cudaGLMapBufferObject
cudaGLMapBufferObjectAsync
cudaGLRegisterBufferObject
cudaGLUnmapBufferObject
cudaGLUnmapBufferObjectAsync
cudaGLUnregisterBufferObject
cudaGraphicsD3D10RegisterResource
cudaGraphicsD3D11RegisterResource
cudaGraphicsD3D9RegisterResource
cudaGraphicsEGLRegisterImage
cudaGraphicsGLRegisterBuffer
cudaGraphicsGLRegisterImage
cudaGraphicsMapResources
cudaGraphicsUnmapResources
cudaGraphicsUnregisterResource
cudaGraphicsVDPAURegisterOutputSurface
cudaGraphicsVDPAURegisterVideoSurface
cudaHostAlloc
cudaHostRegister
cudaHostUnregister
cudaLaunch
cudaLaunchCooperativeKernel
cudaLaunchCooperativeKernelMultiDevice
cudaLaunchCooperativeKernel_ptsz
cudaLaunchKernel
cudaLaunchKernel_ptsz
cudaLaunch_ptsz
cudaMalloc
cudaMalloc3D
cudaMalloc3DArray
cudaMallocArray
cudaMallocHost
cudaMallocManaged
cudaMallocMipmappedArray
cudaMallocPitch
cudaMemGetInfo
cudaMemPrefetchAsync
cudaMemPrefetchAsync_ptsz
cudaMemcpy
cudaMemcpy2D
cudaMemcpy2DArrayToArray
cudaMemcpy2DArrayToArray_ptds
cudaMemcpy2DAsync
cudaMemcpy2DAsync_ptsz
cudaMemcpy2DFromArray
cudaMemcpy2DFromArrayAsync
cudaMemcpy2DFromArrayAsync_ptsz
cudaMemcpy2DFromArray_ptds
cudaMemcpy2DToArray
cudaMemcpy2DToArrayAsync
cudaMemcpy2DToArrayAsync_ptsz
cudaMemcpy2DToArray_ptds
cudaMemcpy2D_ptds
cudaMemcpy3D
cudaMemcpy3DAsync
cudaMemcpy3DAsync_ptsz
cudaMemcpy3DPeer
cudaMemcpy3DPeerAsync
cudaMemcpy3DPeerAsync_ptsz
cudaMemcpy3DPeer_ptds
cudaMemcpy3D_ptds
cudaMemcpyArrayToArray
cudaMemcpyArrayToArray_ptds
cudaMemcpyAsync
cudaMemcpyAsync_ptsz
cudaMemcpyFromArray
cudaMemcpyFromArrayAsync
cudaMemcpyFromArrayAsync_ptsz
cudaMemcpyFromArray_ptds
cudaMemcpyFromSymbol
cudaMemcpyFromSymbolAsync
cudaMemcpyFromSymbolAsync_ptsz
cudaMemcpyFromSymbol_ptds
cudaMemcpyPeer
cudaMemcpyPeerAsync
cudaMemcpyToArray
cudaMemcpyToArrayAsync
cudaMemcpyToArrayAsync_ptsz
cudaMemcpyToArray_ptds
cudaMemcpyToSymbol
cudaMemcpyToSymbolAsync
cudaMemcpyToSymbolAsync_ptsz
cudaMemcpyToSymbol_ptds
cudaMemcpy_ptds
cudaMemset
cudaMemset2D
cudaMemset2DAsync
cudaMemset2DAsync_ptsz
cudaMemset2D_ptds
cudaMemset3D
cudaMemset3DAsync
cudaMemset3DAsync_ptsz
cudaMemset3D_ptds
cudaMemsetAsync
cudaMemsetAsync_ptsz
cudaMemset_ptds
cudaPeerRegister
cudaPeerUnregister
cudaStreamAddCallback
cudaStreamAddCallback_ptsz
cudaStreamAttachMemAsync
cudaStreamAttachMemAsync_ptsz
cudaStreamCreate
cudaStreamCreateWithFlags
cudaStreamCreateWithPriority
cudaStreamDestroy
cudaStreamQuery
cudaStreamQuery_ptsz
cudaStreamSynchronize
cudaStreamSynchronize_ptsz
cudaStreamWaitEvent
cudaStreamWaitEvent_ptsz
cudaThreadSynchronize
cudaUnbindTexture
CUDA Master API
cu64Array3DCreate
cu64ArrayCreate
cu64D3D9MapVertexBuffer
cu64GLMapBufferObject
cu64GLMapBufferObjectAsync
cu64MemAlloc
cu64MemAllocPitch
cu64MemFree
cu64MemGetInfo
cu64MemHostAlloc
cu64Memcpy2D
cu64Memcpy2DAsync
cu64Memcpy2DUnaligned
cu64Memcpy3D
cu64Memcpy3DAsync
cu64MemcpyAtoD
cu64MemcpyDtoA
cu64MemcpyDtoD
cu64MemcpyDtoDAsync
cu64MemcpyDtoH
cu64MemcpyDtoHAsync
cu64MemcpyHtoD
cu64MemcpyHtoDAsync
cu64MemsetD16
cu64MemsetD16Async
cu64MemsetD2D16
cu64MemsetD2D16Async
cu64MemsetD2D32
cu64MemsetD2D32Async
cu64MemsetD2D8
cu64MemsetD2D8Async
cu64MemsetD32
cu64MemsetD32Async
cu64MemsetD8
cu64MemsetD8Async
cuArray3DCreate
cuArray3DCreate_v2
cuArrayCreate
cuArrayCreate_v2
cuArrayDestroy
cuBinaryFree
cuCompilePtx
cuCtxCreate
cuCtxCreate_v2
cuCtxDestroy
cuCtxDestroy_v2
cuCtxSynchronize
cuD3D10CtxCreate
cuD3D10CtxCreateOnDevice
cuD3D10CtxCreate_v2
cuD3D10MapResources
cuD3D10RegisterResource
cuD3D10UnmapResources
cuD3D10UnregisterResource
cuD3D11CtxCreate
cuD3D11CtxCreateOnDevice
cuD3D11CtxCreate_v2
cuD3D9CtxCreate
cuD3D9CtxCreateOnDevice
cuD3D9CtxCreate_v2
cuD3D9MapResources
cuD3D9MapVertexBuffer
cuD3D9MapVertexBuffer_v2
cuD3D9RegisterResource
cuD3D9RegisterVertexBuffer
cuD3D9UnmapResources
cuD3D9UnmapVertexBuffer
cuD3D9UnregisterResource
cuD3D9UnregisterVertexBuffer
cuEGLStreamConsumerAcquireFrame
cuEGLStreamConsumerConnect
cuEGLStreamConsumerConnectWithFlags
cuEGLStreamConsumerDisconnect
cuEGLStreamConsumerReleaseFrame
cuEGLStreamProducerConnect
cuEGLStreamProducerDisconnect
cuEGLStreamProducerPresentFrame
cuEGLStreamProducerReturnFrame
cuEventCreate
cuEventCreateFromEGLSync
cuEventCreateFromNVNSync
cuEventDestroy
cuEventDestroy_v2
cuEventQuery
cuEventRecord
cuEventRecord_ptsz
cuEventSynchronize
cuGLCtxCreate
cuGLCtxCreate_v2
cuGLInit
cuGLMapBufferObject
cuGLMapBufferObjectAsync
cuGLMapBufferObjectAsync_v2
cuGLMapBufferObjectAsync_v2_ptsz
cuGLMapBufferObject_v2
cuGLMapBufferObject_v2_ptds
cuGLRegisterBufferObject
cuGLUnmapBufferObject
cuGLUnmapBufferObjectAsync
cuGLUnregisterBufferObject
cuGraphicsD3D10RegisterResource
cuGraphicsD3D11RegisterResource
cuGraphicsD3D9RegisterResource
cuGraphicsEGLRegisterImage
cuGraphicsGLRegisterBuffer
cuGraphicsGLRegisterImage
cuGraphicsMapResources
cuGraphicsMapResources_ptsz
cuGraphicsUnmapResources
cuGraphicsUnmapResources_ptsz
cuGraphicsUnregisterResource
cuGraphicsVDPAURegisterOutputSurface
cuGraphicsVDPAURegisterVideoSurface
cuInit
cuLaunch
cuLaunchCooperativeKernel
cuLaunchCooperativeKernelMultiDevice
cuLaunchCooperativeKernel_ptsz
cuLaunchGrid
cuLaunchGridAsync
cuLaunchKernel
cuLaunchKernel_ptsz
cuLinkComplete
cuLinkCreate
cuLinkCreate_v2
cuLinkDestroy
cuMemAlloc
cuMemAllocHost
cuMemAllocHost_v2
cuMemAllocManaged
cuMemAllocPitch
cuMemAllocPitch_v2
cuMemAlloc_v2
cuMemFree
cuMemFreeHost
cuMemFree_v2
cuMemGetInfo
cuMemGetInfo_v2
cuMemHostAlloc
cuMemHostAlloc_v2
cuMemHostRegister
cuMemHostRegister_v2
cuMemHostUnregister
cuMemPeerRegister
cuMemPeerUnregister
cuMemPrefetchAsync
cuMemPrefetchAsync_ptsz
cuMemcpy
cuMemcpy2D
cuMemcpy2DAsync
cuMemcpy2DAsync_v2
cuMemcpy2DAsync_v2_ptsz
cuMemcpy2DUnaligned
cuMemcpy2DUnaligned_v2
cuMemcpy2DUnaligned_v2_ptds
cuMemcpy2D_v2
cuMemcpy2D_v2_ptds
cuMemcpy3D
cuMemcpy3DAsync
cuMemcpy3DAsync_v2
cuMemcpy3DAsync_v2_ptsz
cuMemcpy3DPeer
cuMemcpy3DPeerAsync
cuMemcpy3DPeerAsync_ptsz
cuMemcpy3DPeer_ptds
cuMemcpy3D_v2
cuMemcpy3D_v2_ptds
cuMemcpyAsync
cuMemcpyAsync_ptsz
cuMemcpyAtoA
cuMemcpyAtoA_v2
cuMemcpyAtoA_v2_ptds
cuMemcpyAtoD
cuMemcpyAtoD_v2
cuMemcpyAtoD_v2_ptds
cuMemcpyAtoH
cuMemcpyAtoHAsync
cuMemcpyAtoHAsync_v2
cuMemcpyAtoHAsync_v2_ptsz
cuMemcpyAtoH_v2
cuMemcpyAtoH_v2_ptds
cuMemcpyDtoA
cuMemcpyDtoA_v2
cuMemcpyDtoA_v2_ptds
cuMemcpyDtoD
cuMemcpyDtoDAsync
cuMemcpyDtoDAsync_v2
cuMemcpyDtoDAsync_v2_ptsz
cuMemcpyDtoD_v2
cuMemcpyDtoD_v2_ptds
cuMemcpyDtoH
cuMemcpyDtoHAsync
cuMemcpyDtoHAsync_v2
cuMemcpyDtoHAsync_v2_ptsz
cuMemcpyDtoH_v2
cuMemcpyDtoH_v2_ptds
cuMemcpyHtoA
cuMemcpyHtoAAsync
cuMemcpyHtoAAsync_v2
cuMemcpyHtoAAsync_v2_ptsz
cuMemcpyHtoA_v2
cuMemcpyHtoA_v2_ptds
cuMemcpyHtoD
cuMemcpyHtoDAsync
cuMemcpyHtoDAsync_v2
cuMemcpyHtoDAsync_v2_ptsz
cuMemcpyHtoD_v2
cuMemcpyHtoD_v2_ptds
cuMemcpyPeer
cuMemcpyPeerAsync
cuMemcpyPeerAsync_ptsz
cuMemcpyPeer_ptds
cuMemcpy_ptds
cuMemcpy_v2
cuMemsetD16
cuMemsetD16Async
cuMemsetD16Async_ptsz
cuMemsetD16_v2
cuMemsetD16_v2_ptds
cuMemsetD2D16
cuMemsetD2D16Async
cuMemsetD2D16Async_ptsz
cuMemsetD2D16_v2
cuMemsetD2D16_v2_ptds
cuMemsetD2D32
cuMemsetD2D32Async
cuMemsetD2D32Async_ptsz
cuMemsetD2D32_v2
cuMemsetD2D32_v2_ptds
cuMemsetD2D8
cuMemsetD2D8Async
cuMemsetD2D8Async_ptsz
cuMemsetD2D8_v2
cuMemsetD2D8_v2_ptds
cuMemsetD32
cuMemsetD32Async
cuMemsetD32Async_ptsz
cuMemsetD32_v2
cuMemsetD32_v2_ptds
cuMemsetD8
cuMemsetD8Async
cuMemsetD8Async_ptsz
cuMemsetD8_v2
cuMemsetD8_v2_ptds
cuMipmappedArrayCreate
cuMipmappedArrayDestroy
cuModuleLoad
cuModuleLoadData
cuModuleLoadDataEx
cuModuleLoadFatBinary
cuModuleUnload
cuStreamAddCallback
cuStreamAddCallback_ptsz
cuStreamAttachMemAsync
cuStreamAttachMemAsync_ptsz
cuStreamBatchMemOp
cuStreamBatchMemOp_ptsz
cuStreamCreate
cuStreamCreateWithPriority
cuStreamDestroy
cuStreamDestroy_v2
cuStreamSynchronize
cuStreamSynchronize_ptsz
cuStreamWaitEvent
cuStreamWaitEvent_ptsz
cuStreamWaitValue32
cuStreamWaitValue32_ptsz
cuStreamWaitValue64
cuStreamWaitValue64_ptsz
cuStreamWriteValue32
cuStreamWriteValue32_ptsz
cuStreamWriteValue64
cuStreamWriteValue64_ptsz
cuSurfObjectCreate
cuSurfObjectDestroy
cuSurfRefCreate
cuSurfRefDestroy
cuTexObjectCreate
cuTexObjectDestroy
cuTexRefCreate
cuTexRefDestroy
cuVDPAUCtxCreate
cuVDPAUCtxCreate_v2
9.3. cuDNN Function List for X86 CLI
cuDNN API functions
cudnnActivationBackward
cudnnActivationBackward_v3
cudnnActivationBackward_v4
cudnnActivationForward
cudnnActivationForward_v3
cudnnActivationForward_v4
cudnnAddTensor
cudnnBatchNormalizationBackward
cudnnBatchNormalizationBackwardEx
cudnnBatchNormalizationForwardInference
cudnnBatchNormalizationForwardTraining
cudnnBatchNormalizationForwardTrainingEx
cudnnCTCLoss
cudnnConvolutionBackwardBias
cudnnConvolutionBackwardData
cudnnConvolutionBackwardFilter
cudnnConvolutionBiasActivationForward
cudnnConvolutionForward
cudnnCreate
cudnnCreateAlgorithmPerformance
cudnnDestroy
cudnnDestroyAlgorithmPerformance
cudnnDestroyPersistentRNNPlan
cudnnDivisiveNormalizationBackward
cudnnDivisiveNormalizationForward
cudnnDropoutBackward
cudnnDropoutForward
cudnnDropoutGetReserveSpaceSize
cudnnDropoutGetStatesSize
cudnnFindConvolutionBackwardDataAlgorithm
cudnnFindConvolutionBackwardDataAlgorithmEx
cudnnFindConvolutionBackwardFilterAlgorithm
cudnnFindConvolutionBackwardFilterAlgorithmEx
cudnnFindConvolutionForwardAlgorithm
cudnnFindConvolutionForwardAlgorithmEx
cudnnFindRNNBackwardDataAlgorithmEx
cudnnFindRNNBackwardWeightsAlgorithmEx
cudnnFindRNNForwardInferenceAlgorithmEx
cudnnFindRNNForwardTrainingAlgorithmEx
cudnnFusedOpsExecute
cudnnIm2Col
cudnnLRNCrossChannelBackward
cudnnLRNCrossChannelForward
cudnnMakeFusedOpsPlan
cudnnMultiHeadAttnBackwardData
cudnnMultiHeadAttnBackwardWeights
cudnnMultiHeadAttnForward
cudnnOpTensor
cudnnPoolingBackward
cudnnPoolingForward
cudnnRNNBackwardData
cudnnRNNBackwardDataEx
cudnnRNNBackwardWeights
cudnnRNNBackwardWeightsEx
cudnnRNNForwardInference
cudnnRNNForwardInferenceEx
cudnnRNNForwardTraining
cudnnRNNForwardTrainingEx
cudnnReduceTensor
cudnnReorderFilterAndBias
cudnnRestoreAlgorithm
cudnnRestoreDropoutDescriptor
cudnnSaveAlgorithm
cudnnScaleTensor
cudnnSoftmaxBackward
cudnnSoftmaxForward
cudnnSpatialTfGridGeneratorBackward
cudnnSpatialTfGridGeneratorForward
cudnnSpatialTfSamplerBackward
cudnnSpatialTfSamplerForward
cudnnTransformFilter
cudnnTransformTensor
cudnnTransformTensorEx
10. OpenACC Trace
Nsight Systems for Linux x86_64 and Power targets is capable of capturing information about OpenACC execution in the profiled process.
OpenACC versions 2.0, 2.5, and 2.6 are supported when using PGI runtime version 15.7 or later. In order to differentiate constructs (see tooltip below), a PGI runtime of 16.0 or later is required. Note that Nsight Systems does not support the GCC implementation of OpenACC at this time.
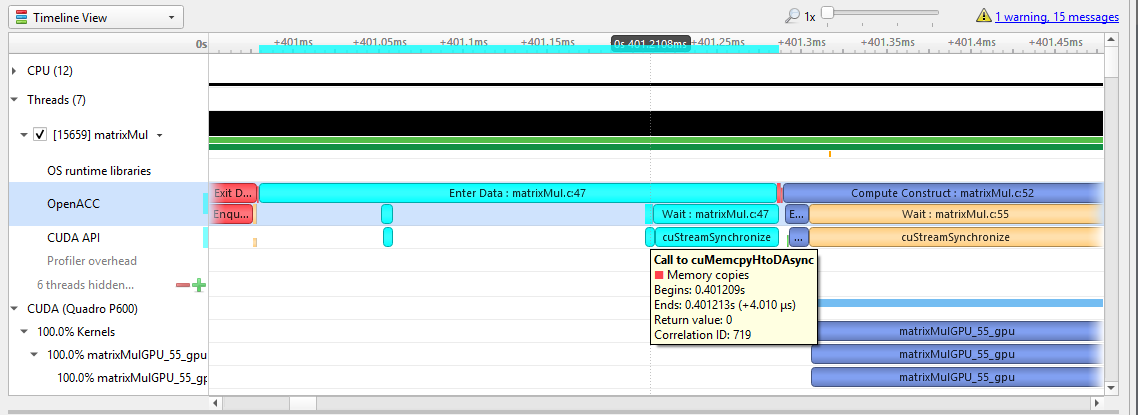
Under the CPU rows in the timeline tree, each thread that uses OpenACC will show OpenACC trace information. You can click on a OpenACC API call to see correlation with the underlying CUDA API calls (highlighted in teal):
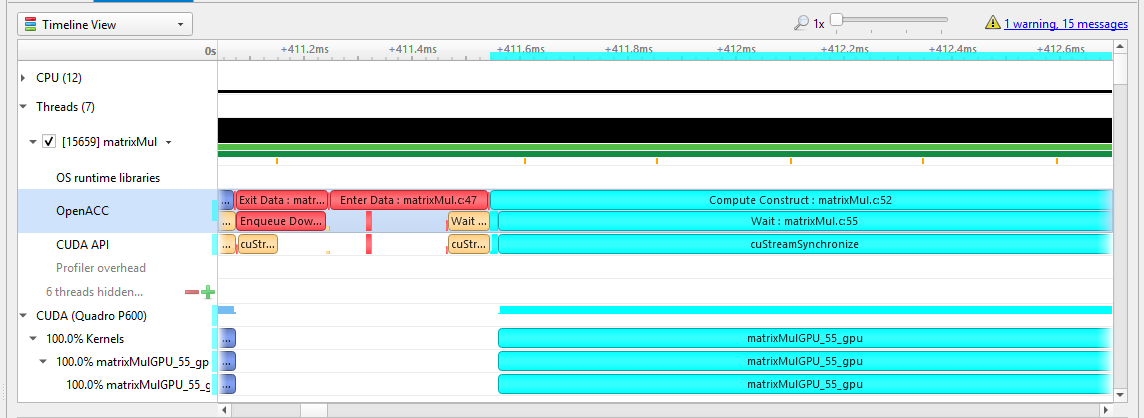
If the OpenACC API results in GPU work, that will also be highlighted:
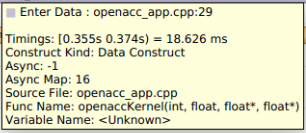
Hovering over a particular OpenACC construct will bring up a tooltip with details about that construct:
To capture OpenACC information from the Nsight Systems GUI, select the Collect OpenACC trace checkbox under Collect CUDA trace configurations. Note that turning on OpenACC tracing will also turn on CUDA tracing.
Please note that if your application crashes before all collected OpenACC trace data has been copied out, some or all data might be lost and not present in the report.
11. OpenGL Trace
OpenGL and OpenGL ES APIs can be traced to assist in the analysis of CPU and GPU interactions.
A few usage examples are:
-
Visualize how long eglSwapBuffers (or similar) is taking.
-
API trace can easily show correlations between thread state and graphics driver's behavior, uncovering where the CPU may be waiting on the GPU.
-
Spot bubbles of opportunity on the GPU, where more GPU workload could be created.
-
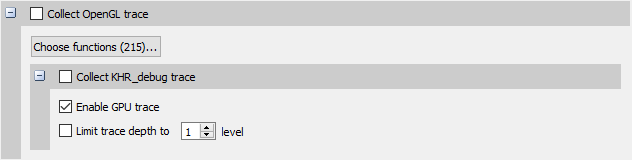
Use KHR_debug extension to trace GL events on both the CPU and GPU.
OpenGL trace feature in Nsight Systems consists of two different activities which will be shown in the CPU rows for those threads
-
CPU trace: interception of API calls that an application does to APIs (such as OpenGL, OpenGL ES, EGL, GLX, WGL, etc.).
-
GPU trace (or workload trace): trace of GPU workload (activity) triggered by use of OpenGL or OpenGL ES. Since draw calls are executed back-to-back, the GPU workload trace ranges include many OpenGL draw calls and operations in order to optimize performance overhead, rather than tracing each individual operation.
To collect GPU trace, the glQueryCounter() function is used to measure how much time batches of GPU workload take to complete.
Ranges defined by the KHR_debug calls are represented similarly to OpenGL API and OpenGL GPU workload trace. GPU ranges in this case represent incremental draw cost. They cannot fully account for GPUs that can execute multiple draw calls in parallel. In this case, Nsight Systems will not show overlapping GPU ranges.
11.1. OpenGL Trace Using Command Line
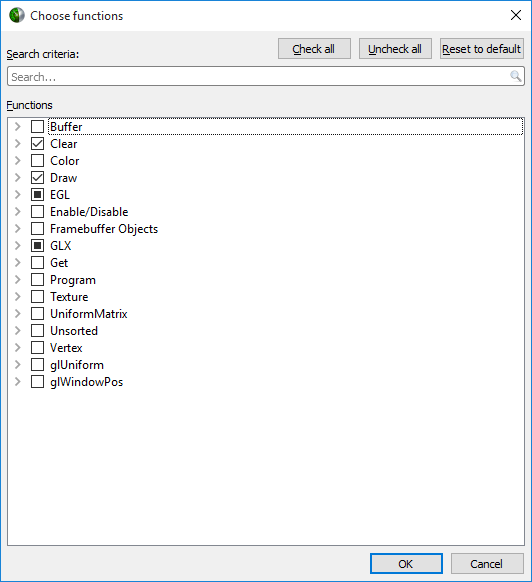
For general information on using the target CLI, see CLI Profiling on Linux. For the CLI, the functions that are traced are set to the following list:
glWaitSync
glReadPixels
glReadnPixelsKHR
glReadnPixelsEXT
glReadnPixelsARB
glReadnPixels
glFlush
glFinishFenceNV
glFinish
glClientWaitSync
glClearTexSubImage
glClearTexImage
glClearStencil
glClearNamedFramebufferuiv
glClearNamedFramebufferiv
glClearNamedFramebufferfv
glClearNamedFramebufferfi
glClearNamedBufferSubDataEXT
glClearNamedBufferSubData
glClearNamedBufferDataEXT
glClearNamedBufferData
glClearIndex
glClearDepthx
glClearDepthf
glClearDepthdNV
glClearDepth
glClearColorx
glClearColorIuiEXT
glClearColorIiEXT
glClearColor
glClearBufferuiv
glClearBufferSubData
glClearBufferiv
glClearBufferfv
glClearBufferfi
glClearBufferData
glClearAccum
glClear
glDispatchComputeIndirect
glDispatchComputeGroupSizeARB
glDispatchCompute
glComputeStreamNV
glNamedFramebufferDrawBuffers
glNamedFramebufferDrawBuffer
glMultiDrawElementsIndirectEXT
glMultiDrawElementsIndirectCountARB
glMultiDrawElementsIndirectBindlessNV
glMultiDrawElementsIndirectBindlessCountNV
glMultiDrawElementsIndirectAMD
glMultiDrawElementsIndirect
glMultiDrawElementsEXT
glMultiDrawElementsBaseVertex
glMultiDrawElements
glMultiDrawArraysIndirectEXT
glMultiDrawArraysIndirectCountARB
glMultiDrawArraysIndirectBindlessNV
glMultiDrawArraysIndirectBindlessCountNV
glMultiDrawArraysIndirectAMD
glMultiDrawArraysIndirect
glMultiDrawArraysEXT
glMultiDrawArrays
glListDrawCommandsStatesClientNV
glFramebufferDrawBuffersEXT
glFramebufferDrawBufferEXT
glDrawTransformFeedbackStreamInstanced
glDrawTransformFeedbackStream
glDrawTransformFeedbackNV
glDrawTransformFeedbackInstancedEXT
glDrawTransformFeedbackInstanced
glDrawTransformFeedbackEXT
glDrawTransformFeedback
glDrawTexxvOES
glDrawTexxOES
glDrawTextureNV
glDrawTexsvOES
glDrawTexsOES
glDrawTexivOES
glDrawTexiOES
glDrawTexfvOES
glDrawTexfOES
glDrawRangeElementsEXT
glDrawRangeElementsBaseVertexOES
glDrawRangeElementsBaseVertexEXT
glDrawRangeElementsBaseVertex
glDrawRangeElements
glDrawPixels
glDrawElementsInstancedNV
glDrawElementsInstancedEXT
glDrawElementsInstancedBaseVertexOES
glDrawElementsInstancedBaseVertexEXT
glDrawElementsInstancedBaseVertexBaseInstanceEXT
glDrawElementsInstancedBaseVertexBaseInstance
glDrawElementsInstancedBaseVertex
glDrawElementsInstancedBaseInstanceEXT
glDrawElementsInstancedBaseInstance
glDrawElementsInstancedARB
glDrawElementsInstanced
glDrawElementsIndirect
glDrawElementsBaseVertexOES
glDrawElementsBaseVertexEXT
glDrawElementsBaseVertex
glDrawElements
glDrawCommandsStatesNV
glDrawCommandsStatesAddressNV
glDrawCommandsNV
glDrawCommandsAddressNV
glDrawBuffersNV
glDrawBuffersATI
glDrawBuffersARB
glDrawBuffers
glDrawBuffer
glDrawArraysInstancedNV
glDrawArraysInstancedEXT
glDrawArraysInstancedBaseInstanceEXT
glDrawArraysInstancedBaseInstance
glDrawArraysInstancedARB
glDrawArraysInstanced
glDrawArraysIndirect
glDrawArraysEXT
glDrawArrays
eglSwapBuffersWithDamageKHR
eglSwapBuffers
glXSwapBuffers
glXQueryDrawable
glXGetCurrentReadDrawable
glXGetCurrentDrawable
glGetQueryObjectuivEXT
glGetQueryObjectuivARB
glGetQueryObjectuiv
glGetQueryObjectivARB
glGetQueryObjectiv
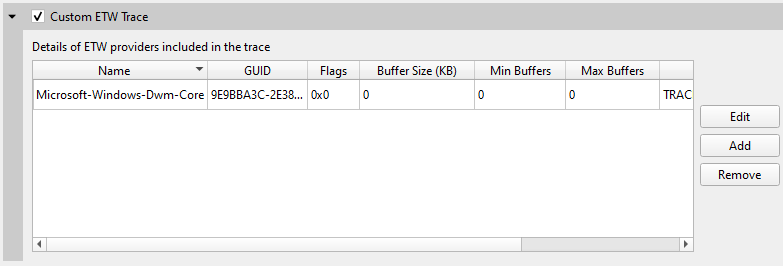
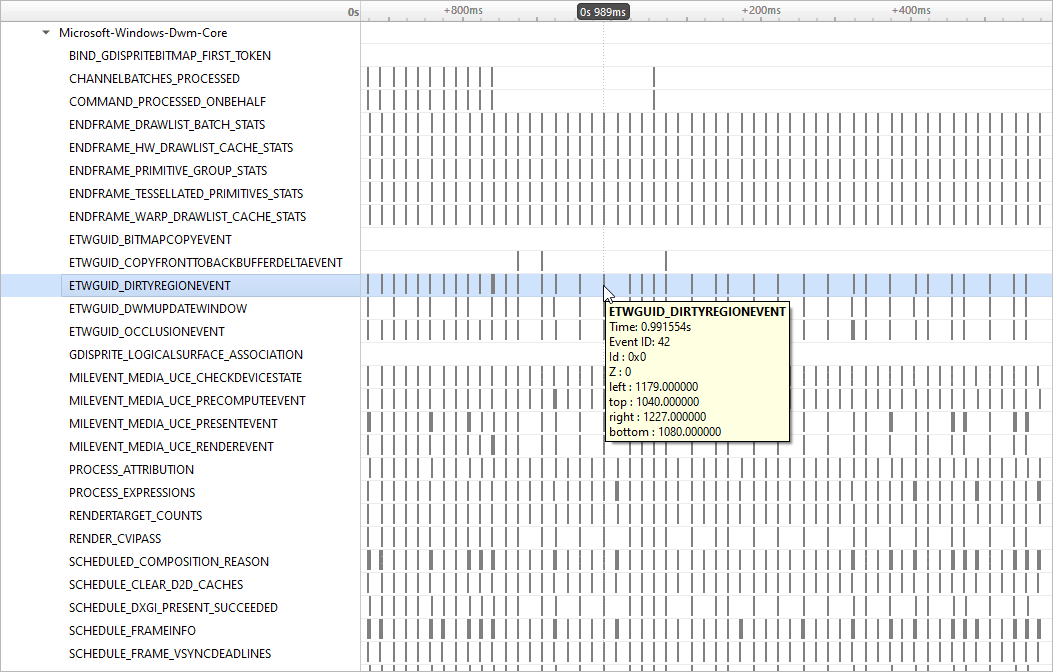
12. Custom ETW Trace
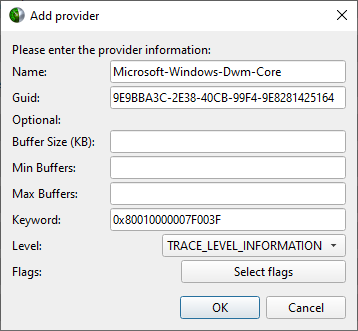
Use the custom ETW trace feature to enable and collect any manifest-based ETW log. The collected events are displayed on the timeline on dedicated rows for each event type.
Custom ETW is available on Windows target machines.
Notices
Notice
NVIDIA® Nsight™ Systems User GuideSend Feedback
THE INFORMATION IN THIS GUIDE AND ALL OTHER INFORMATION CONTAINED IN NVIDIA DOCUMENTATION REFERENCED IN THIS GUIDE IS PROVIDED “AS IS.” NVIDIA MAKES NO WARRANTIES, EXPRESSED, IMPLIED, STATUTORY, OR OTHERWISE WITH RESPECT TO THE INFORMATION FOR THE PRODUCT, AND EXPRESSLY DISCLAIMS ALL IMPLIED WARRANTIES OF NONINFRINGEMENT, MERCHANTABILITY, AND FITNESS FOR A PARTICULAR PURPOSE. Notwithstanding any damages that customer might incur for any reason whatsoever, NVIDIA’s aggregate and cumulative liability towards customer for the product described in this guide shall be limited in accordance with the NVIDIA terms and conditions of sale for the product.
THE NVIDIA PRODUCT DESCRIBED IN THIS GUIDE IS NOT FAULT TOLERANT AND IS NOT DESIGNED, MANUFACTURED OR INTENDED FOR USE IN CONNECTION WITH THE DESIGN, CONSTRUCTION, MAINTENANCE, AND/OR OPERATION OF ANY SYSTEM WHERE THE USE OR A FAILURE OF SUCH SYSTEM COULD RESULT IN A SITUATION THAT THREATENS THE SAFETY OF HUMAN LIFE OR SEVERE PHYSICAL HARM OR PROPERTY DAMAGE (INCLUDING, FOR EXAMPLE, USE IN CONNECTION WITH ANY NUCLEAR, AVIONICS, LIFE SUPPORT OR OTHER LIFE CRITICAL APPLICATION). NVIDIA EXPRESSLY DISCLAIMS ANY EXPRESS OR IMPLIED WARRANTY OF FITNESS FOR SUCH HIGH RISK USES. NVIDIA SHALL NOT BE LIABLE TO CUSTOMER OR ANY THIRD PARTY, IN WHOLE OR IN PART, FOR ANY CLAIMS OR DAMAGES ARISING FROM SUCH HIGH RISK USES.
NVIDIA makes no representation or warranty that the product described in this guide will be suitable for any specified use without further testing or modification. Testing of all parameters of each product is not necessarily performed by NVIDIA. It is customer’s sole responsibility to ensure the product is suitable and fit for the application planned by customer and to do the necessary testing for the application in order to avoid a default of the application or the product. Weaknesses in customer’s product designs may affect the quality and reliability of the NVIDIA product and may result in additional or different conditions and/or requirements beyond those contained in this guide. NVIDIA does not accept any liability related to any default, damage, costs or problem which may be based on or attributable to: (i) the use of the NVIDIA product in any manner that is contrary to this guide, or (ii) customer product designs.
Other than the right for customer to use the information in this guide with the product, no other license, either expressed or implied, is hereby granted by NVIDIA under this guide. Reproduction of information in this guide is permissible only if reproduction is approved by NVIDIA in writing, is reproduced without alteration, and is accompanied by all associated conditions, limitations, and notices.
Trademarks
NVIDIA, the NVIDIA logo, and cuBLAS, CUDA, CUDA-GDB, CUDA-MEMCHECK, cuDNN, cuFFT, cuSPARSE, DIGITS, DGX, DGX-1, DGX Station, NVIDIA DRIVE, NVIDIA DRIVE AGX, NVIDIA DRIVE Software, NVIDIA DRIVE OS, NVIDIA Developer Zone (aka "DevZone"), GRID, Jetson, NVIDIA Jetson Nano, NVIDIA Jetson AGX Xavier, NVIDIA Jetson TX2, NVIDIA Jetson TX2i, NVIDIA Jetson TX1, NVIDIA Jetson TK1, Kepler, NGX, NVIDIA GPU Cloud, Maxwell, Multimedia API, NCCL, NVIDIA Nsight Compute, NVIDIA Nsight Eclipse Edition, NVIDIA Nsight Graphics, NVIDIA Nsight Integration, NVIDIA Nsight Systems, NVIDIA Nsight Visual Studio Edition, NVLink, nvprof, Pascal, NVIDIA SDK Manager, Tegra, TensorRT, Tesla, Visual Profiler, VisionWorks and Volta are trademarks and/or registered trademarks of NVIDIA Corporation in the United States and other countries. Other company and product names may be trademarks of the respective companies with which they are associated.