GPU Performance and Sharing Characteristics#
GPU Performance Benchmark Tests#
The GPU performance benchmark tests measure GPU performance for virtualized workloads that use NVIDIA GPU virtualization software. To measure the performance of a GPU running a specific virtualized workload, a representative benchmark test for that workload is run on the GPU.
In many cases, cost rather than raw performance is the principal factor in selecting the right virtual GPU solution for a specific workload.
Unless otherwise stated, the tests are run with vGPU profiles that are allocated all the physical GPU’s memory. This vGPU profile size was chosen because the impact of scaling does not vary across GPUs [1].
Table 3 summarizes the benchmark results and identifies the GPU that provide the best raw performance.
Note
When choosing GPUs based on raw performance, use these results for general guidance only. All results are based on the workloads listed in Table 3, which could differ from the applications being used in production.
Workload |
Benchmark |
Best Raw Performance GPU |
|---|---|---|
Professional graphics |
SPECviewperf 15 (3840x2160) |
NVIDIA RTX PRO 6000 Blackwell Server Edition |
GPU performance for professional graphics workloads was measured by using the SPECviewperf 15 (3840x2160) benchmark test. SPECviewperf 15 is a widely recognized benchmark for measuring the 3D graphics performance of systems using real-world professional workloads. It evaluates performance under the OpenGL, DirectX, and Vulkan graphics APIs using application-derived “viewsets,” providing a standardized comparison of graphics hardware in professional visualization scenarios. For time-sliced vGPU configurations in these tests, the best effort scheduler was used.
Test Results#
Performance Comparison#
For professional graphics workloads, the principal factor in determining cost effectiveness is performance per dollar. Figure 2 compares the performance of all GPUs recommended for NVIDIA RTX vWS and shows that the NVIDIA RTX PRO 6000 Blackwell Server Edition provides the highest raw performance.
For organizations currently using NVIDIA Ampere (A-series) or Ada Lovelace (L-series) architectures, moving to the NVIDIA RTX PRO 4500 Blackwell Server Edition represents a substantial performance improvement rather than an incremental upgrade for today’s AI-augmented applications. Specifically, based on SPECviewperf 15 results, the NVIDIA RTX PRO 4500 Blackwell Server Edition delivers 90% higher performance than the NVIDIA L4 and 80% higher performance than the NVIDIA A10.
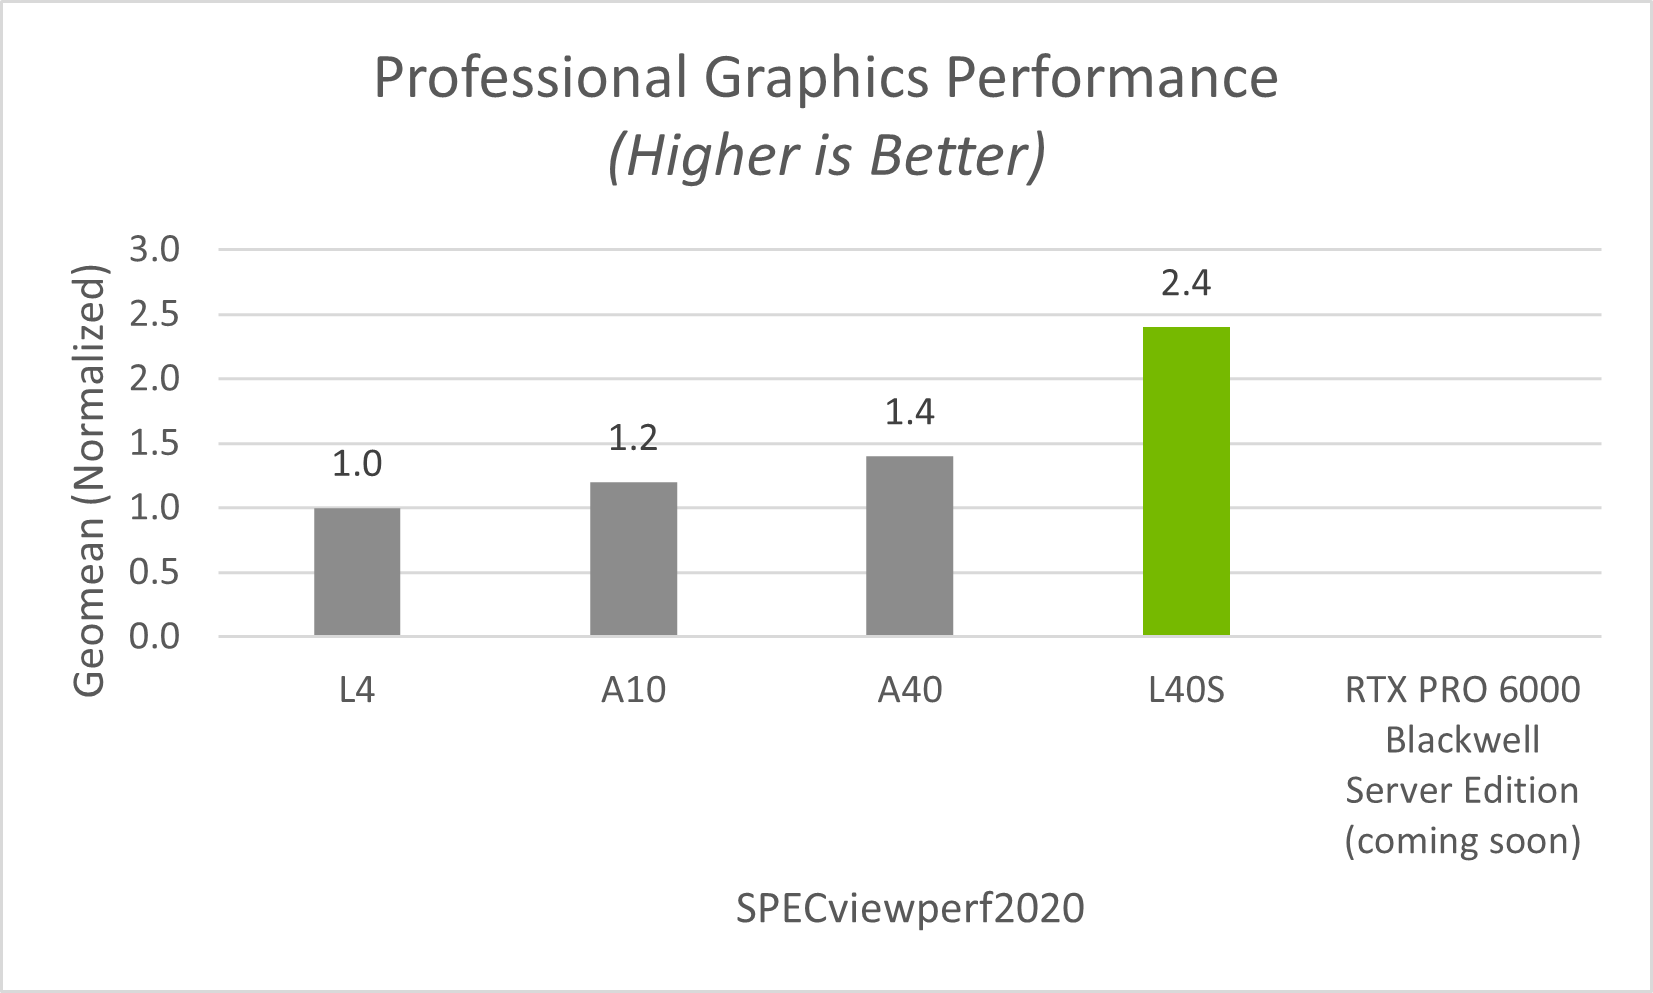
Figure 2 RTX vWS SPECviewperf15 Performance#
MIG-Backed vGPU Performance#
Based on SPECviewperf 15 results, Figure 3 shows that, at the 48 GB profile size, MIG-backed vGPU delivered 20% higher performance than time-sliced vGPU. This improvement is due to MIG’s hardware partitioning of GPU resources, which provides stronger resource isolation, more predictable performance, improved resource utilization, and better quality of service (QoS) than time-sliced vGPU.
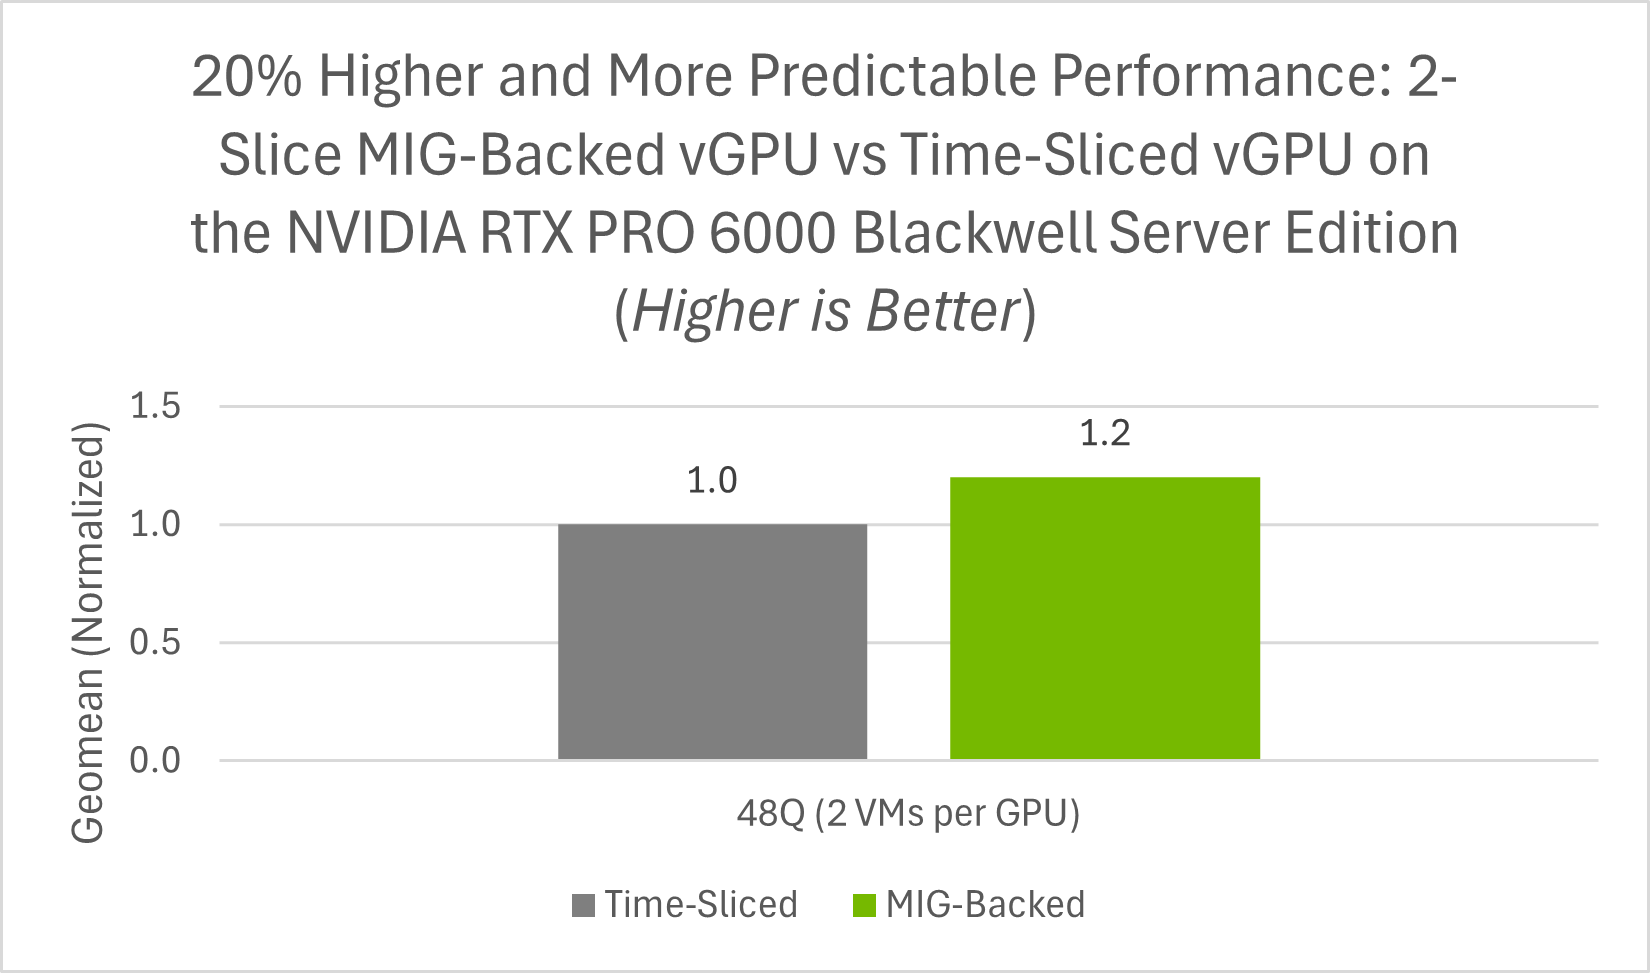
Figure 3 RTX vWS SPECviewperf15 MIG-Backed vGPU vs Time-Sliced vGPU#
Recommended Deployments#
The NVIDIA RTX PRO 6000 Blackwell Server Edition is the recommended GPU for high-performance vWS deployments where maximum graphics performance and support for demanding professional workloads are the primary considerations. The NVIDIA RTX PRO 4500 Blackwell Server Edition is the recommended GPU for entry-level vWS deployments where cost effectiveness and user density are the primary considerations. Its 165 W single-slot design also makes it well suited for dense, power-efficient server deployments.
The server configuration for benchmarking professional graphics workloads is listed in Table 9.
Impact of GPU Sharing#
NVIDIA vGPU software enables multiple virtual machines (VMs) to share a single physical GPU. This improves overall GPU utilization, but the way resources are shared depends on the underlying virtualization technology: either time-sliced vGPU or MIG-backed vGPU.
Time-Sliced vGPU Sharing#
With time-sliced vGPU, multiple VMs share GPU access over time. NVIDIA vGPU software uses the best effort scheduler by default, which aims to balance performance across vGPUs.
Scheduling Options for GPU Sharing#
To accommodate a variety of Quality of Service (QoS) levels for sharing a GPU, NVIDIA vGPU software provides multiple GPU scheduling options. For more information about these GPU scheduling options, refer to vGPU Schedulers.
MIG-Backed vGPU Sharing#
With MIG (Multi-Instance GPU), a single physical GPU is partitioned at the hardware level into multiple fully isolated GPU instances. This provides guaranteed performance isolation between VMs.
Performance Allocation#
Unlike standard time-sliced vGPU, MIG partitions a physical GPU into hardware-isolated GPU instances. Each MIG instance is assigned a dedicated slice of GPU resources with its own Streaming Multiprocessors (SMs) and memory subsystem, which provides stronger performance isolation than standard time-sliced vGPU.
Multiple vGPUs can also be created within a single MIG slice. This capability is referred to as MIG-backed time-sliced vGPU. In this case, the vGPUs remain bounded by the hardware-isolated resources of the MIG slice to which they are assigned. For example:
When MIG instances are created, each instance delivers consistent and isolated performance to its assigned VM.
Within each MIG slice, vGPUs can be created and time-sliced within that isolated slice. These vGPUs can be assigned to separate VMs, which continue to benefit from MIG’s hardware-level isolation boundaries.
Effect of GPU Sharing on Overall Throughput#
To measure the effect of GPU sharing on overall throughput, the SPECviewperf 15 benchmark test was run against a GPU that was allocated to a single VM and then shared among two and four VMs. For the time-sliced vGPU configurations in these tests, the best effort scheduler was used.
With two virtual machines, throughput is increased by 34%.
With four virtual machines, throughput is increased by 52%.
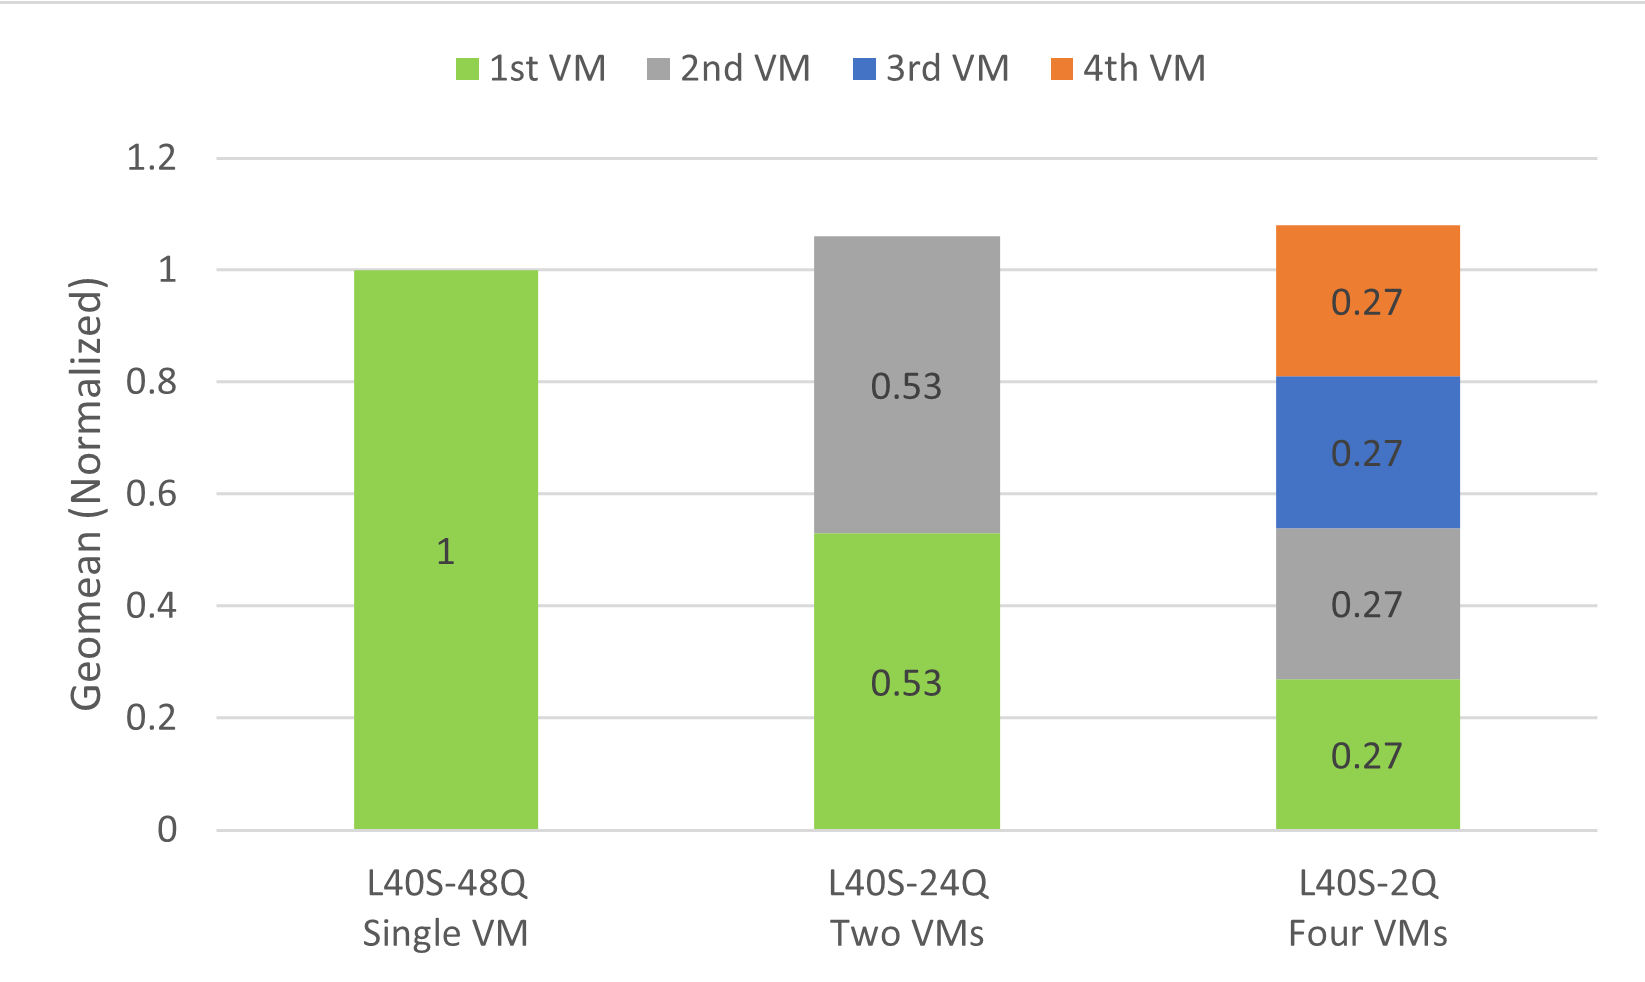
Figure 4 Effect of GPU Sharing on Overall Throughput#
This increase in throughput is typical in multi-VM testing scenarios. When scaling from a single VM to multiple VMs, the combined throughput of the VMs should exceed the geomean throughput of the single VM. As additional CPU resources are allocated, throughput improves, peaking at a certain point before stabilizing around 1x throughput. For multi-VM deployments that require more consistent performance and stronger isolation between workloads, MIG-backed vGPU is the recommended approach.
The server configuration for measuring the effect of GPU sharing on overall throughput is listed in Table 10.