Function Monitoring#
Troubleshooting#
For troubleshooting deployment failures see Deployment Failures.
For troubleshooting invocation failures see Statuses and Errors.
See below for adding logging to your inference container, and viewing metrics.
Logging and Metrics#
This section gives an overview of available metrics and logs within the Cloud Functions UI. Note that for full observability of production workloads, it’s recommended to emit logs, metrics, analytics etc. to third-party monitoring tools from within your container.
Emit and View Inference Container Logs#
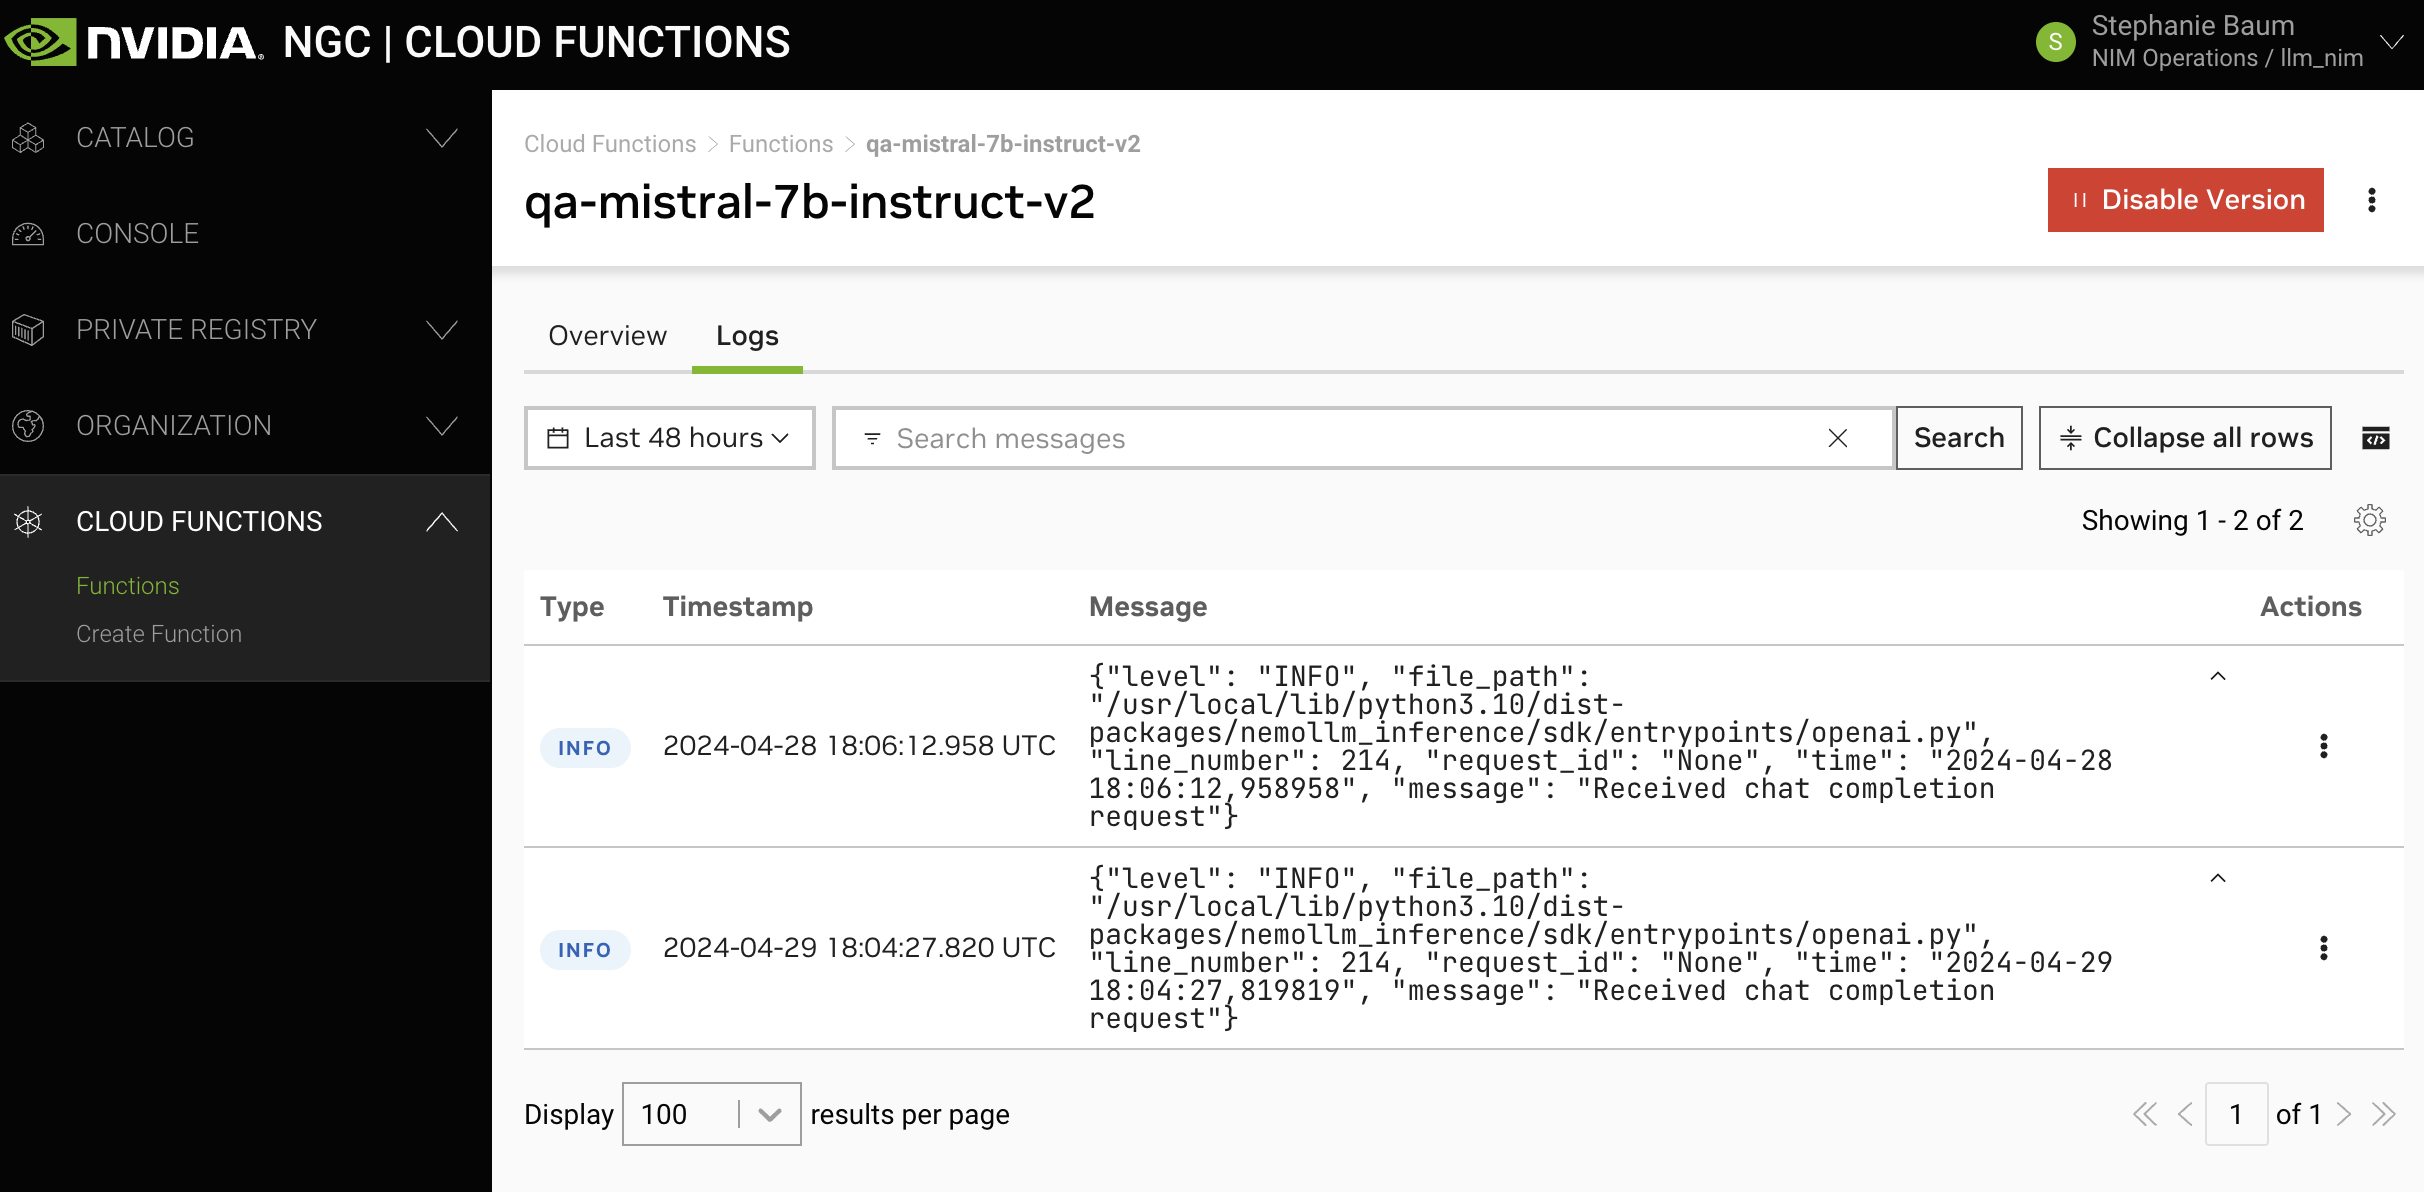
View inference container logs in the Cloud Functions UI via the “Logs” tab in the function details page. To get here, click any function version from the “Functions” list and click “View Details” on the side panel to the right.

Logs are currently available with up to 48 hours history, with the ability to view as expanded rows for scanning, or as a “window” view for ease of copying and pasting. A maximum of 3000 log lines per minute per container will be recorded. If you exceed that limit, the latest message will be replaced with a warning and all subsequent messages are dropped until the next window opens (i.e. you enter the next minute).
Warning
Note as a prerequisite, your inference container will have to be instrumented to emit logs. This is highly recommended.
How to Add Logs to Your Inference Container#
Here is an example of adding NVCF-compatible logs. The helper function for logging below, along with other helper functions, can be imported from the Helper Functions repository.
 1 import logging
 2
 3 def get_logger() -> logging.Logger:
 4     """
 5     gets a Logger that logs in a format compatible with NVCF
 6     :return: logging.Logger
 7     """
 8     sys.stdout.reconfigure(encoding="utf-8")
 9     logging.basicConfig(
10         level=logging.INFO,
11         format="%(asctime)s [%(levelname)s] [INFERENCE] %(message)s",
12         handlers=[logging.StreamHandler(sys.stdout)],
13     )
14     logger = logging.getLogger(__name__)
15     return logger
16
17 class MyServer:
18
19     def __init__(self):
20         self.logger = get_logger()
21
22     def _infer_fn(self, request):
23         self.logger.info("Got a request!")
View Function Metrics#
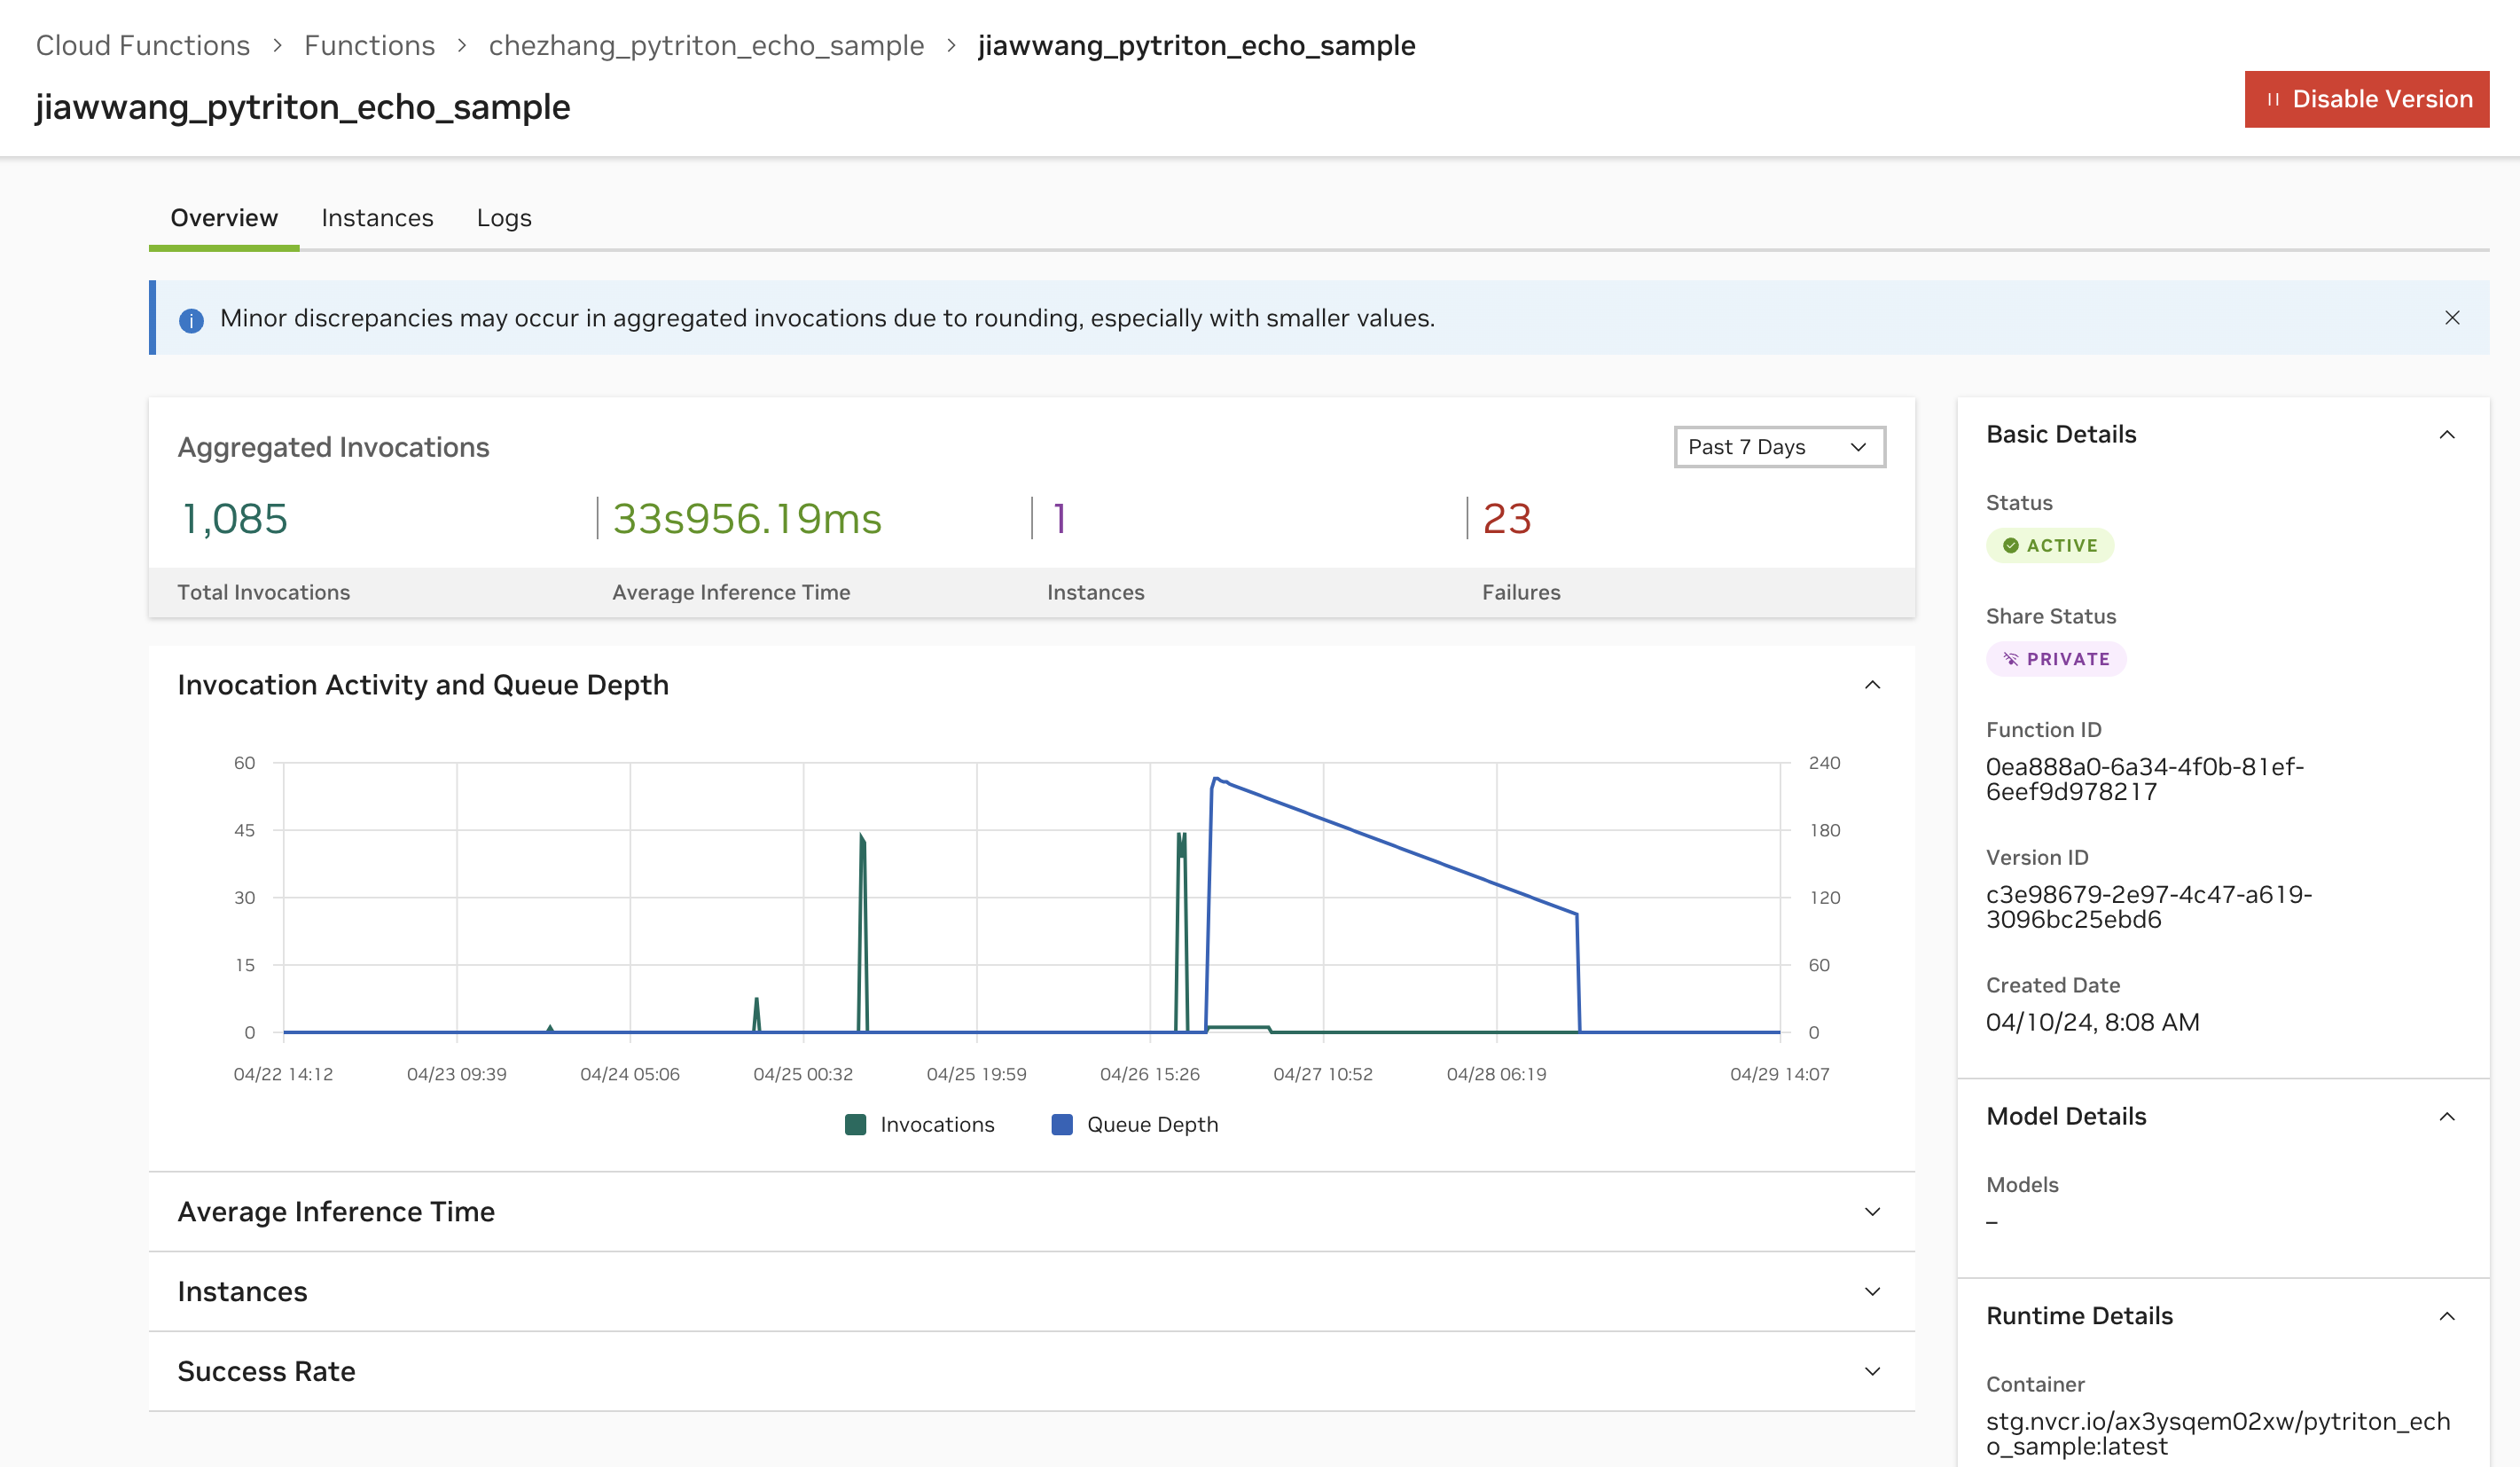
NVCF exposes the following metrics by default.
Instance counts (current, min and max)
Invocation activity and queue depth
Total invocation count, success rate and failure count
Average inference time
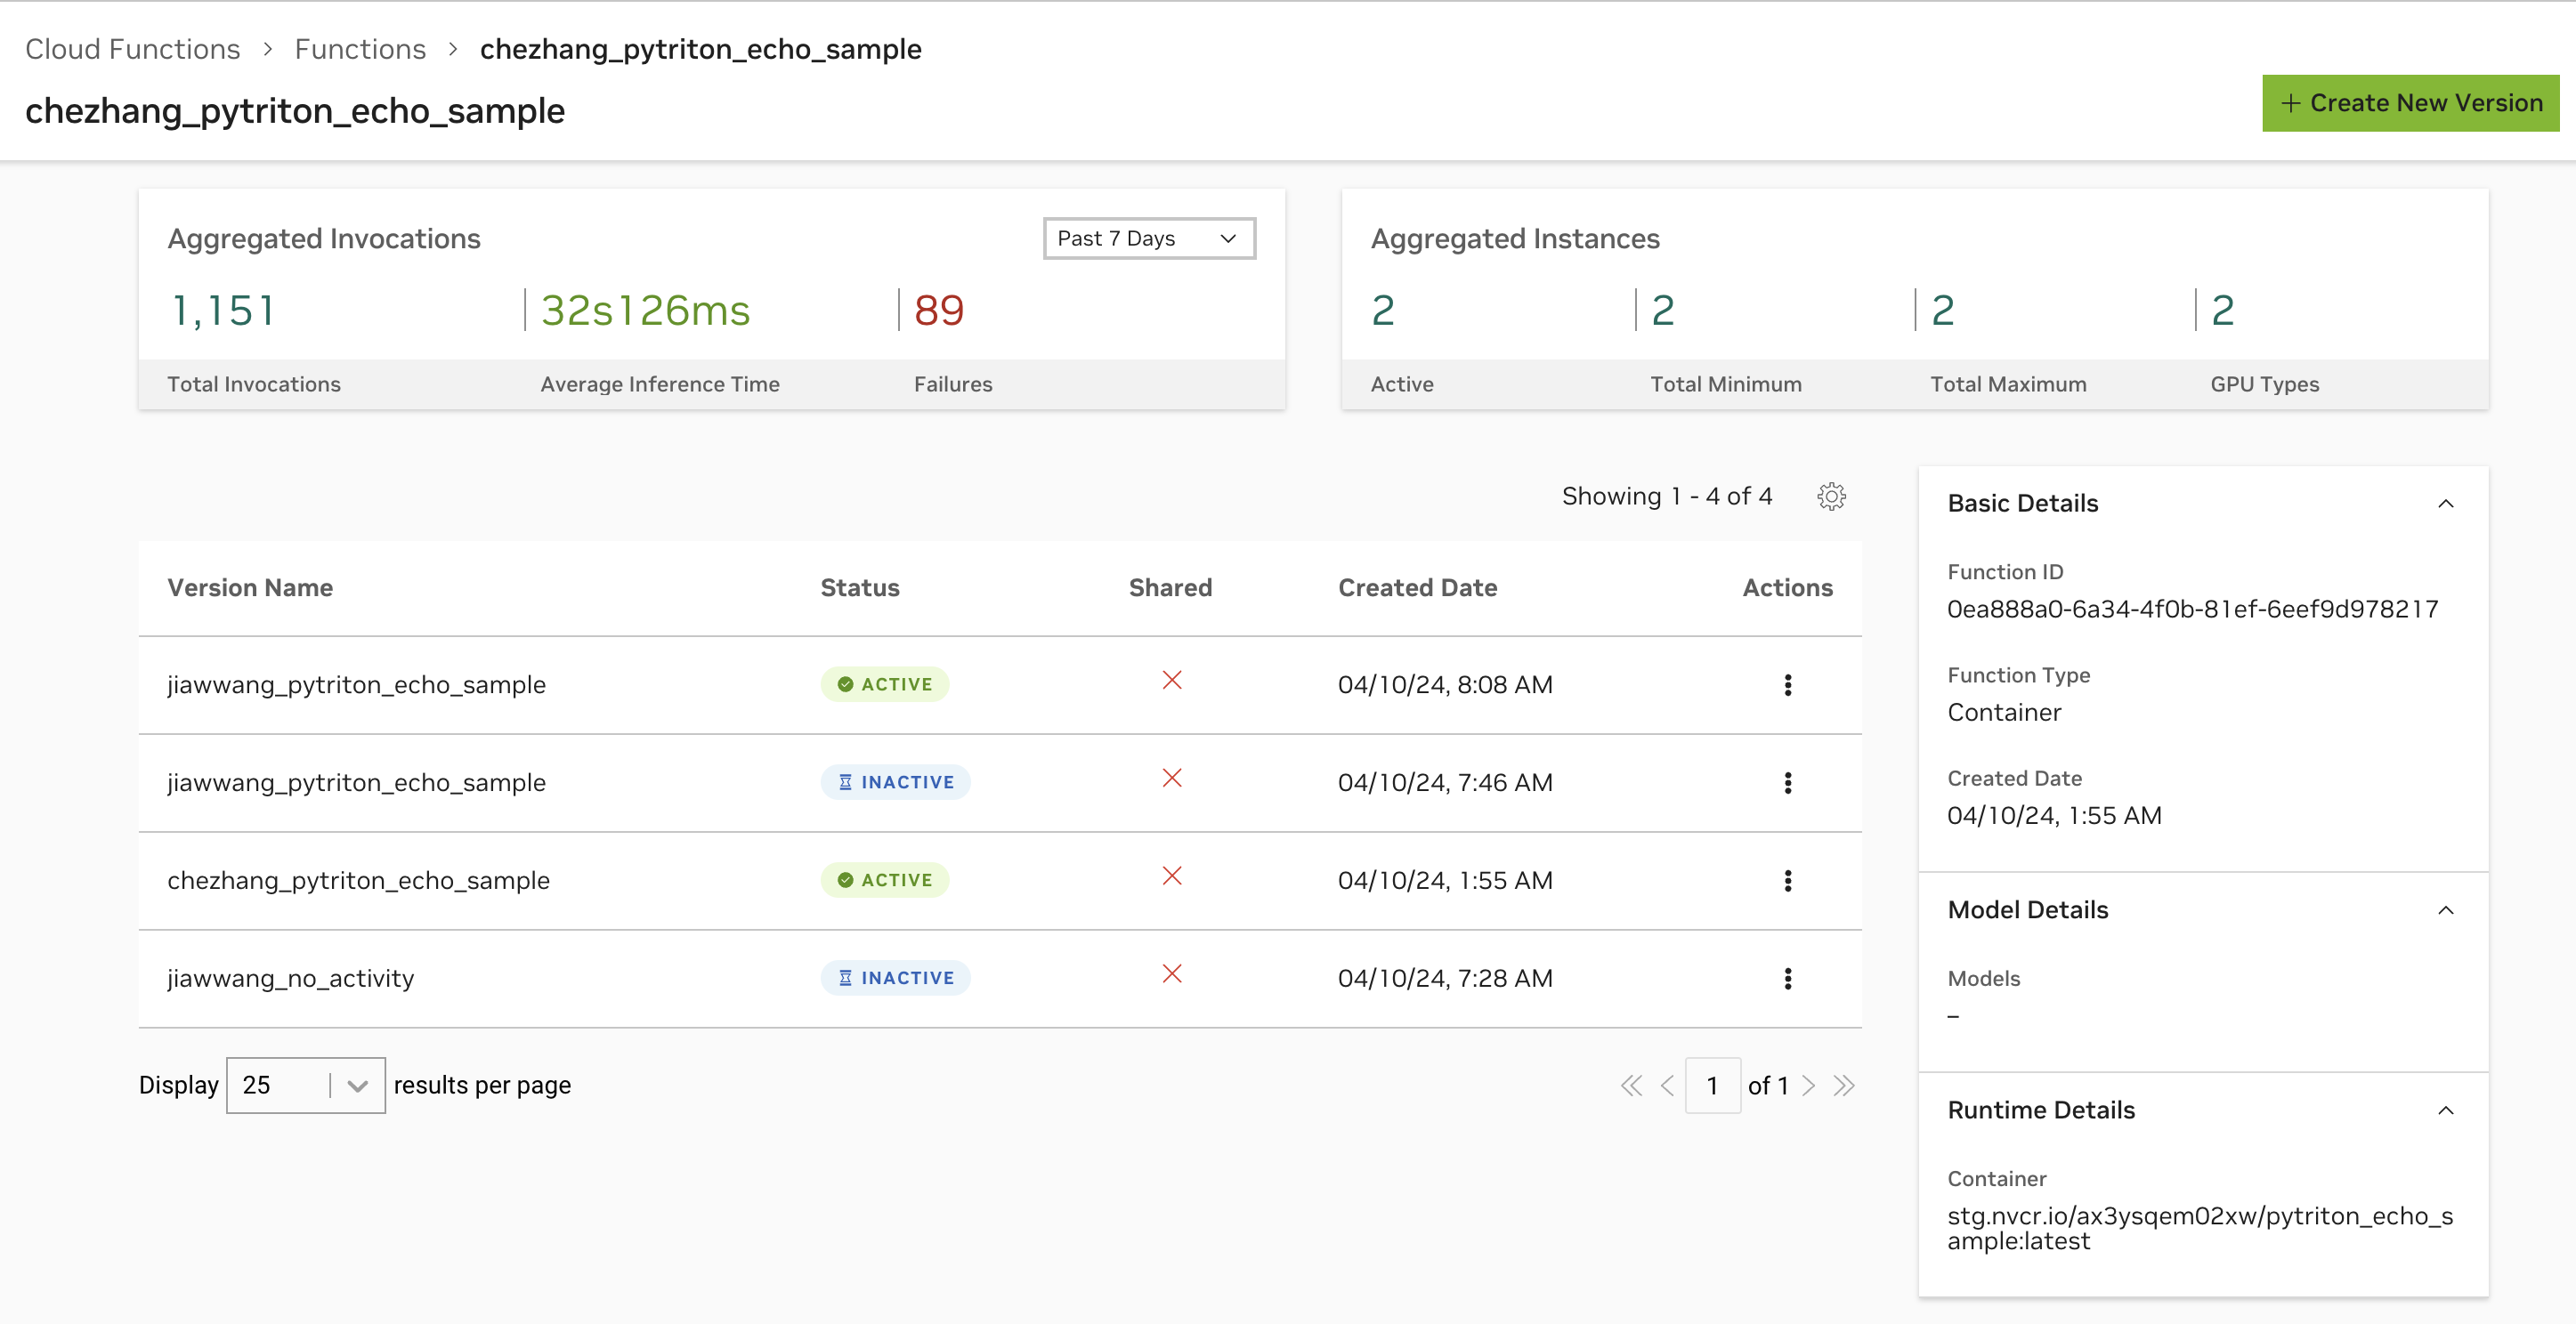
Metrics are viewable upon clicking any function from the “Functions” list page. The function overview page will display aggregated values across all function versions.

When clicking on a function version’s details page, you will then see metrics for this specific function version.

Warning
There may be up to a 5-minute delay on metric ingestion. Any time-series queries within the page are aggregated at 5-minute intervals with a step set to show 500 data points. All stat queries are based on the total selected period and reduced to either show the latest total value or a mean value.
Instrument with OpenTelemetry#
Users can (auto)instrument their container functions with OpenTelemetry SDK and have the signals (logs, traces and metrics) to observability backend such as Grafana Cloud.
See examples of container functions in GitHub.