

SLA-Driven Profiling with DynamoGraphDeploymentRequest
New to DGDR and SLA-Driven Profiling? Start with the SLA-Driven Profiling and Planner Deployment Quick Start Guide for step-by-step instructions. This document provides deeper technical details about the profiling process.
Overview
Dynamo provides automated SLA-driven profiling through DynamoGraphDeploymentRequests (DGDR). Instead of manually running profiling scripts, you declare your performance requirements and let the Dynamo Operator handle profiling and deployment automatically.
Key Benefits:
- Declarative: Specify SLAs, not implementation details
- Automated: No manual job setup or result processing
- Integrated: Seamlessly works with Dynamo Operator
- Production-Ready: Generates optimized configurations with SLA planner
This document covers:
- Technical details of online vs offline profiling
- Profiling process internals (GPU usage, measurements, interpolation)
- Direct script usage for advanced scenarios
- Comprehensive troubleshooting
Support Matrix
Specifically, the profiler sweeps over the following parallelization mapping for prefill and decode:
- Exact model x parallelization mapping support is dependent on the backend. The profiler does not guarantee that the recommended P/D engine configuration is supported and bug-free by the backend.
Using DGDR for Profiling (Recommended)
The recommended way to profile models is through DGDRs. Sample configurations are provided in deploy/:
Available Samples:
profile_sla_dgdr.yaml: Standard profiling with AIPerf on real enginesprofile_sla_aic_dgdr.yaml: Fast profiling with AI Configurator simulationprofile_sla_moe_dgdr.yaml: MoE model profiling
The Dynamo Operator automatically:
- Discovers GPU resources (cluster-scoped operators only)
- Runs profiling (AIPerf on real engines or AI Configurator simulation)
- Generates optimal DGD configuration with SLA planner
- Deploys the DGD to your cluster
See the Quick Start Guide for prerequisites and detailed instructions.
Hardware Configuration
Hardware parameters have sensible defaults and are optional - you can override them if needed:
Automatic GPU Discovery (Optional Feature)
Cluster-scoped operators can optionally enable automatic GPU discovery to detect hardware from cluster nodes. When enabled, hardware config is auto-detected and overrides any manually specified values.
This feature is only available with cluster-scoped operators (namespaceRestriction.enabled=false) as it requires cluster-wide node access permissions. It is not available for namespace-restricted operators.
Profiling Method
- Hardware Setup: Uses defaults or user-specified hardware configuration. Optionally, cluster-scoped operators can enable automatic GPU discovery to detect specifications from cluster nodes.
- Identify Sweep Ranges: Automatically determine minimum and maximum number of GPUs per engine. Minimum is determined by the model size and GPU VRAM. Maximum is set to one node for dense model and 4 nodes for MoE models.
- Parallelization Mapping Sweep: Use the input ISL and OSL, test the performance of the engines with different parallelization mappings.
- For dense models, we test different TP sizes for both prefill and decode.
- For MoE models (SGLang), we evaluate both TEP and DEP as candidates for prefill and decode.
- Prefill:
- TP/TEP: We measure TTFT with batch size = 1 (assuming ISL is long enough to saturate compute) without KV reuse.
- DEP: Attention uses data parallelism. We send a single burst with total concurrency
attention_dp_size × attn_dp_num_req_ratio(defaults to 4) and compute the reported TTFT astime_to_first_token.max / attn_dp_num_req_ratiofrom the AIPerf summary of that burst. This stabilizes measurements when the first batch may launch before all requests arrive.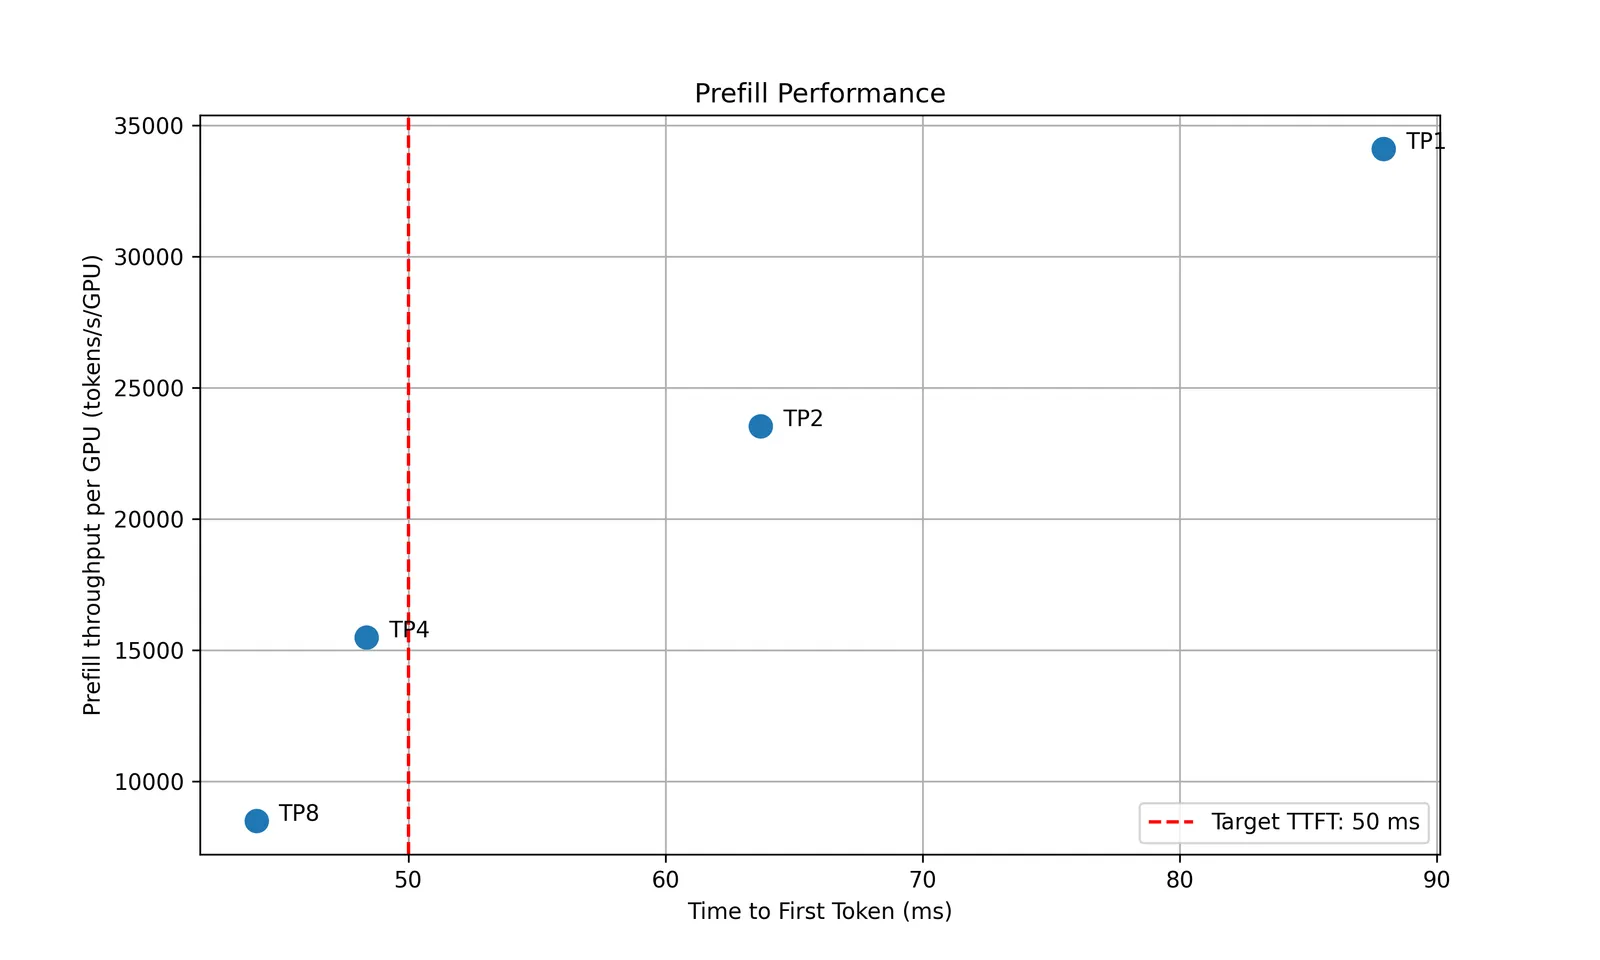
- Decode: Since the ITL (or iteration time) is relevant with how many requests are in-flight, we measure the ITL under different number of in-flight requests. The range of the number of in-flight requests is from 1 to the maximum number of requests that the kv cache of the engine can hold. To measure the ITL without being affected by piggy-backed prefill requests, the script will enable kv-reuse and warm up the engine by issuing the same prompts before measuring the ITL. Since the kv cache is sufficient for all the requests, it can hold the kv cache of the pre-computed prompts and skip the prefill phase when measuring the ITL. However, for MoE models, this is not guaranteed because the kv cache in different attention DP ranks is different. We are working on framework-side change to fix this issue. For example, the below plot shows the decode parallelization mapping sweep results for H100 for deepseek-ai/DeepSeek-R1-Distill-Llama-8B.
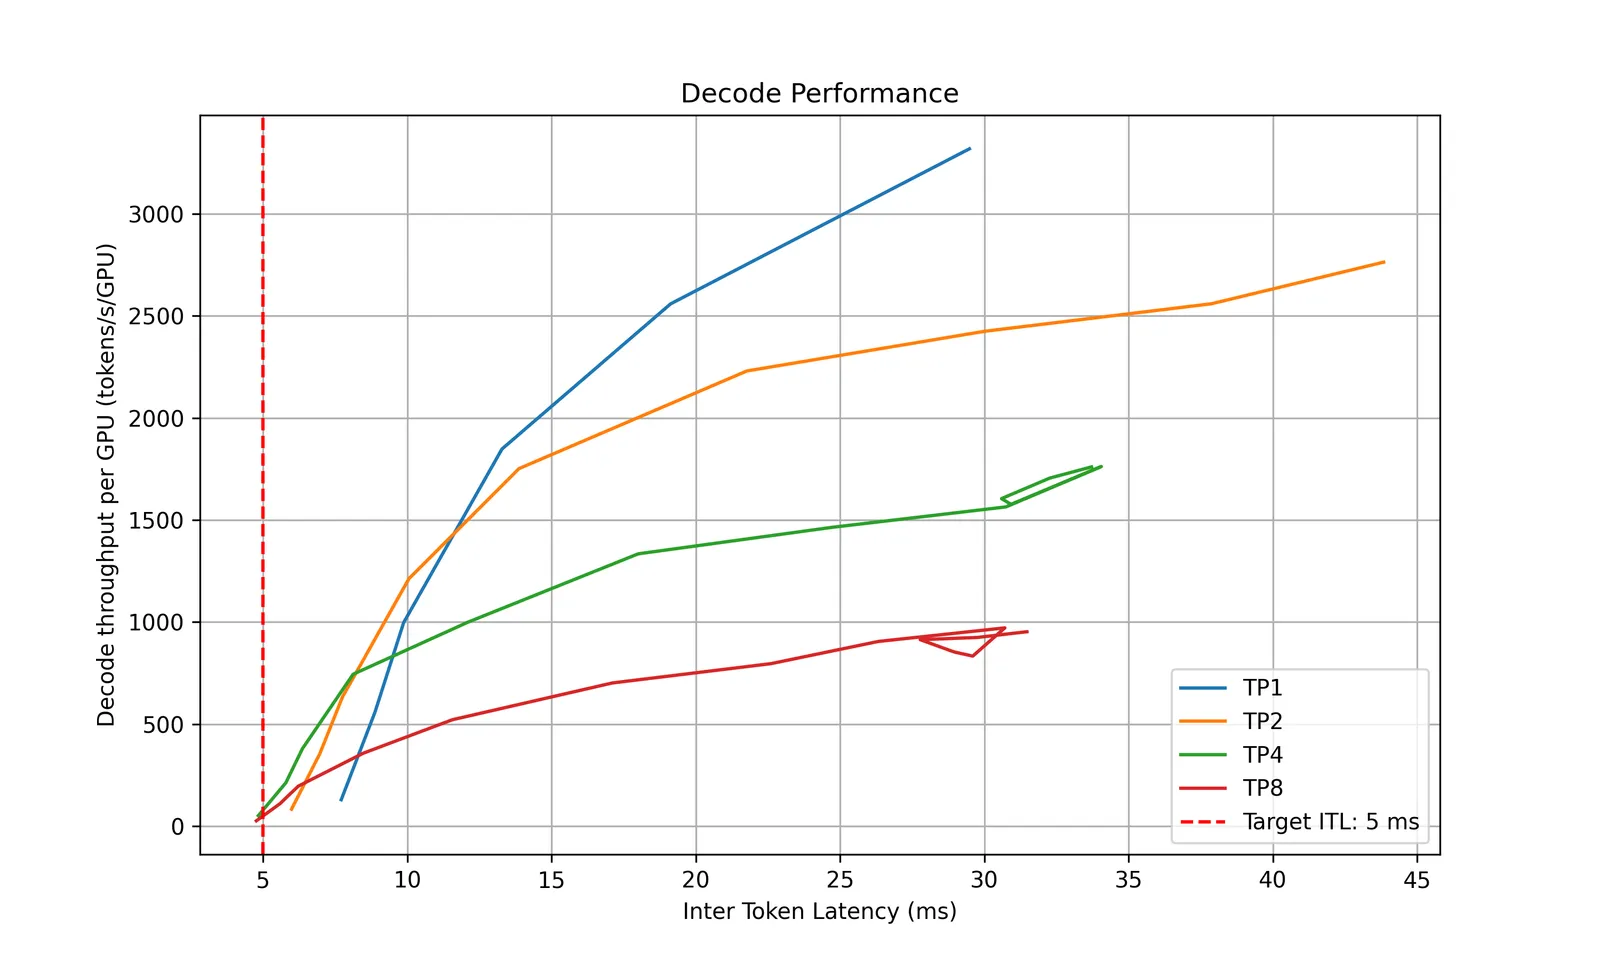
- Recommendation: Selects optimal parallelization mapping for prefill and decode that achieves the highest per GPU throughput while adhering the SLA on TTFT and ITL. Specifically, the profiler will choose the point (or a point on the curve for decode) that is left to the vertical red dashed line that represents the SLAs while has the highest y coordinate (throughput per GPU).
- In-Depth Profiling on the Recommended P/D Engine: After finding the best TP size for prefill and decode, the script will then interpolate the TTFT with ISL and ITL with active KV cache and decode context length. This is to provide a more accurate estimation of the performance when ISL and OSL changes and will be used in the sla-planner.
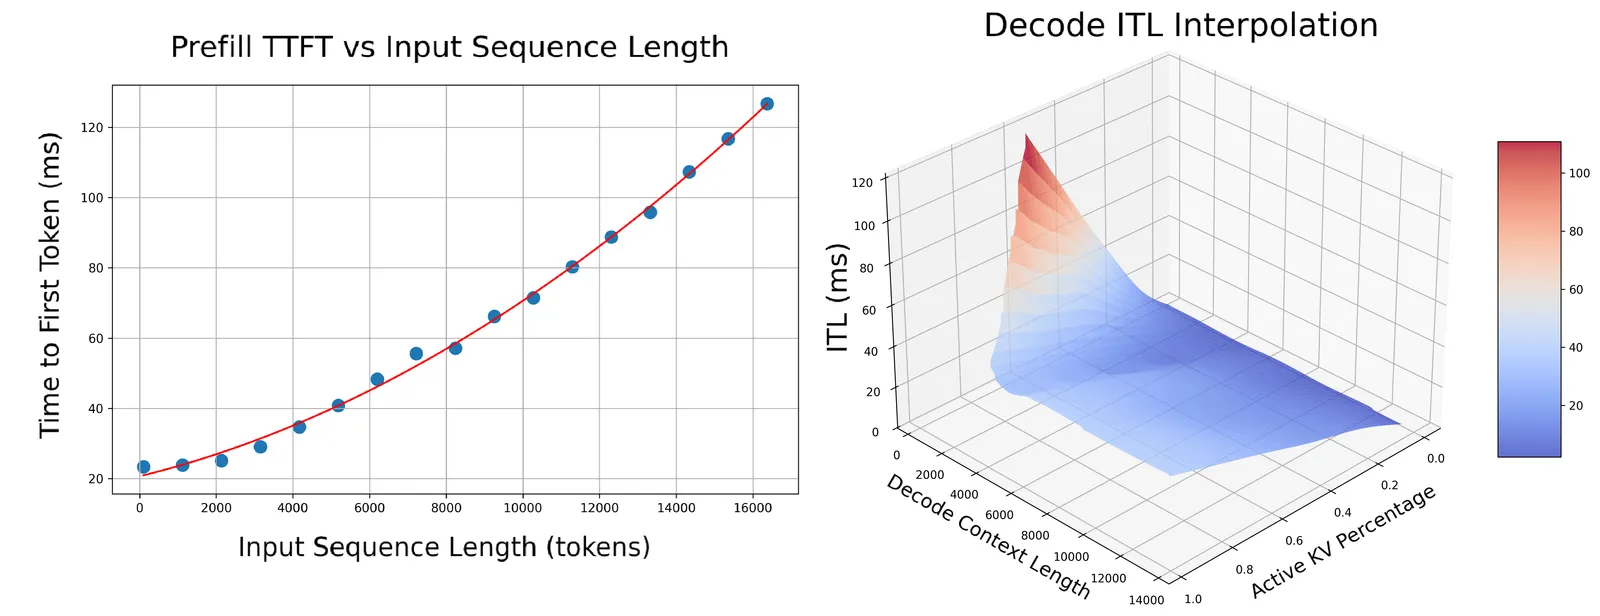
- Prefill: Measures TTFT and throughput per GPU across different input lengths with batch size=1.
- Decode: Measures ITL and throughput per GPU under various KV cache loads and decode context lengths. The active kv usage determines the complexity of the memory-bounded attention kernel while the active kv usage divided the average context length determines the complexity of the computation bound MLP kernel. For example, the below figure shows the ITL of DS-Distilled Llama 8b model on H100 TP4. The ITL grows near-linearly with active kv usage under a fixed context length. And the slope increases as the context length decreases.
To run the parallelization mapping sweep and the in-depth profiling on the recommended P/D engine, the profiler need to know the engine’s forward pass time with different loads. There are two ways to achieve this: run AIPerf on real engines or use AI Configurator to run simulations.
AIPerf on Real Engines
Profiles your model by creating real test deployments in Kubernetes and measuring their performance.
Characteristics:
- Duration: 2-4 hours
- Accuracy: Highest (real measurements)
- GPU Requirements: Full access to test different parallelization mappings
- Backends: vLLM, SGLang, TensorRT-LLM
DGDR Configuration:
AI Configurator Simulation
Uses performance simulation to rapidly estimate optimal configurations without running real deployments.
Characteristics:
- Duration: 20-30 seconds
- Accuracy: Estimated (may have errors for unusual configurations)
- GPU Requirements: None
- Backends: TensorRT-LLM only (vLLM/SGLang coming soon)
DGDR Configuration:
Supported Configurations:
For the current list of supported models, systems, and backend versions, see the AI Configurator documentation.
To check from the command line: aiconfigurator cli --help
Currently supports:
- Backends: TensorRT-LLM (versions 0.20.0, 1.0.0rc3, 1.0.0rc6)
- Systems: H100 SXM, H200 SXM, B200 SXM, GB200 SXM, A100 SXM
- Models: Wide range including GPT, Llama, Mixtral, DeepSeek, Qwen, and more
Output Format
After profiling, the DGDR status contains:
- Recommended Configuration: Optimal TP for prefill and decode
- Performance Data: Interpolation models for SLA planner
- Generated DGD: Complete deployment manifest
Example Recommendations:
Interactive Configuration Selection WebUI
When running the profiler with --pick-with-webui, an interactive web interface is launched that allows you to visually explore profiling results and manually select configurations.
Features:
- Interactive Charts: Visualize prefill TTFT, decode ITL, and GPU hours analysis with hover-to-highlight synchronization between charts and tables
- Pareto-Optimal Analysis: The GPU Hours table shows pareto-optimal configurations balancing latency and throughput
- DGD Config Preview: Click “Show Config” on any row to view the corresponding DynamoGraphDeployment YAML
- GPU Cost Estimation: Toggle GPU cost display to convert GPU hours to cost ($/1000 requests)
- SLA Visualization: Red dashed lines indicate your TTFT and ITL targets
Selection Methods:
- GPU Hours Table (recommended): Click any row to select both prefill and decode configurations at once based on the pareto-optimal combination
- Individual Selection: Click one row in the Prefill table AND one row in the Decode table to manually choose each
Example DGD Config Output:
When you click “Show Config”, you’ll see a DynamoGraphDeployment configuration like:
Usage:
Once you have selected a configuration, the full DynamoGraphDeployment CRD will be saved in your output folder as config_with_planner.yaml.
The WebUI launches on port 8000 by default (configurable with --webui-port).
Output Performance Plots
The profiler will generate the following plots to better visualize the performance data:
Parallelization Mapping Sweep Plots:
prefill_performance.png: TTFT vs Parallelization Mapping sizedecode_performance.png: ITL vs Parallelization Mapping size and in-flight requests
Note these two plots are based on the input ISL and OSL.
In-Depth Profiling for the Recommended P/D Engine Plots:
selected_prefill_interpolation/prefill_ttft_interpolation.png: TTFT vs ISL for the recommended prefill engineselected_prefill_interpolation/prefill_throughput_interpolation.png: Throughput vs ISL for the recommended prefill engineselected_decode_interpolation/decode_itl_interplation.png: ITL vs KV usage and context length for the recommended decode engineselected_decode_interpolation/decode_throughput_interpolation.png: Throughput vs KV usage and context length for the recommended decode engine
Output Interpolation Data
The profiler generates .npz files to store the performance data for the recommended P/D engine:
Prefill Interpolation (selected_prefill_interpolation/raw_data.npz):
prefill_isl: 1D array of input sequence lengths testedprefill_ttft: 1D array of TTFTs (ms) at each ISLprefill_thpt_per_gpu: 1D array of throughput (tokens/s/GPU) at each ISL
Decode Interpolation (selected_decode_interpolation/raw_data.npz):
max_kv_tokens: Total KV tokens capacity in decode enginex_kv_usage: 1D array of active KV usage percentages [0, 1]y_context_length: 1D array of average context lengths testedz_itl: 1D array of ITLs (ms) at each (KV usage, context length) pointz_thpt_per_gpu: 1D array of throughput (tokens/s/GPU) at each point
DGDR Configuration Reference
This section provides detailed explanations of all DGDR profilingConfig options. The DGDR controller passes this configuration to the profiler script, which is defined in benchmarks/profiler/utils/profiler_argparse.py.
Configuration Structure
All profiler configuration goes under spec.profilingConfig.config:
SLA Configuration (Required)
Define your performance requirements and workload characteristics:
What these control:
- ISL/OSL: Based on your expected traffic patterns
- TTFT: First token latency target (lower = more GPUs needed, affects prefill engine)
- ITL: Token generation latency target (lower = more GPUs needed, affects decode engine)
- Trade-offs: Tighter SLAs require more GPU resources
Hardware Configuration (Optional)
Control GPU search space and constraints:
When to use:
- minNumGpusPerEngine: Skip small TP sizes if your model is large
- maxNumGpusPerEngine: Limit search space or work around constraints (e.g., AIC attention heads)
- numGpusPerNode: Determine the upper bound of number of GPUs per node for dense models and configure Grove for multi-node MoE engines.
- gpu_type: Informational, auto-detected by controller
If you don’t specify hardware constraints, the controller auto-detects based on your model size and available cluster resources.
Sweep Configuration (Optional)
Control profiling behavior:
Use cases:
- useAiConfigurator: Set to
truefor 20-30 second profiling (TensorRT-LLM only) - prefillInterpolationGranularity: How many samples to benchmark for prefill TTFT curve (lower = faster but may be less accurate)
- decodeInterpolationGranularity: How many samples to benchmark for decode ITL curve (lower = faster but may be less accurate). Since ITL interpolation is a 3d plot and takes longer to run, we default to a smaller number of samples. Increasing this value might quadratically increase the profiling time.
AI Configurator Configuration (Required if useAiConfigurator: true)
Configure AI Configurator profiling mode:
Supported configurations: See AI Configurator documentation
Planner Configuration (Optional)
Pass arguments to the SLA planner:
Planner arguments use planner_ prefix. See planner documentation for full list.
Model Cache PVC (Advanced)
For large models, you can use a pre-populated PVC containing model weights instead of downloading from HuggingFace. This is useful when:
- The model is not publicly available on HuggingFace
- You want to avoid repeated downloads during profiling
- You have a shared model cache across your cluster
Requirements:
- The PVC must exist in the same namespace as the DGDR
- The model weights must be accessible at
{mountPath}/{pvcPath}
Engine Configuration (Auto-configured)
The controller automatically sets these from high-level fields:
You should not manually set deployment.model or engine.backend in profilingConfig.config - they are automatically injected from the high-level fields.
Complete Example: AIPerf on Real Engines
Complete Example: AI Configurator Simulation
Complete Example: MoE Model
Troubleshooting
Profiling Takes Too Long
Solution 1: Use AI Configurator for rapid profiling (TensorRT-LLM only):
Solution 2: Reduce search space:
SLA Cannot Be Met
Symptoms: Profiler reports no configuration meets targets
Solutions:
- Relax SLA targets (increase TTFT/ITL)
- Add more GPU resources
- Try a different backend
- Use a smaller model
AI Configurator: Attention Head Constraint Error
Symptoms: Profiling fails with error:
Cause: AI Configurator requires ≥4 attention heads per GPU. Small models with few heads cannot use high TP sizes.
Affected Models:
- Qwen3-0.6B (16 heads): Max TP = 4 ❌ Fails at TP=8
- GPT-2 (12 heads): Max TP = 3
- Most models <1B parameters: May hit this constraint
Solution: Limit maxNumGpusPerEngine in your DGDR:
Calculate Max TP: max_tp = num_attention_heads / 4
Note: This is an AI Configurator limitation. Online profiling doesn’t have this constraint.
Image Pull Errors
Symptoms: ErrImagePull or ImagePullBackOff
Solution: Ensure image pull secrets are configured:
Out of Memory During Profiling
Symptoms: OOM errors in profiling jobs
Solutions:
- Reduce
gpu_memory_utilizationin engine config - Reduce
--max-context-length - Skip larger TP configurations
- Use fewer GPUs per test
Unsupported Parallelization Mapping in Backend
Symptoms: Starttime/runtime error in the backend. For example, prime number of attention heads restrain TP size to be 1 (i.e., falcon-7b with 71 attention heads). Or some backend does not support different TP sizes for prefill and decode.
Solutions:
- Contact the backend to add support for the use cases and bump backend version in dynamo.
- Restrain the max and min number of GPUs per engine to the supported range.
Next Steps
- Deploy with DGDR: See Quick Start Guide
- Understand SLA Planner: Read SLA Planner Deep Dive
- Monitor Deployments: Set up Observability
- Optimize Performance: See Performance Tuning