For AI agents: a documentation index is available at the root level at /llms.txt and /llms-full.txt. Append /llms.txt to any URL for a page-level index, or .md for the markdown version of any page.
Digest
  • Getting Started
    • Quickstart
    • Installation
    • Support Matrix
    • Feature Matrix
    • Examples
  • Kubernetes Deployment
  • User Guides
    • Tool Calling
    • Multimodality Support
    • Finding Best Initial Configs
    • Dynamo Benchmarking Guide
    • Tuning Disaggregated Performance
    • Writing Python Workers in Dynamo
      • Overview
      • Prometheus + Grafana Setup
      • Metrics
      • Metrics Developer Guide
      • Health Checks
      • Tracing
      • Logging
    • Glossary
  • Components
    • Router
  • Design Docs
    • Overall Architecture
    • Architecture Flow
    • Disaggregated Serving
    • Distributed Runtime
NVIDIANVIDIA
Developer-friendly docs for your API
Privacy Policy | Your Privacy Choices | Terms of Service | Accessibility | Corporate Policies | Product Security | Contact

Copyright © 2026, NVIDIA Corporation.

LogoLogoDocumentation
Digest
On this page
  • Overview
  • Environment Variables
  • Getting Started Quickly
  • 1. Start Observability Stack
  • 2. Set Environment Variables
  • 3. Start Dynamo Components (Single GPU)
  • Alternative: Disaggregated Deployment (2 GPUs)
  • 4. Generate Traces
  • 5. View Traces in Grafana Tempo
  • Example Trace View
  • 6. Stop Services
  • Kubernetes Deployment
  • Modify DynamoGraphDeployment for Tracing
User GuidesObservability (Local)

Distributed Tracing with Tempo

||View as Markdown|
Previous

Dynamo Health Checks

Next

Dynamo Logging

Overview

Dynamo supports OpenTelemetry-based distributed tracing for visualizing request flows across Frontend and Worker components. Traces are exported to Tempo via OTLP (OpenTelemetry Protocol) and visualized in Grafana.

Requirements: Set DYN_LOGGING_JSONL=true and OTEL_EXPORT_ENABLED=true to export traces to Tempo.

This guide covers single GPU demo setup using Docker Compose. For Kubernetes deployments, see Kubernetes Deployment.

This section has overlap with Logging of OpenTelemetry Tracing since OpenTelemetry has aspects of both logging and tracing. The tracing approach documented here is for persistent trace visualization and analysis. For short debugging sessions examining trace context directly in logs, see the Logging guide.

Environment Variables

VariableDescriptionDefaultExample
DYN_LOGGING_JSONLEnable JSONL logging format (required for tracing)falsetrue
OTEL_EXPORT_ENABLEDEnable OTLP trace exportfalsetrue
OTEL_EXPORTER_OTLP_TRACES_ENDPOINTOTLP gRPC endpoint for Tempohttp://localhost:4317http://tempo:4317
OTEL_SERVICE_NAMEService name for identifying componentsdynamodynamo-frontend

Getting Started Quickly

1. Start Observability Stack

Start the observability stack (Prometheus, Grafana, Tempo, exporters). See Observability Getting Started for instructions.

2. Set Environment Variables

Configure Dynamo components to export traces:

$# Enable JSONL logging and tracing
$export DYN_LOGGING_JSONL=true
$export OTEL_EXPORT_ENABLED=true
$export OTEL_EXPORTER_OTLP_TRACES_ENDPOINT=http://localhost:4317

3. Start Dynamo Components (Single GPU)

For a simple single-GPU deployment, start the frontend and a single vLLM worker:

$# Start the frontend with tracing enabled (default port 8000, override with --http-port or DYN_HTTP_PORT env var)
$export OTEL_SERVICE_NAME=dynamo-frontend
$python -m dynamo.frontend --router-mode kv &
$
$# Start a single vLLM worker (aggregated prefill and decode)
$export OTEL_SERVICE_NAME=dynamo-worker-vllm
$python -m dynamo.vllm --model Qwen/Qwen3-0.6B --enforce-eager \
>--otlp-traces-endpoint="$OTEL_EXPORTER_OTLP_TRACES_ENDPOINT" &
$
$wait

This runs both prefill and decode on the same GPU, providing a simpler setup for testing tracing.

Alternative: Disaggregated Deployment (2 GPUs)

Run the vLLM disaggregated script with tracing enabled:

$# Navigate to vLLM launch directory
$cd examples/backends/vllm/launch
$
$# Export tracing env vars, then run the disaggregated deployment script.
$./disagg.sh

disagg.sh sets additional per-worker port environment variables (e.g., DYN_VLLM_KV_EVENT_PORT, VLLM_NIXL_SIDE_CHANNEL_PORT) to avoid ZMQ “Address already in use” conflicts when multiple workers run on the same host. If you run the components manually, make sure you mirror those port settings.

$#!/bin/bash
$set -e
$trap 'echo Cleaning up...; kill 0' EXIT
$
$# Enable tracing
$export DYN_LOGGING_JSONL=true
$export OTEL_EXPORT_ENABLED=true
$export OTEL_EXPORTER_OTLP_TRACES_ENDPOINT=http://localhost:4317
$
$# Run frontend (default port 8000, override with --http-port or DYN_HTTP_PORT env var)
$export OTEL_SERVICE_NAME=dynamo-frontend
$python -m dynamo.frontend --router-mode kv &
$
$# Run decode/ingress worker (make sure to wait for start up)
$export OTEL_SERVICE_NAME=dynamo-worker-decode
$DYN_SYSTEM_PORT=8081 CUDA_VISIBLE_DEVICES=0 python3 -m dynamo.vllm \
> --model Qwen/Qwen3-0.6B \
> --enforce-eager \
> --otlp-traces-endpoint="$OTEL_EXPORTER_OTLP_TRACES_ENDPOINT" &
$
$# Run prefill worker, make sure to wait for start up
$export OTEL_SERVICE_NAME=dynamo-worker-prefill
$DYN_SYSTEM_PORT=8082 \
>DYN_VLLM_KV_EVENT_PORT=20081 \
>VLLM_NIXL_SIDE_CHANNEL_PORT=20097 \
>CUDA_VISIBLE_DEVICES=1 python3 -m dynamo.vllm \
> --model Qwen/Qwen3-0.6B \
> --enforce-eager \
> --otlp-traces-endpoint="$OTEL_EXPORTER_OTLP_TRACES_ENDPOINT" \
> --is-prefill-worker &

For disaggregated deployments, this separates prefill and decode onto different GPUs for better resource utilization.

4. Generate Traces

Send requests to the frontend to generate traces (works for both aggregated and disaggregated deployments). Note the x-request-id header, which allows you to easily search for and correlate this specific trace in Grafana:

$curl -H 'Content-Type: application/json' \
>-H 'x-request-id: test-trace-001' \
>-d '{
> "model": "Qwen/Qwen3-0.6B",
> "max_completion_tokens": 100,
> "messages": [
> {"role": "user", "content": "What is the capital of France?"}
> ]
>}' \
>http://localhost:8000/v1/chat/completions

5. View Traces in Grafana Tempo

  1. Open Grafana at http://localhost:3000
  2. Login with username dynamo and password dynamo
  3. Navigate to Explore (compass icon in the left sidebar)
  4. Select Tempo as the data source (should be selected by default)
  5. In the query type, select “Search” (not TraceQL, not Service Graph)
  6. Use the Search tab to find traces:
    • Search by Service Name (e.g., dynamo-frontend)
    • Search by Span Name (e.g., http-request, handle_payload)
    • Search by Tags (e.g., x_request_id=test-trace-001)
  7. Click on a trace to view the detailed flame graph

Example Trace View

Below is an example of what a trace looks like in Grafana Tempo:
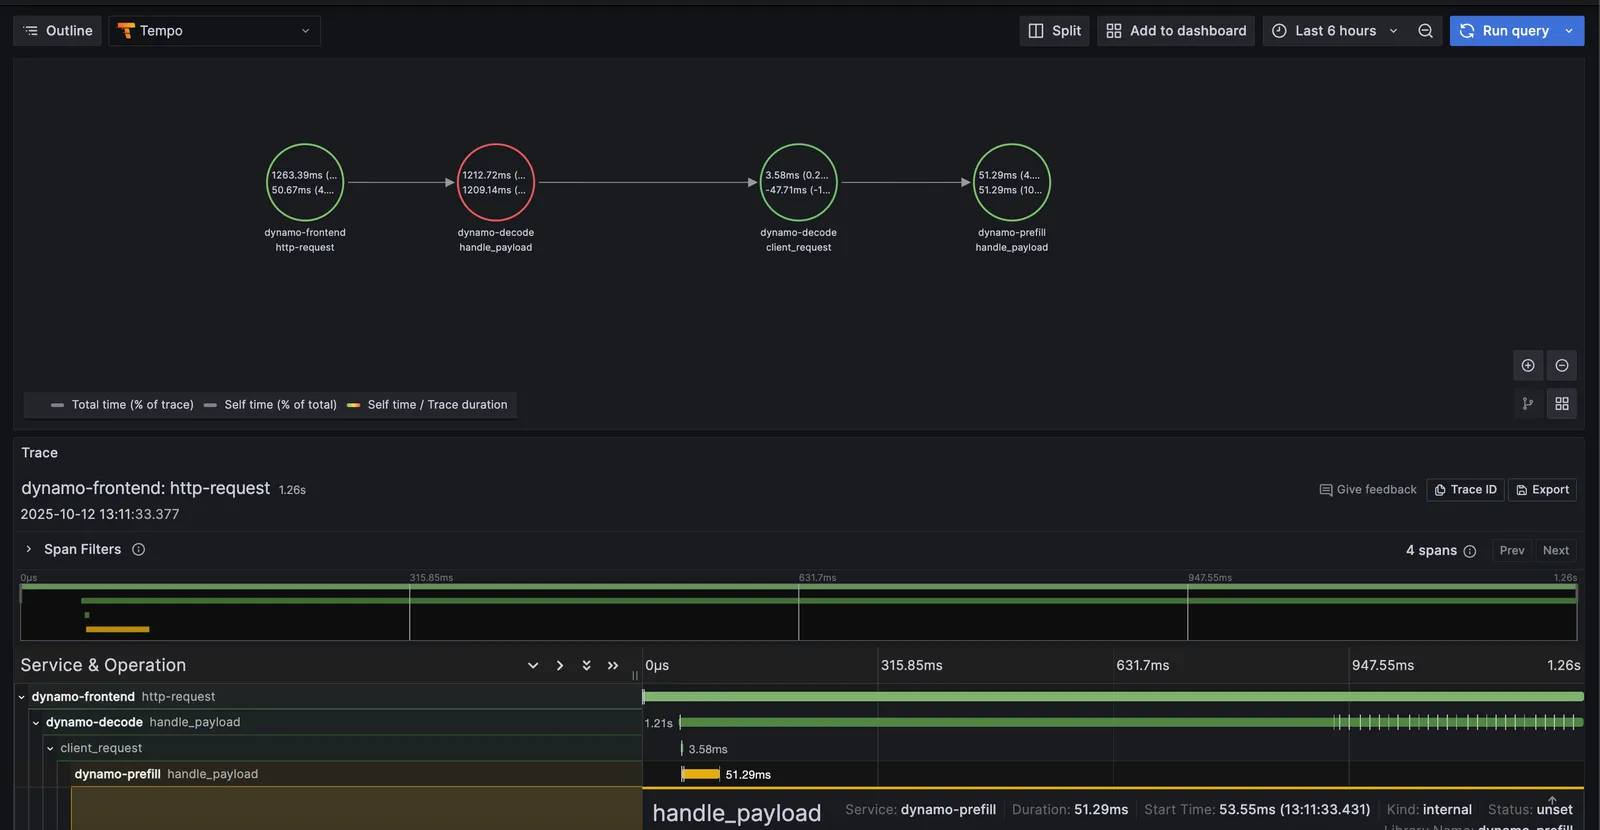
Trace Example

6. Stop Services

When done, stop the observability stack. See Observability Getting Started for Docker Compose commands.


Kubernetes Deployment

For Kubernetes deployments, ensure you have a Tempo instance deployed and accessible (e.g., http://tempo.observability.svc.cluster.local:4317).

Modify DynamoGraphDeployment for Tracing

Add common tracing environment variables at the top level and service-specific names in each component in your DynamoGraphDeployment (e.g., examples/backends/vllm/deploy/disagg.yaml):

1apiVersion: nvidia.com/v1alpha1
2kind: DynamoGraphDeployment
3metadata:
4 name: vllm-disagg
5spec:
6 # Common environment variables for all services
7 env:
8 - name: DYN_LOGGING_JSONL
9 value: "true"
10 - name: OTEL_EXPORT_ENABLED
11 value: "true"
12 - name: OTEL_EXPORTER_OTLP_TRACES_ENDPOINT
13 value: "http://tempo.observability.svc.cluster.local:4317"
14
15 services:
16 Frontend:
17 # ... existing configuration ...
18 extraPodSpec:
19 mainContainer:
20 # ... existing configuration ...
21 env:
22 - name: OTEL_SERVICE_NAME
23 value: "dynamo-frontend"
24
25 VllmDecodeWorker:
26 # ... existing configuration ...
27 extraPodSpec:
28 mainContainer:
29 # ... existing configuration ...
30 env:
31 - name: OTEL_SERVICE_NAME
32 value: "dynamo-worker-decode"
33
34 VllmPrefillWorker:
35 # ... existing configuration ...
36 extraPodSpec:
37 mainContainer:
38 # ... existing configuration ...
39 env:
40 - name: OTEL_SERVICE_NAME
41 value: "dynamo-worker-prefill"

Apply the updated DynamoGraphDeployment:

$kubectl apply -f examples/backends/vllm/deploy/disagg.yaml

Traces will now be exported to Tempo and can be viewed in Grafana.