

Dynamo Logging
Overview
Dynamo provides structured logging in both text as well as JSONL. When
JSONL is enabled logs additionally contain span creation and exit
events as well as support for trace_id and span_id fields for
distributed tracing.
Environment Variables
Getting Started Quickly
Start Observability Stack
For collecting and visualizing logs with Grafana Loki (Kubernetes), or viewing trace context in logs alongside Grafana Tempo, start the observability stack. See Observability Getting Started for instructions.
Enable Structured Logging
Enable structured JSONL logging:
Logs will be written to stderr in JSONL format with trace context.
Available Logging Levels
Example Readable Format
Environment Setting:
Resulting Log format:
Example JSONL Format
Environment Setting:
Resulting Log format:
Logging of Trace and Span IDs
When DYN_LOGGING_JSONL is enabled, all logs include trace_id and span_id fields, and spans are automatically created for requests. This is useful for short debugging sessions where you want to examine trace context in logs without setting up a full tracing backend and for correlating log messages with traces.
The trace and span information uses the OpenTelemetry format and libraries, which means the IDs are compatible with OpenTelemetry-based tracing backends like Tempo or Jaeger if you later choose to enable trace export.
This section has overlap with Distributed Tracing with Tempo. For trace visualization in Grafana Tempo and persistent trace analysis, see Distributed Tracing with Tempo.
Configuration for Logging
To see trace information in logs:
This enables JSONL logging with trace_id and span_id fields. Traces appear in logs but are not exported to any backend.
Example Request
Send a request to generate logs with trace context:
Check the logs (stderr) for JSONL output containing trace_id, span_id, and x_request_id fields.
Trace and Span Information in Logs
This section shows how trace and span information appears in JSONL logs. These logs can be used to understand request flows even without a trace visualization backend.
Example Disaggregated Trace in Grafana
When viewing the corresponding trace in Grafana, you should be able to see something like the following:
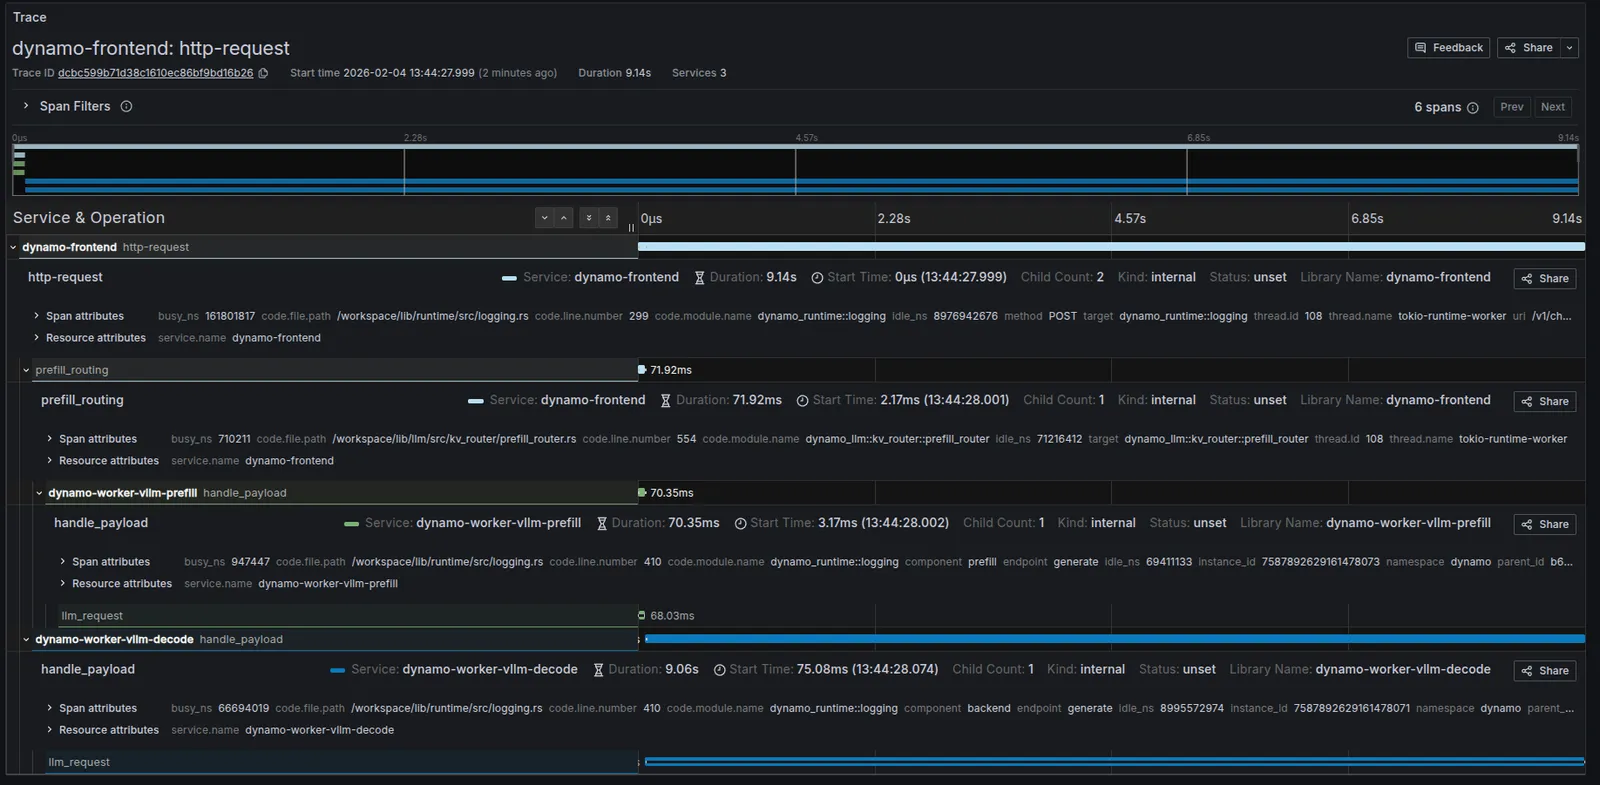
Trace Overview
Root Span (Frontend): http-request
Child Span (Prefill): handle_payload
Child Span (Decode): handle_payload
Frontend Logs with Trace Context
The following shows the JSONL logs from the frontend service for the same request. Note the trace_id field (b672ccf48683b392891c5cb4163d4b51) that correlates all logs for this request, and the span_id field that identifies individual operations:
Custom Request IDs in Logs
You can provide a custom request ID using the x-request-id header. This ID will be attached to all spans and logs for that request, making it easier to correlate traces with application-level request tracking.
Example Request with Custom Request ID
All spans and logs for this request will include the x_request_id attribute with value 8372eac7-5f43-4d76-beca-0a94cfb311d0.
Frontend Logs with Custom Request ID
Notice how the x_request_id field appears in all log entries, alongside the trace_id (80196f3e3a6fdf06d23bb9ada3788518) and span_id: