

Observability
This guide covers metrics, tracing, and visualization for SGLang deployments running through Dynamo.
Prometheus Metrics
When running SGLang through Dynamo, SGLang engine metrics are automatically passed through and exposed on Dynamo’s /metrics endpoint (default port 8081). This allows you to access both SGLang engine metrics (prefixed with sglang:) and Dynamo runtime metrics (prefixed with dynamo_*) from a single worker backend endpoint.
For the complete and authoritative list of all SGLang metrics, always refer to the official SGLang Production Metrics documentation.
For Dynamo runtime metrics, see the Dynamo Metrics Guide.
For visualization setup instructions, see the Prometheus and Grafana Setup Guide.
Environment Variables
Getting Started Quickly
This is a single machine example.
Start Observability Stack
For visualizing metrics with Prometheus and Grafana, start the observability stack. See Observability Getting Started for instructions.
Launch Dynamo Components
Launch a frontend and SGLang backend to test metrics:
Wait for the SGLang worker to start, then send requests and check metrics:
Exposed Metrics
SGLang exposes metrics in Prometheus Exposition Format text at the /metrics HTTP endpoint. All SGLang engine metrics use the sglang: prefix and include labels (e.g., model_name, engine_type, tp_rank, pp_rank) to identify the source.
Example Prometheus Exposition Format text:
Note: The specific metrics shown above are examples and may vary depending on your SGLang version. Always inspect your actual /metrics endpoint or refer to the official documentation for the current list.
Metric Categories
SGLang provides metrics in the following categories (all prefixed with sglang:):
- Throughput metrics - Token processing rates
- Resource usage - System resource consumption
- Latency metrics - Request and token latency measurements
- Disaggregation metrics - Metrics specific to disaggregated deployments (when enabled)
Note: Specific metrics are subject to change between SGLang versions. Always refer to the official documentation or inspect the /metrics endpoint for your SGLang version.
Available Metrics
The official SGLang documentation includes complete metric definitions with:
- HELP and TYPE descriptions
- Counter, Gauge, and Histogram metric types
- Metric labels (e.g.,
model_name,engine_type,tp_rank,pp_rank) - Setup guide for Prometheus + Grafana monitoring
- Troubleshooting tips and configuration examples
For the complete and authoritative list of all SGLang metrics, see the official SGLang Production Metrics documentation.
Implementation Details
- SGLang uses multiprocess metrics collection via
prometheus_client.multiprocess.MultiProcessCollector - Metrics are filtered by the
sglang:prefix before being exposed - The integration uses Dynamo’s
register_engine_metrics_callback()function - Metrics appear after SGLang engine initialization completes
Distributed Tracing
Dynamo propagates W3C Trace Context headers through the SGLang request pipeline, allowing you to correlate traces across the frontend, router, and individual SGLang workers in a disaggregated deployment.
Prerequisites
SGLang’s engine-internal tracing requires the opentelemetry packages. These are declared as SGLang’s [tracing] extra. Install them into your Dynamo environment:
Without these packages, Dynamo-side spans (frontend, handler) will still work, but SGLang’s internal engine spans will not be emitted and you will see a warning: "Tracing is disabled because the packages cannot be imported."
How Trace Propagation Works
Key implementation files:
components/src/dynamo/common/utils/otel_tracing.py- W3Ctraceparentheader buildercomponents/src/dynamo/sglang/request_handlers/handler_base.py:71-84- Extracts trace context from DynamoContextobjectcomponents/src/dynamo/sglang/request_handlers/llm/decode_handler.py- Passesexternal_trace_headerandrid=trace_idtoengine.async_generate()
Environment Variables
SGLang-Specific Flags
Both flags are required for end-to-end tracing through the SGLang engine. Without --enable-trace, the Dynamo handler still creates spans, but SGLang’s internal engine spans will not be linked.
Launch with Tracing
The disaggregated launch script supports --enable-otel to enable tracing across all components:
Or manually for an aggregated deployment:
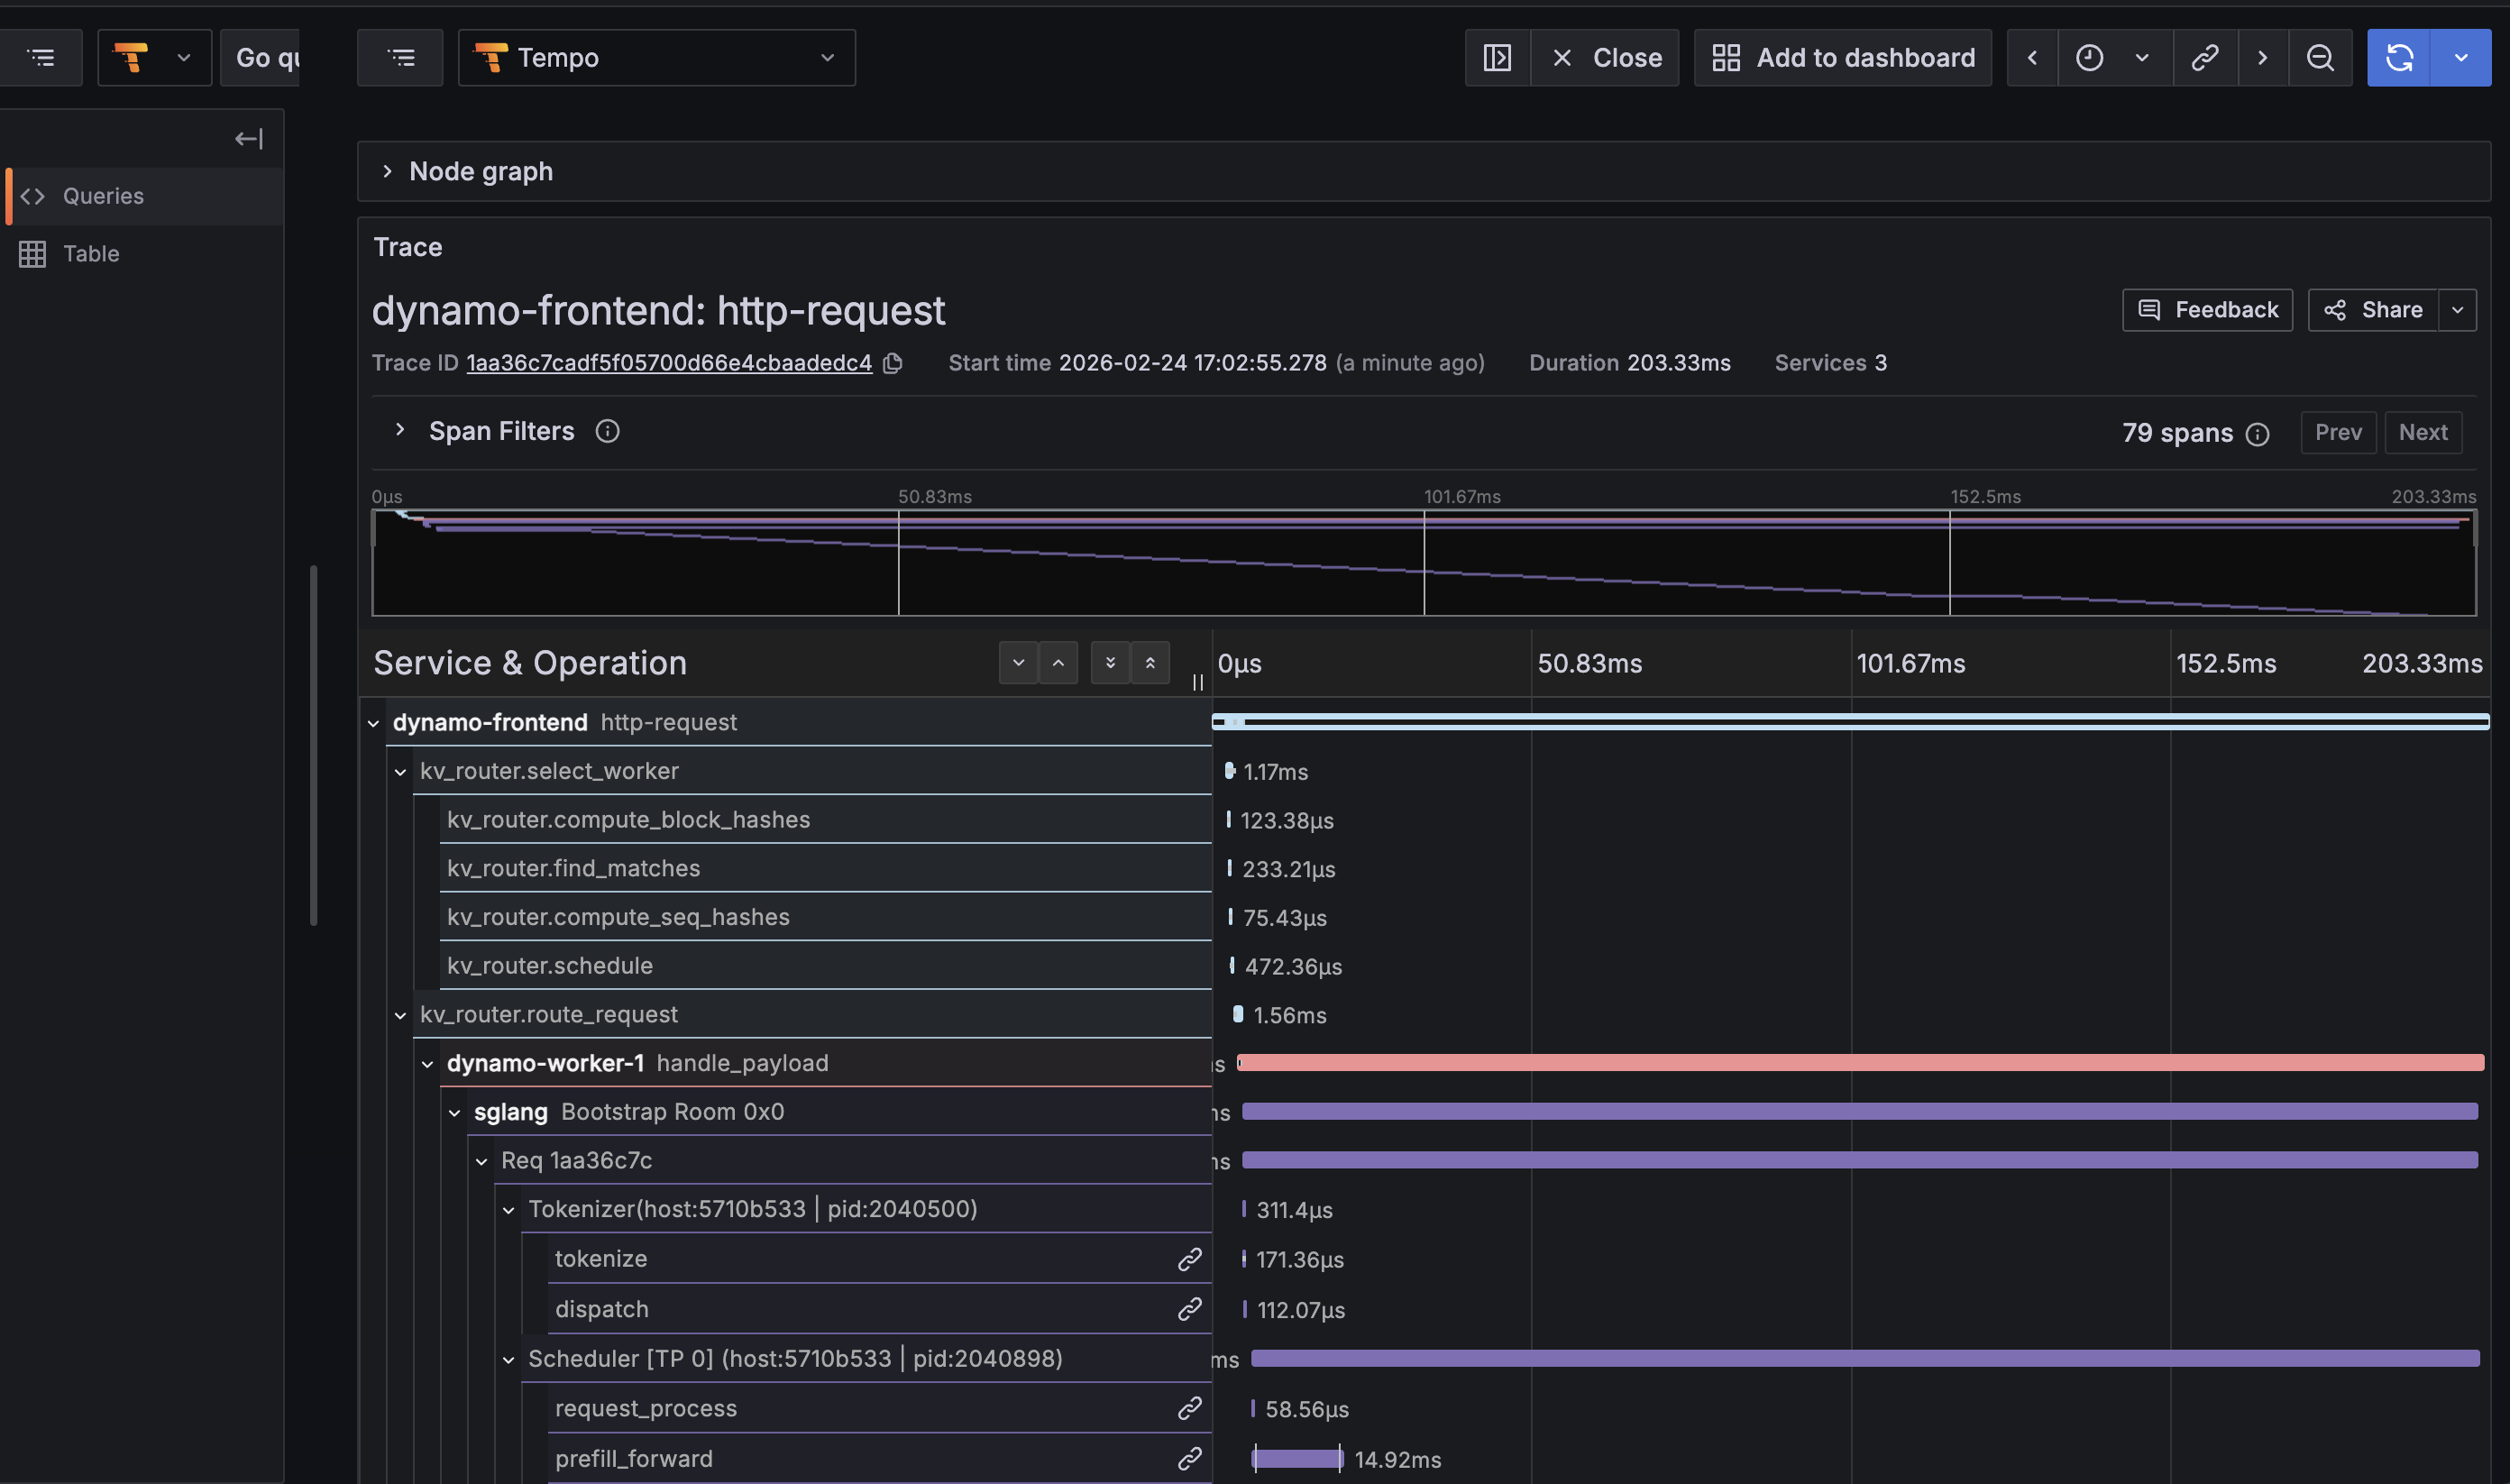
What You’ll See in Traces
With tracing enabled, each inference request produces a single end-to-end trace spanning the full request lifecycle:
- Frontend
http-requestspan - Root span from the HTTP service, includes method/uri/trace_id - KV Router spans -
kv_router.route_request,kv_router.select_worker,kv_router.compute_block_hashes,kv_router.find_matches,kv_router.compute_seq_hashes,kv_router.schedule - Worker
handle_payloadspan - The Dynamo RPC handler on the worker side, with component/endpoint/namespace labels - SGLang engine spans -
Req <id>,Scheduler,Tokenizer,request_process,prefill_forward,decode_loop,Bootstrap Room(for disagg) - Semantic conventions -
gen_ai.usage.prompt_tokens,gen_ai.usage.completion_tokens,gen_ai.latency.time_to_first_token, etc.
Example trace tree for a KV-routed request:
Viewing Traces
- Open Grafana at
http://localhost:3000(username:dynamo, password:dynamo) - Navigate to Explore (compass icon)
- Select Tempo as the data source
- Use the Search tab:
- Filter by Service Name (e.g.,
dynamo-frontend,dynamo-worker-1,sglang) - Filter by Span Name (e.g.,
http-request,handle_payload,Req *,decode_loop) - Filter by Tags (e.g.,
rid=<trace-id>,gen_ai.response.model=Qwen/Qwen3-0.6B)
- Filter by Service Name (e.g.,
- Click a trace to view the flame graph spanning frontend -> router -> worker -> engine
Send a request with x-request-id for easy lookup:
For more details on the Tempo/Grafana tracing infrastructure, see the Dynamo Tracing Guide.
SGLang Grafana Dashboard
Dynamo ships a pre-provisioned Grafana dashboard for SGLang at deploy/observability/grafana_dashboards/sglang.json. It is automatically loaded when the observability stack starts.
Dashboard Panels
The dashboard is organized into five sections:
Accessing the Dashboard
- Open Grafana at
http://localhost:3000 - Login with
dynamo/dynamo - Click Dashboards in the left sidebar
- Select SGLang Engine
Other available dashboards:
- Dynamo Dashboard (
dynamo.json) - Frontend and component metrics - DCGM Metrics (
dcgm-metrics.json) - GPU utilization, memory, power - KVBM (
kvbm.json) - KV block manager metrics - Disagg Dashboard (
disagg-dashboard.json) - Disaggregated serving metrics
Exposing on a Remote VM
When developing on a remote VM (cloud instance, bare metal, etc.), the observability ports are only bound to localhost inside the VM. You have two options to access them.
Option 1: SSH Port Forwarding (Recommended)
Forward the relevant ports through your SSH connection. No firewall changes needed, traffic is encrypted.
Then open http://localhost:3000 in your local browser.
For a long-running tunnel in the background:
Option 2: Firewall Rules
Open the ports directly. Only use this on trusted networks.
Then access http://<vm-ip>:3000 directly.
Headless / Agent Access
For CI pipelines, AI coding agents, or headless workflows where no browser is available, you can query Grafana and Prometheus directly via their APIs:
This is useful for automated benchmarking pipelines where you want to capture metrics programmatically alongside performance results.
Related Documentation
SGLang Metrics
Dynamo Observability
- Dynamo Metrics Guide - Complete documentation on Dynamo runtime metrics
- Dynamo Tracing Guide - Distributed tracing with OpenTelemetry and Tempo
- Prometheus and Grafana Setup - Visualization setup instructions
- Dynamo runtime metrics (prefixed with
dynamo_*) are available at the same/metricsendpoint alongside SGLang metrics- Implementation:
lib/runtime/src/metrics.rs(Rust runtime metrics) - Metric names:
lib/runtime/src/metrics/prometheus_names.rs(metric name constants) - Integration code:
components/src/dynamo/common/utils/prometheus.py- Prometheus utilities and callback registration
- Implementation: