Visual Language Models (VLM) with Jetson Platform Services#
Overview#
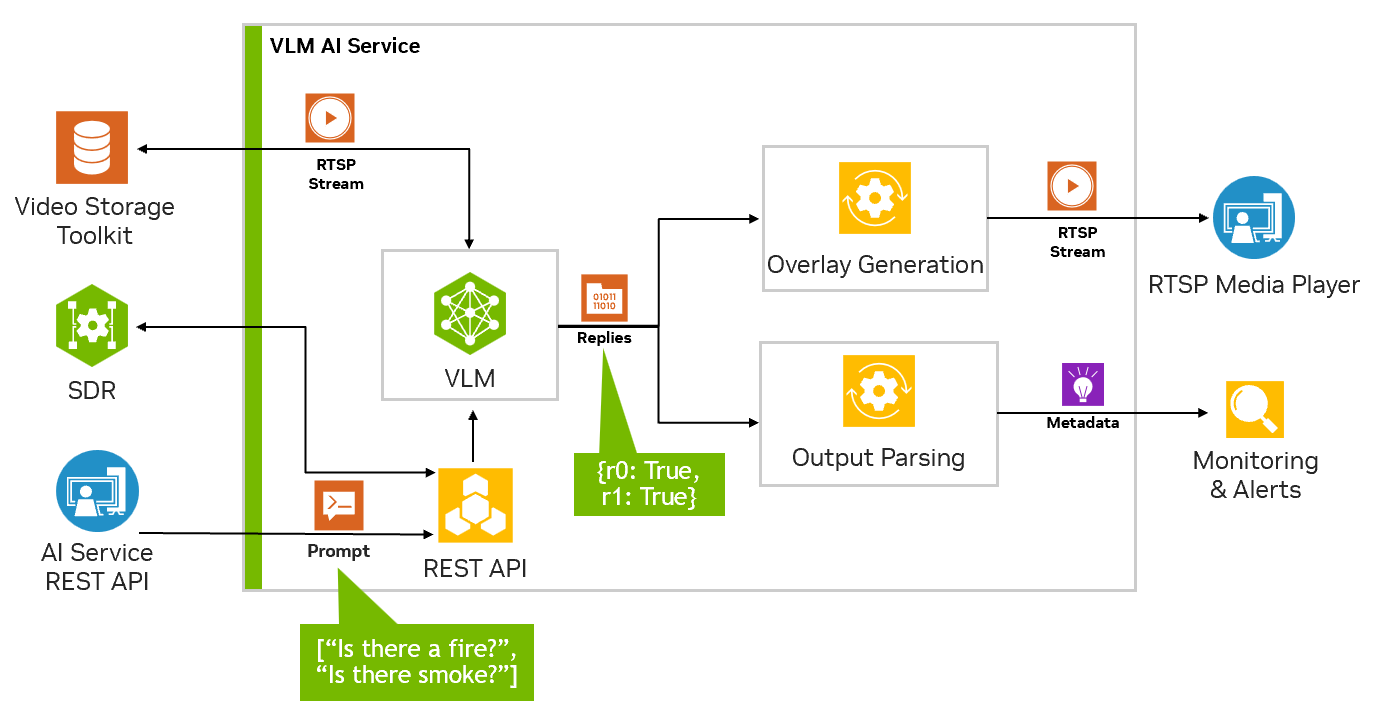
VLMs are multi modal models supporting images, video and text and using a combination of large language models and vision transformers. Based on this capability, they are able to support text prompts to query videos and images thereby enabling capabilities such as chatting with the video, and defining natural language based alerts.
The VLM AI service, enables quick deployment of VLMs with Jetson Platform Services for video insight applications. The VLM service exposes REST API endpoints to configure the video stream input, set alerts and ask questions in natural language about the input video stream.
API Endpoint |
Description |
|---|---|
/api/v1/live-stream |
Manage live streams the AI service has access to. |
/api/v1/chat/completion |
Chat with the VLM using OpenAI style chat completions. Supports referencing added streams in the prompts. |
/api/v1/alerts |
Set an alert prompt the VLM will evaluate continuously on the input live stream. Can be used to trigger notifications when alert states are true. |
Additionally, the output of the VLM can be viewed as an RTSP stream, the alert states are stored by the jetson-monitoring service and sent over a websocket to integrate with other services.
This AI service is provided as a prebuilt docker container that can be launched with docker compose. It is configured through JSON config files and integrates with the foundation services such as Jetson-monitoring and jetson-ingress. We provide example compose and configuration files for easy deployment in the reference workflow resource.
The following table summarizes how the VLM service can interact with the other Jetson Platform Services.
Service |
Required |
Notes |
|---|---|---|
jetson-ingress |
✓ |
Required to access the VLM REST APIs through the API Gateway port (30080) |
jetson-storage |
✓ |
Required in addition to an external storage device. Without it, the Jetson will likely run out storage space. |
jetson-monitoring |
✓ |
Required to track alert and VLM metrics in the Prometheus Dashboard |
jetson-firewall |
⭘ |
Recommended to be used in real deployment to restrict access to ports other than the API gateway port. |
jetson-vst |
⭘ |
Recommended to manage RTSP streams that can be used as input to the AI service |
jetson-sys-monitoring |
⭘ |
Recommended to enable to monitor system stats but not required |
jetson-gpu-monitoring |
⭘ |
Recommended to enable to monitor GPU stats but not required |
jetson-networking |
✗ |
Only needed if using VST and IP cameras with the VLM service |
jetson-redis |
✗ |
Only needed if using VST and SDR with the VLM service. |
Getting Started#
Read through the Prerequisite section carefully before getting started with this example.
Prerequisites#
First follow the Quick Start Guide to set up your system with Jetson Platform Services. It is recommended to also follow the Hello World example to get familiar with Jetson Platform Services. Before continuing, bring down any previously launched JPS examples like AI-NVR with the docker compose down command.
The VLM AI service operates on RTSP streams. The RTSP stream can come from any source such as an IP camera, the Video Storage Toolkit (VST) or NVStreamer. The fastest way to get an RTSP stream for testing is to use NVStreamer which can serve video files as an RTSP stream. To learn how to use NVStreamer to make an RTSP stream, see the NVStreamer on Jetson Orin page.
Running the VLM container will require around 50GBs of storage. The container will take 20GBs and the default model (VILA1.5 13b) will use 32.3 GBs. It is highly recommended to use the Jetson Storage service prior to running this example. The Jetson Storage service will setup an attached external storage device and remap the container storage and /data locations to the external storage. The default storage on your Jetson device will likely not have enough space to run this example with the default configuration. View the Storage page for more details.
To get the docker compose and config files, download the Jetson Platform Services resources bundle from NGC or SDK Manager. Once downloaded, find the vlm-2.0.0.tar.gz file and place it in your home directory. The following commands will assume the tar file is starting from your home directory.
cd ~/
tar -xvf vlm-2.0.0.tar.gz
cd ~/vlm/example_1
The VLM AI service will use the jetson-ingress and jetson-monitoring services. These two services need to be configured to integrate with the VLM AI service. Copy the provided default configurations to the appropriate service configuration directory.
sudo cp config/vlm-nginx.conf /opt/nvidia/jetson/services/ingress/config
sudo cp config/prometheus.yml /opt/nvidia/jetson/services/monitoring/config/prometheus.yml
sudo cp config/rules.yml /opt/nvidia/jetson/services/monitoring/config/rules.yml
Then start the foundation services.
sudo systemctl start jetson-ingress
sudo systemctl start jetson-monitoring
sudo systemctl start jetson-sys-monitoring
sudo systemctl start jetson-gpu-monitoring
Note
If any of the foundation services were previously launched then use the ‘restart’ command instead of ‘start’.
Now deploy the VLM AI Service!
sudo docker compose up -d
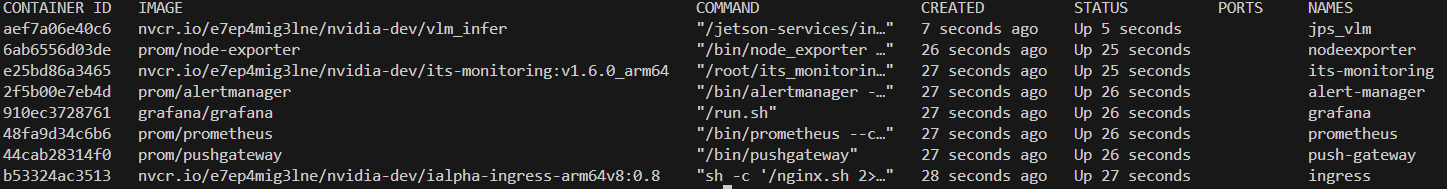
To check if all the necessary containers have started up, you can run the following command:
sudo docker ps
The output should look similar to the following image.
Note
The first time the VLM service is launched, it will automatically download and quantize the VLM. This will take some time. If deploying on Orin NX16, it may be necessary to mount more SWAP as quantization of the model can use significant memory. For more details see the following section VLM Model Fails to Load.
To verify the VLM has launched properly, you can check the health endpoint of the VLM service. In a web browser you can visit the page http://0.0.0.0:5015/v1/health. If the VLM is ready it will return {“detail”:”ready”}. If you are launching the VLM for the first time it will take some time to fully load.
Interact with VLM Service#
Now we can interact with the VLM service is several ways:
Control Stream Input via REST APIs
You can start by adding an RTSP stream for the VLM to use with the following curl command. This will use the POST method on the live-stream endpoint.
Currently the VLM will only support 1 stream but in the future this API will allow for multi-stream support.
Replace 0.0.0.0 with your Jetson IP and replace the RTSP link with your RTSP link.
curl --location 'http://0.0.0.0:5010/api/v1/live-stream' \
--header 'Content-Type: application/json' \
--data '{
"liveStreamUrl": "rtsp://0.0.0.0:31554/nvstream/root/store/nvstreamer_videos/video.mp4"
}'
Note
In addition to the curl commands, the REST APIs can also be tested directly through the API documentation page that is served at http://0.0.0.0:5010/docs when the VLM service is brought up.
This request will return a unique stream ID that is used later to set alerts and ask follow up questions and remove the stream.
{
    "id": "a782e200-eb48-4d17-a1b9-5ac0696217f7"
}
You can also use the GET method on the live-stream endpoint to list the added streams and their IDs:
curl --location 'http://0.0.0.0:5010/api/v1/live-stream'
[
    {
        "id": "a782e200-eb48-4d17-a1b9-5ac0696217f7",
        "liveStreamUrl": "rtsp://0.0.0.0:31554/nvstream/root/store/nvstreamer_videos/video.mp4"
    }
]
Set Alerts
Alerts are questions that the VLM will continuously evaluate on the live stream input. For each alert rule set, the VLM will try to decide if it is True or False based on the most recent frame from of the live stream. These True and False states as determined by the VLM, are sent to a websocket and the jetson monitoring service.
When setting alerts, the alert rule should be phrased as a yes/no question. Such as “Is there fire?” or “Is there smoke?”. The body of the request must also have the “id” field that corresponds to the stream ID that was returned when the RTSP stream was added.
By default, the VLM service supports up to 10 alert rules. This can be increased by adjusting the configuration files.
curl --location 'http://0.0.0.0:5010/api/v1/alerts' \
--header 'Content-Type: application/json' \
--data '{
   "alerts": ["is there a fire?", "is there smoke?"],
   "id": "a782e200-eb48-4d17-a1b9-5ac0696217f7"
}'
Once the alert is added you should see the overlay output generated on the RTSP output stream.
View RTSP Stream Output
Once a stream is added, it will be passed through to the output RTSP stream. You can view this stream at rtsp://0.0.0.0:5011/out. Once a query or alert is added, we can view the VLM responses on this output stream.
View Alert Status in Prometheus
The True/False states of the alerts are sent to the Jetson Monitoring service which is based on Prometheus. You can view the raw metrics at http://0.0.0.0:5012 these metrics are then scraped by Prometheus and saved as time series data. This is viewable on the Prometheus Dashboard at http://0.0.0.0:9090
Ask Follow up Questions
In addition to setting alerts, you can also ask open ended questions to the VLM using the chat completions endpoint. The chat completions endpoint is similar to the OpenAI chat completions API with additional support for referencing a live stream in your prompt.
When a stream is referenced in the prompt, it will attach the most recent frame from the live stream and pass it to the VLM to be used to complete the chat.
To ask a follow up question about the live stream for example, you can submit the following curl command:
curl --location 'http://0.0.0.0:5010/api/v1/chat/completions' \
--header 'Content-Type: application/json' \
--data '{
   "messages": [
       {
           "role": "system",
           "content": "You are a helpful AI assistant."

       },
       {
           "role": "user",
           "content":[
               {
                   "type": "stream",
                   "stream":
                   {
                       "stream_id": "a782e200-eb48-4d17-a1b9-5ac0696217f7"
                   }
               },

               {
                   "type":"text",
                   "text": "Can you describe the scene?"
               }
           ]
       }
   ],
   "min_tokens": 1,
   "max_tokens": 128
}
'
Note how the user message references the stream content type and then follows up with the text content type with the user’s question. The VILA models work best when the stream reference occurs before the text content.
The chat completions endpoint will return the following:
{
    "choices": [
        {
            "index": 0,
            "message": {
                "role": "assistant",
                "content": "The scene is a beautiful mountain range."
            }
        }
    ]
}
Note that if the system is rebooted while the container is running, it will automatically come back up but the added streams and alerts will not persist. They will need to be added again. For streams to persist across reboots, the AI service can be combined with SDR as shown in the Zero Shot Detection Workflow page.
Shut Down
To shut down the example you can first remove the stream using a DELETE method on the live-stream endpoint. Note the stream ID is added to the URL path for this.
curl --location --request DELETE 'http://0.0.0.0:5010/api/v1/live-stream/a782e200-eb48-4d17-a1b9-5ac0696217f7'
Then from the same folder as the compose.yaml file used to launch the example run
sudo docker compose down
To summarize, this section covered how to launch the VLM AI service and then interact with it through the REST APIs and view the RTSP outputs and alert states in Prometheus.
Here is a summary of useful addresses when interacting with the VLM service.
Access points for the VLM Service
Name |
Local URI |
API Gateway URI |
Description |
|---|---|---|---|
REST API Docs |
Documentation for VLM AI Service REST API |
||
REST API |
Control REST API for VLM AI Service |
||
Web Socket Alerts |
ws://0.0.0.0:5016/api/v1/alerts/ws |
ws://0.0.0.0:30080/ws-vlm/api/v1/alerts/ws |
Web Socket that will output Alerts when the VLM determines it is True. |
RTSP output |
Overlay output of VLM |
||
Prometheus Alert Metrics |
Alert metrics exposed by VLM AI Service scraped by Prometheus |
||
Prometheus inference Metrics |
VLM inference metrics such as token count, decode rate, decode time etc. scraped by Prometheus |
||
Prometheus Dashboard |
Dashboard to view Prometheus Alerts and Metrics. Launched by the jetson-monitoring service. |
Configuration#
All configuration files can be found under the ~/vlm/example_1/config directory. The configuration options available are split into two categories.
VLM Service configuration
chat_server_config.json
main_config.json
foundation Service Configuration
prometheus.yml
rules.yml
vlm-nginx.conf
AI Service configurations are JSON formatted files and are assumed to be in a folder named config by the AI service. This config folder must be placed in the same directory as the compose.yaml file that is used to launch the AI service.
The foundation service configurations found in the config directory are for reference only and must be copied into the appropriate foundation service configuration folder found under /opt/nvidia/jetson/services to take effect. The respective service must be restarted with systemctl after adjusting the config for changes to take effect.
chat_server_config.json
The chat_server_config.json configures the chat server which loads and runs the VLM model using an OpenAI like REST API interface. The VLM model can also be adjusted in this configuration file. When you change the model, restart the service and it will automatically download and quantize the new model.
{
    "api_server_port": 5015,
    "prometheus_port": 5017,
    "model": "Efficient-Large-Model/VILA1.5-13b",
    "log_level": "INFO",
    "print_stats": true
}
Key |
Value Type |
Value Example |
Description |
Notes |
|---|---|---|---|---|
“api_server_port” |
int |
5015 |
port the main pipeline will expose its REST APIs for stream and model control |
|
“prometheus_port” |
int |
5017 |
port to output model statistics for prometheus |
Includes metrics like embedding time, decode time, decode rate and more. |
“model” |
str |
“Efficient-Large-Model/VILA-13b” |
Huggingface path or local path to VLM model |
See table below for supported model keys. |
“log_level” |
str |
“INFO” |
Python based log level |
Supported Values: [“DEBUG”, “INFO”, “WARNING”, “ERROR”, “CRITICAL”] |
“print_stats” |
bool |
true |
true/false value to enable printing VLM statistics |
The VILA and LLaVA family of models are currently supported.
Model |
Configuration Key |
Storage Required (GBs) |
|---|---|---|
“Efficient-Large-Model/VILA-2.7b” |
7.1 |
|
“Efficient-Large-Model/VILA-7b” |
17.3 |
|
“Efficient-Large-Model/VILA-13b” |
31.2 |
|
“Efficient-Large-Model/VILA1.5-3b” |
7.3 |
|
“Efficient-Large-Model/Llama-3-VILA1.5-8B” |
19.9 |
|
“Efficient-Large-Model/VILA1.5-13b” |
32.3 |
|
“liuhaotian/llava-v1.5-7b” |
17.3 |
|
“liuhaotian/llava-v1.5-13b” |
31.2 |
main_config.json
The main_config.json configures the streaming pipeline that will evaluate the stream input on the VLM and expose a REST API to configure the stream input, alert rules and queries.
{
    "api_server_port": 5010,
    "prometheus_port": 5012,
    "websocket_server_port":5016,
    "stream_output": "rtsp://0.0.0.0:5011/out",
    "chat_server": "http://0.0.0.0:5015",
    "alert_system_prompt": "You are an AI assistant whose job is to evaluate a yes/no question on an image. Your response must be accurate and based on the image and MUST be 'yes' or 'no'. Do not respond with any numbers.",
    "max_alerts": 10,
    "alert_cooldown": 60,
    "log_level": "INFO",
    "multi_frame_input": 8,
    "multi_frame_input_time": 1000
}
Key |
Value Type |
Value Example |
Description |
Notes |
|---|---|---|---|---|
“api_server_port” |
int |
5010 |
port the main pipeline will expose its REST APIs for stream and model control |
|
“prometheus_port” |
int |
5012 |
port the alert metrics for prometheus are available |
|
“websocket_server_port” |
int |
5016 |
port the websocket for alert events will be available |
|
“stream_output” |
str |
output URI of the RTSP stream generated by the AI service. |
||
“chat_server” |
str |
URI of the internal chat server for the main pipeline to access the VLM |
||
“alert_system_prompt” |
str |
“You are an AI assistant whose job is to evaluate a yes/no question on an image. “ |
The VLM system prompt to be used when evaluating alert rules |
|
“max_alerts” |
str |
10 |
Number of supported alerts |
If changed, must update the rules.yml |
“alert_cooldown” |
int |
60 |
Cool down period for alerts being sent out on the websocket. |
For example, if set to 60 then an alert that is true over multiple frames will only send out 1 alert event on the websocket at most every 60 seconds. |
“log_level” |
str |
“INFO” |
Python based log level |
Supported Values: [“DEBUG”, “INFO”, “WARNING”, “ERROR”, “CRITICAL”] |
“multi_frame_input” |
int |
8 |
The number of frames used from the live stream per VLM call for alerts and chat. |
Supported Values: [1,8]. Higher number of frames gives the VLM temporal context but will take longer to process. |
“multi_frame_input_time” |
int |
1000 |
The length of time to sample frames used in each VLM call |
Value must be great than or equal to 0. The units are in milliseconds. |
The multi_frame options allow the VLM to answer chat and alerts based on several frames from the input live stream sampled over a set period of time. This is useful when temporal understanding is required. For example, describing the movement of a car from a traffic camera is impossible from a single frame but if the VLM looks at 8 frames sampled over five seconds then it can describe how the vehicle moved during that five second interval. The pipeline stores a buffer configured by the multi_frame_input option. This buffer is continuously updated from the live stream and sampled across the multi_frame_input_time configuration. For example, if the multi_frame_input is set to 5 and multi_frame_input_time is set to 5000, then the pipeline will keep a rolling buffer of 5 frames that is updated once per second (5000 ms / 5). This way as soon as a request is sent for an alert or a chat, this buffer with the desired number of frames is forwarded to the VLM to along with the user prompt to generate a response. There is additional overhead for the VLM to process more frames so if temporal understanding is not required for the use case (such as simple detections like fire or smoke) then it is recommended to set the multi_frame_input to 1. If temporal understanding is needed, then for Orin Nano and NX8 it is recommended to only go up to 4 frames or there will be long latency when generating the responses. For NX16 and AGX, 8 frames is recommended to maximize temporal understanding of the VLM. This value can be adjusted to trade off performance and temporal understanding of the VLM.
Foundation Service Configuration
prometheus.yml
rules.yml
vlm-nginx.conf
The prometheus.yml and rules.yml are used to configure the jetson-monitoring service for tracking the VLM alert evaluations. The documentation for jetson-monitoring is available in Monitoring
The vlm-nginx.conf is used to configure the jetson-ingress service (API Gateway) to route HTTP traffic to the VLM service. The documentation for jetson-ingress is available in API Gateway (Ingress)
VLM Service Integration#
The VLM service can be integrated with other parts of Jetson Platform services to build a full end to end workflow for video monitoring. To read more about the full workflow and how the VLM service can integrate with VST, SDR, Cloud and the mobile app go to the VLM Workflow page.
Further Reading#
To understand more about the VLM AI service, view open the source code on the jetson-platform-services repository. Support for VLM on Jetson comes from the NanoLLM project. Benchmarks and other generative AI examples on Jetson can be found on at the Jetson AI Lab.
Troubleshooting#
VLM Model Fails to Load#
The first time the VLM AI service is launched, it will download both the container and VLM model. This is around 50GBs in size with the default configuration.
Ensure your Jetson has a stable internet connection to complete the download. The download time will depend on your network speed.
Once the container and model has downloaded, it will automatically quantize and optimize the model for Jetson. This is a one time process that takes 10-20 minutes and will use up to 32GBs of memory for the largest model (13b).
You must ensure the total available virtual memory of your Jetson is at least 32GB. (physical memory + swap).
For example, NX16 needs an additional 8GBs of SWAP to get past the quantization stage (16GB physical Memory + 8GB default swap + 8GB additional swap). If you have a /data drive you can run the following commands to mount more swap.
sudo fallocate -l 8G /data/8GB.swap
sudo mkswap /data/8GB.swap
sudo swapon /data/8GB.swap
After mounting the additional swap space, you can launch the VLM service container to download and quantize the model.
If you reboot your Jetson and still require the additional swap space, then you will need to run the swapon command again.
When the model is done quantizing, if you want to reclaim the disk space used by swap then you can run the following:
sudo swapoff /data/8GB.swap
sudo rm /data/8GB.swap
Managing the Container#
Once the VLM service container is launched, if it hits any issues it can be manually restarted by running the following commands from the same folder as the docker compose file:
sudo docker compose down
sudo docker compose up -d
It can also be killed by running:
sudo docker kill jps_vlm
If the container has an update available, then download the latest from NGC.
System Warnings#
When running the VLM service with an alert, it will use significant resources. This may cause your Jetson to show warnings such as “System throttled due to over-current”. This is expected when running at the maximum power mode.
It is recommended to set your Jetson fans to maximum for extra cooling. This can be done with the jetson_clocks command:
sudo jetson_clocks --fan
If you would like to reduce the power consumption or heat production further, this can be done by controlling the power mode with the nvpmodel command.
sudo nvpmodel --help