AI-NVR Mobile Application User Guide#
Overview#
AI-NVR Android app enables users to access the full AI Gateway box functionality, including:
Live and recorded real-time video streaming from the AI-NVR device.
‘Gem’ creation (tripwire count, region of interest count, and field of view count)
Gem output visualized as graphs
Video and gem synchronization.
Gem-based alerts
Salient features of the mobile app include:
Connect directly to the AI-NVR device
Retrieve list of connected cameras.
Play several live and recorded video streams from cameras simultaneously
Fast forward/rewind to specific time.
Enable tripwire and region of interest creation by selecting anchor points on video screen and defining triggers for alerts.
Observe existing tripwires and region of interests configured for a camera.
Browse through gem events.
Installation#
The mobile app is recommended to be run on Android phones running Target Version SDK 33 (Android 13), but it is supposed to work from Target Version SDK 26 (Android 8). We have tested the app on the Samsung A22 phone. Phones with similar or better specs is recommended.
The mobile app is distributed by NVIDIA through the Google Play Store.
Setup#
The mobile app has two launcher entry points. One is for direct access to the AI-NVR device, and one is for remote access to the device through the cloud. Open the app to launch the first-time provisioning process. Remote access to the device through the cloud is not available in this release.
Direct device access#
The device is accessed directly from the mobile app using device IP address. Device access will be based on <device ip>:port rather than through the cloud endpoint. You will be presented with a dialog window to enter the IP address of the device.
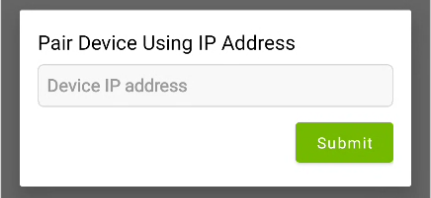
Once the IP address is submitted, the app will launch the UI with the list of cameras connected to the device. You can switch to a new device from Settings -> Switch Device.
Usage#
Mobile Software Camera Feed#
Application consists of 4 separate panes selectable at its bottom.
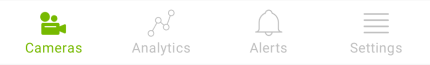
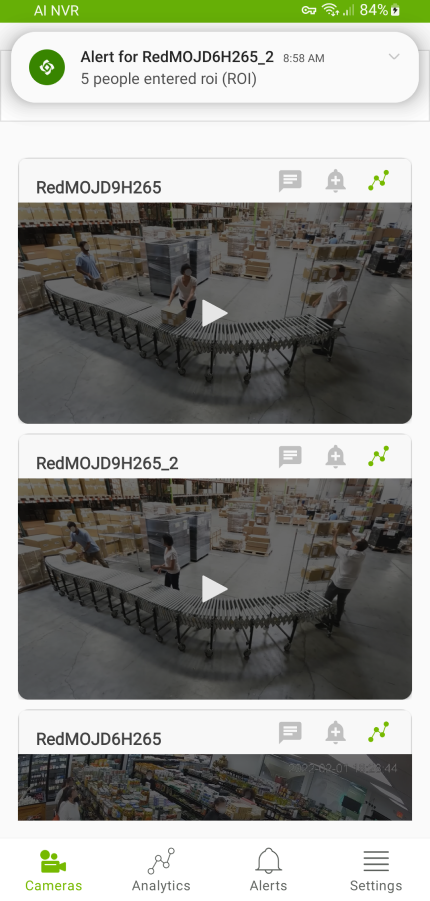
Tapping on Cameras brings up the Camera Feed pane. You can view up to 8 camera, or RTSP, feeds. Scroll up and down to see all the feeds. Tap on ‘Play’ triangle to start feed streaming.

Field-of-View Count#
Tap on the icon above the upper right corner of the video feed to open analytics view for a single camera.
You will see screen similar to the following one.
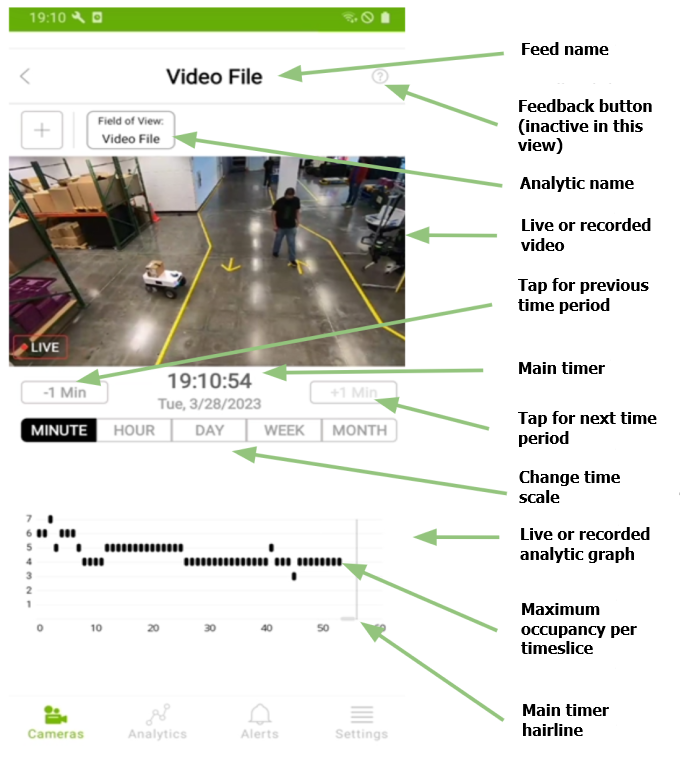
As you observe the video playing, the data graph underneath advances rightwards and reflects the count of people visible in the video. By default - every one second, with horizontal axis scale set to 60 seconds.
The vertical hairline moves towards the right in sync with the main timer. Once the time scale elapses, the hairline disappears on the right, and reappears on the left - thus commencing the new time scale interval (next minute in the example above).
Time scale can be changed to 1 hour, 1 day, 1 week or 1 month, with integration time of 1 minute, 1 hour, 1 day and 1 day again, respectively. Black spots report the highest people count observed during integration time. The graph with integration time of one second reports the highest count observed during one second (image above). The graph with integration time set to one minute reports the highest count observed during one minute (each minute starts at second 1 of that minute).
While the time scale is changed, the main timer continues to tick over, with the hairline moving slower or faster depending on the scale.
Video and corresponding data can be viewed either live, or as recorded. In order to access the recorded part, use ‘-’ or ‘+’ buttons on each side of the main timer.
Create a new Tripwire/Region of Interest(ROI)#
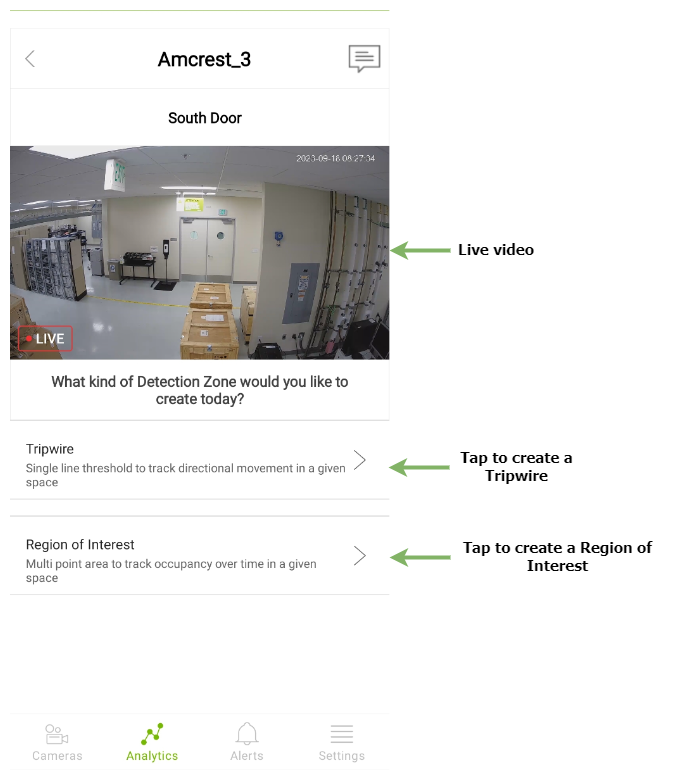
To create a new Tripwire or ROI, tap [+] sign in the upper left corner. A screen similar to the one below will be displayed. Tap the ‘Tripwire’ button to start creating a Tripwire. Tap the ‘Region of Interest’ button to start creating a ROI.
Tripwire Count#
Each camera view can be augmented with multiple tripwires.
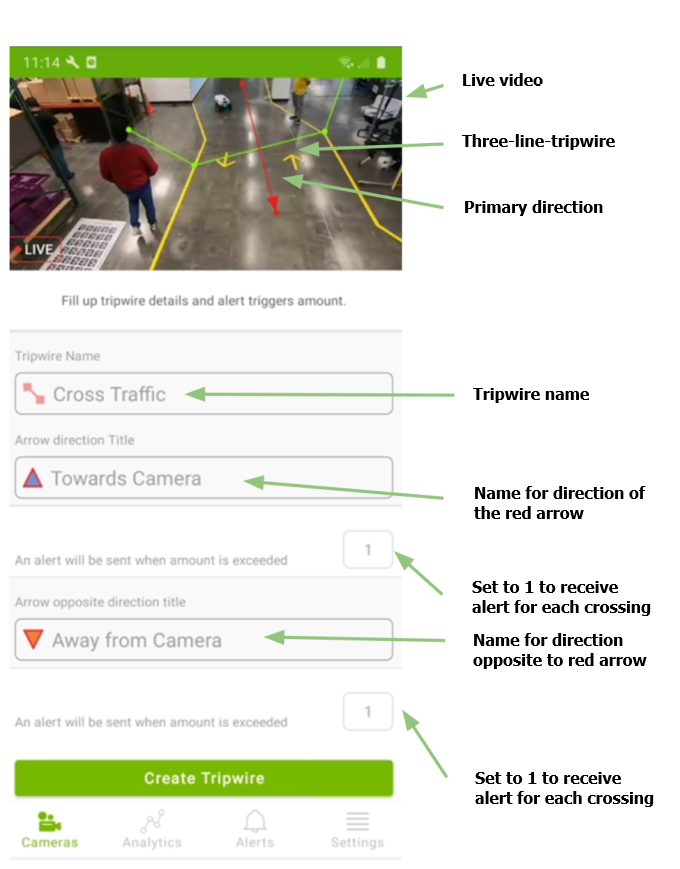
Follow prompts underneath the live video:
Tap the live video 4 times to create 3 connected lines; a red arrow will be drawn automatically to denote the primary tripwire direction
Give the tripwire a meaningful name
Name the primary tripwire direction
Input ‘1’ in alert edit box (see ‘Alert List’ section for details)
Name the secondary tripwire direction
Input ‘1’ in alert edit box (see ‘Alert List’ section for details)
Tap ‘Create Tripwire’ to finish tripwire creation
The tripwire creation UI will close and you will be taken back to the combined video/data display. You will now see two analytics above the live video window. Tap on the newly created tripwire (‘Cross Traffic’) in our example to reveal tripwire data.
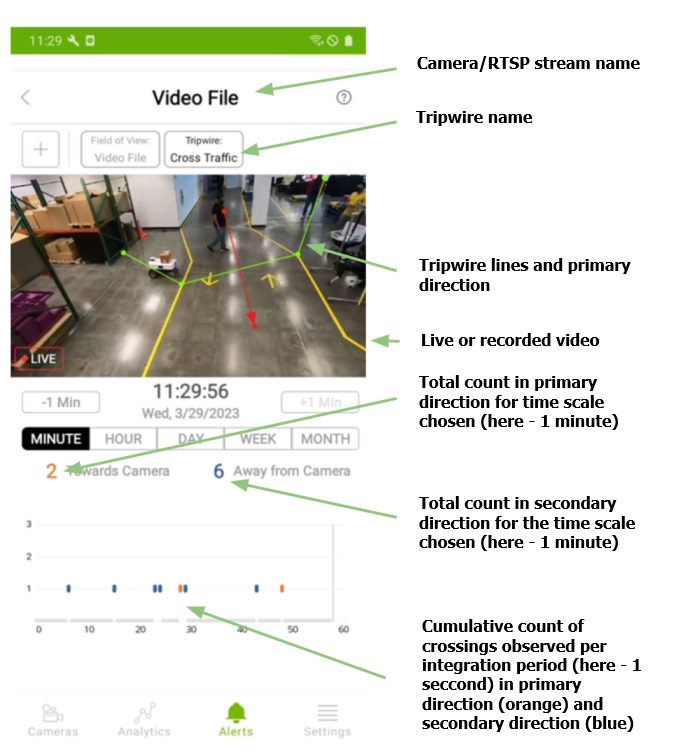
You can navigate through the video and data synchronously in a manner similar to that explained for full field of view count. For tripwire, each stop represents a cumulative count for the integration period chosen (in an example above the integration period is very short - 1 second - which makes the count instantaneous). As you increase the horizontal scale (hour, day, week or month), the integration period increases accordingly with cumulative counts describing total crossings during one minute, one hour, one day, and one day again, respectively.
Region of Interest Count#
Each camera view can be augmented with multiple Region of Interests.
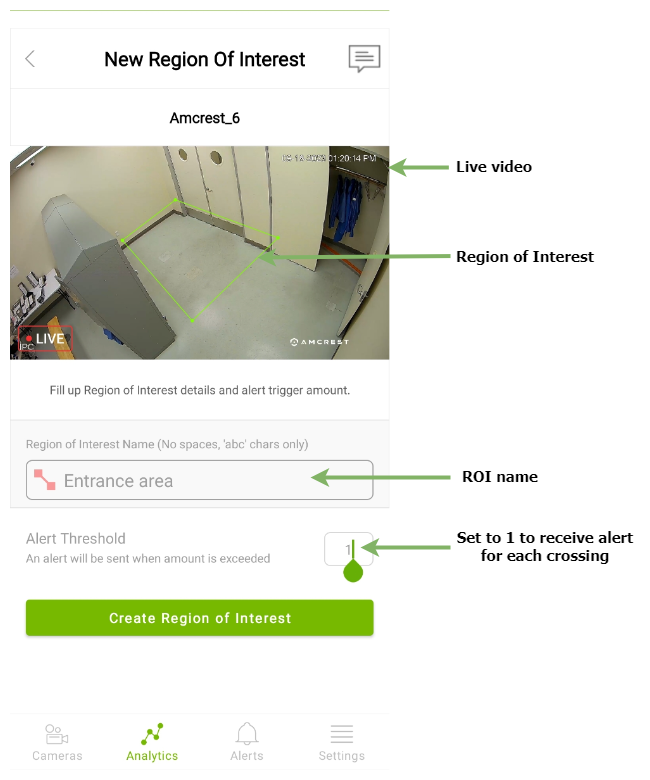
Follow prompts underneath the live video:
Tap the video 4 times to form a rectangle that denotes the Region of Interest.
Give the ROI a meaningful name.
Input ‘1’ in alert edit box (see ‘Alert List’ section for details).
Tap ‘Create Region of Interest’ to finish ROI creation.
The ROI creation UI will close and you will be taken back to the combined video/data display. You will now see two analytics above the live video window. Tap on the newly created ROI (‘Entrance area’) in our example to reveal the ROI data.
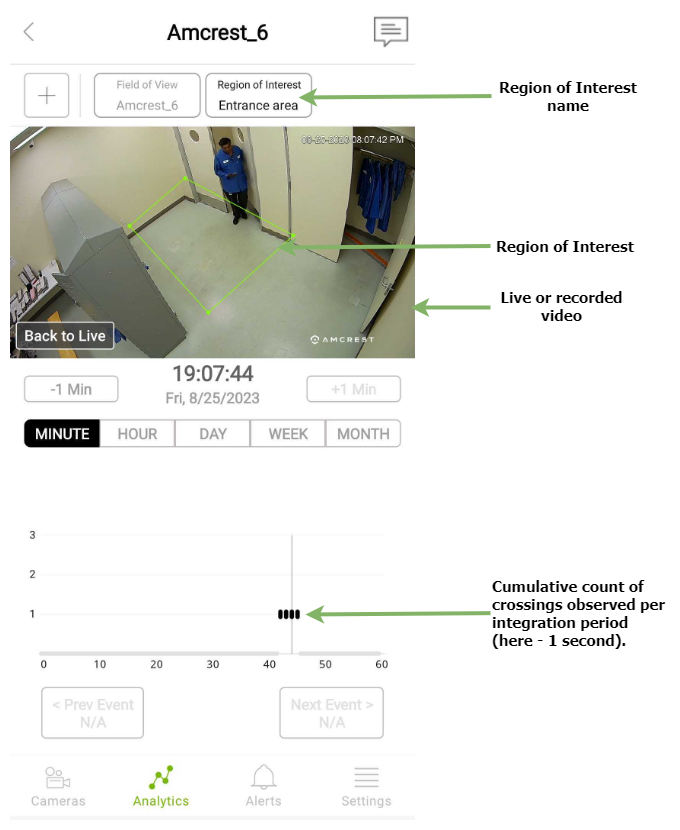
You can navigate through the video and data synchronously in a manner similar to that explained for full field of view count. Each stop represents a cumulative count for the integration period chosen (in an example above the integration period is very short - 1 second - which makes the count instantaneous). As you increase the horizontal scale (hour, day, week or month), the integration period increases accordingly with cumulative counts describing total crossings during one minute, one hour, one day, and one day again, respectively.
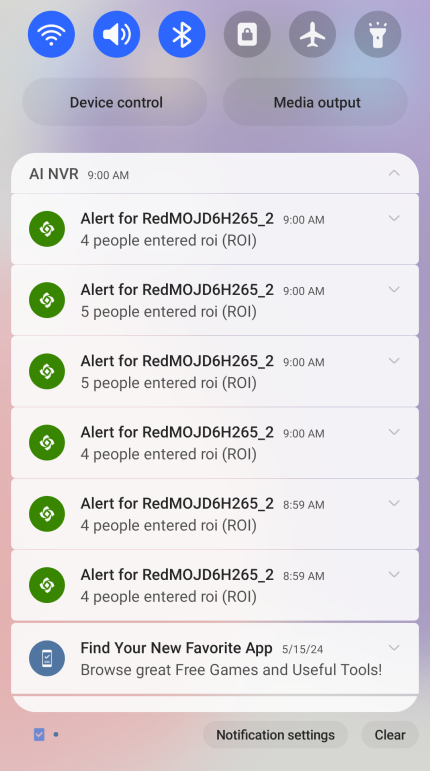
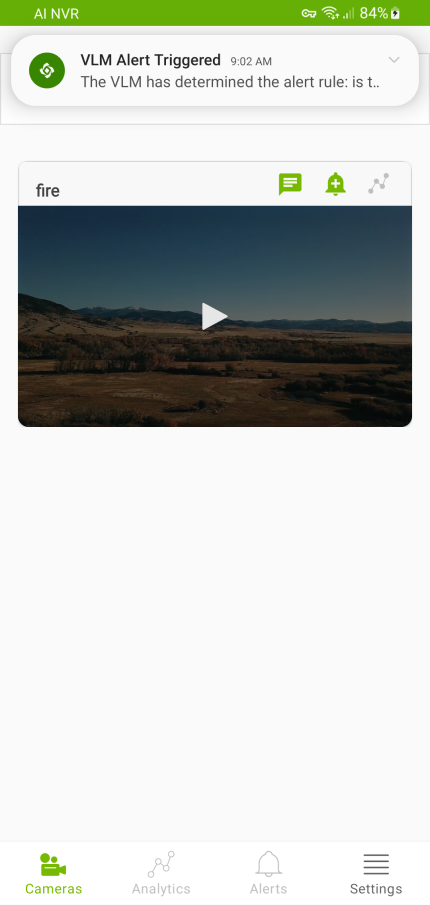
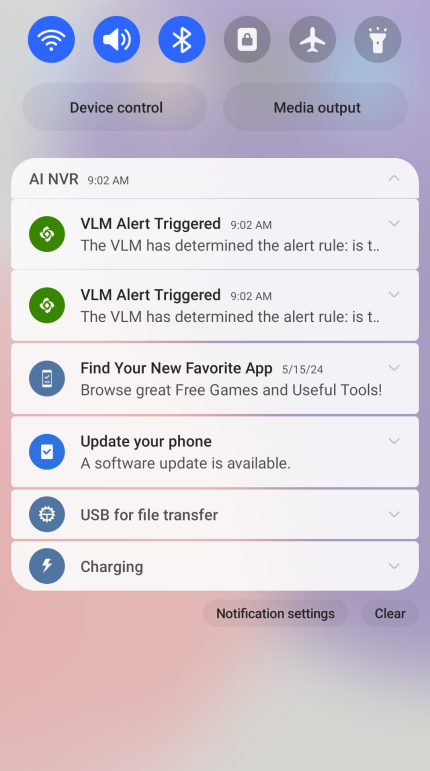
App Notifications#
The mobile app receives real-time alerts, such as gem alerts, from Jetson device for both direct-device and cloud-based connection. On direct device connection, the mobile app opens a web socket connection directly with the device. On a cloud-based connection, the mobile app receives the alert messages from Google Firebase Cloud Messaging. cloud-based connection is not supported in the JPs release.
Upon receiving an alert, the mobile app will post a notification on the mobile device. The user can tap on the notification to see more details about the alert.
The user can enable or disable the alert notification by going to ‘Settings -> Allow Notifications’.