Monitoring#
Introduction#
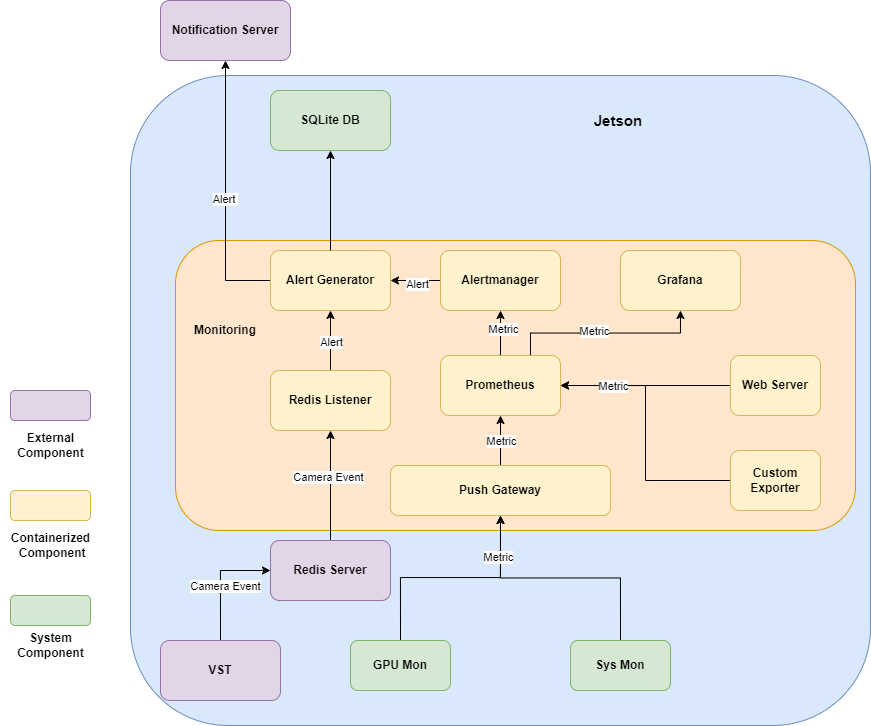
Monitoring is the home of all software components required to monitor, persist, and visualize edge device status, such as CPU & RAM usage, stream fps, and much more. We make use of the open-source monitoring technology and custom monitoring logic that caters specifically towards Jetson devices and their use cases. Monitoring stack consists of the following 5 components:
Exporters: Lightweight HTTP server that exposes metrics regarding application status. The endpoints will be scraped by the Prometheus server. Exporters include but not limited to: System Monitor, custom exporters, and etc. Custom exporter exports camera status, stream fps, and etc. Interested party may integrate an exporter into their own application.
Web Server: Monitoring has a web-server that mainly serves CRUD operations of alerts. It serves three types of client: Grafana server, Alertmanager callbacks, and mobile users. The Grafana server has a custom datasource that retrieves data from a HTTP endpoint with filtering capability that is hosted as part of the web server. Alertmanager needs to register a receiver for all the alerts generated. The receiver needs to have custom logic that persists the data and forwards to a message broker such as Slack. We host such logic as part of the web server. On top of the two use cases mentioned, most of the CRUD operations of alerts are also exposed as HTTP endpoints for all other clients. This flow is mainly built for mobile users or any other interested parties that wish to integrate with Monitoring.
Metric and Alerts: We use the Prometheus and Alertmanager for the processing and routing of metrics and alerts. Prometheus is responsible of scraping the targets for metrics and evaluating the alerting rules periodically. When an alerting rule is triggered, an asynchronous alert is generated, sent to alertmanager, and forwarded to downstream callbacks. It also serves as one of the datasources to Grafana. Monitoring also has some custom logic that evaluates certain alerting criteria outside the Prometheus setup and subscribes to a message broker such as Redis to handle synchronous alerts from another microservice . This workflow is used when the alert criteria cannot be determined based on Prometheus metrics such as camera status.
Visualization: Grafana is the choice for all of our visualization needs. There are three datasources that Grafana consumes: web server, Prometheus. The data flows of web server and Prometheus have been explained in the previous sections.
Metric Gateway & Monitoring Daemon: In rare cases (permission/security constraints), where the exporter container is unable to retrieve certain information regarding the host system. We register a daemon service through system command utility on a Linux system which gets launched on boot, which periodically retrieve and feed metrics into a metric gateway container. The metric gateway container will get subsequently scraped by the Prometheus server. This pattern is applied to GPU monitor when /sys directory on host becomes unavailable to exporter container.
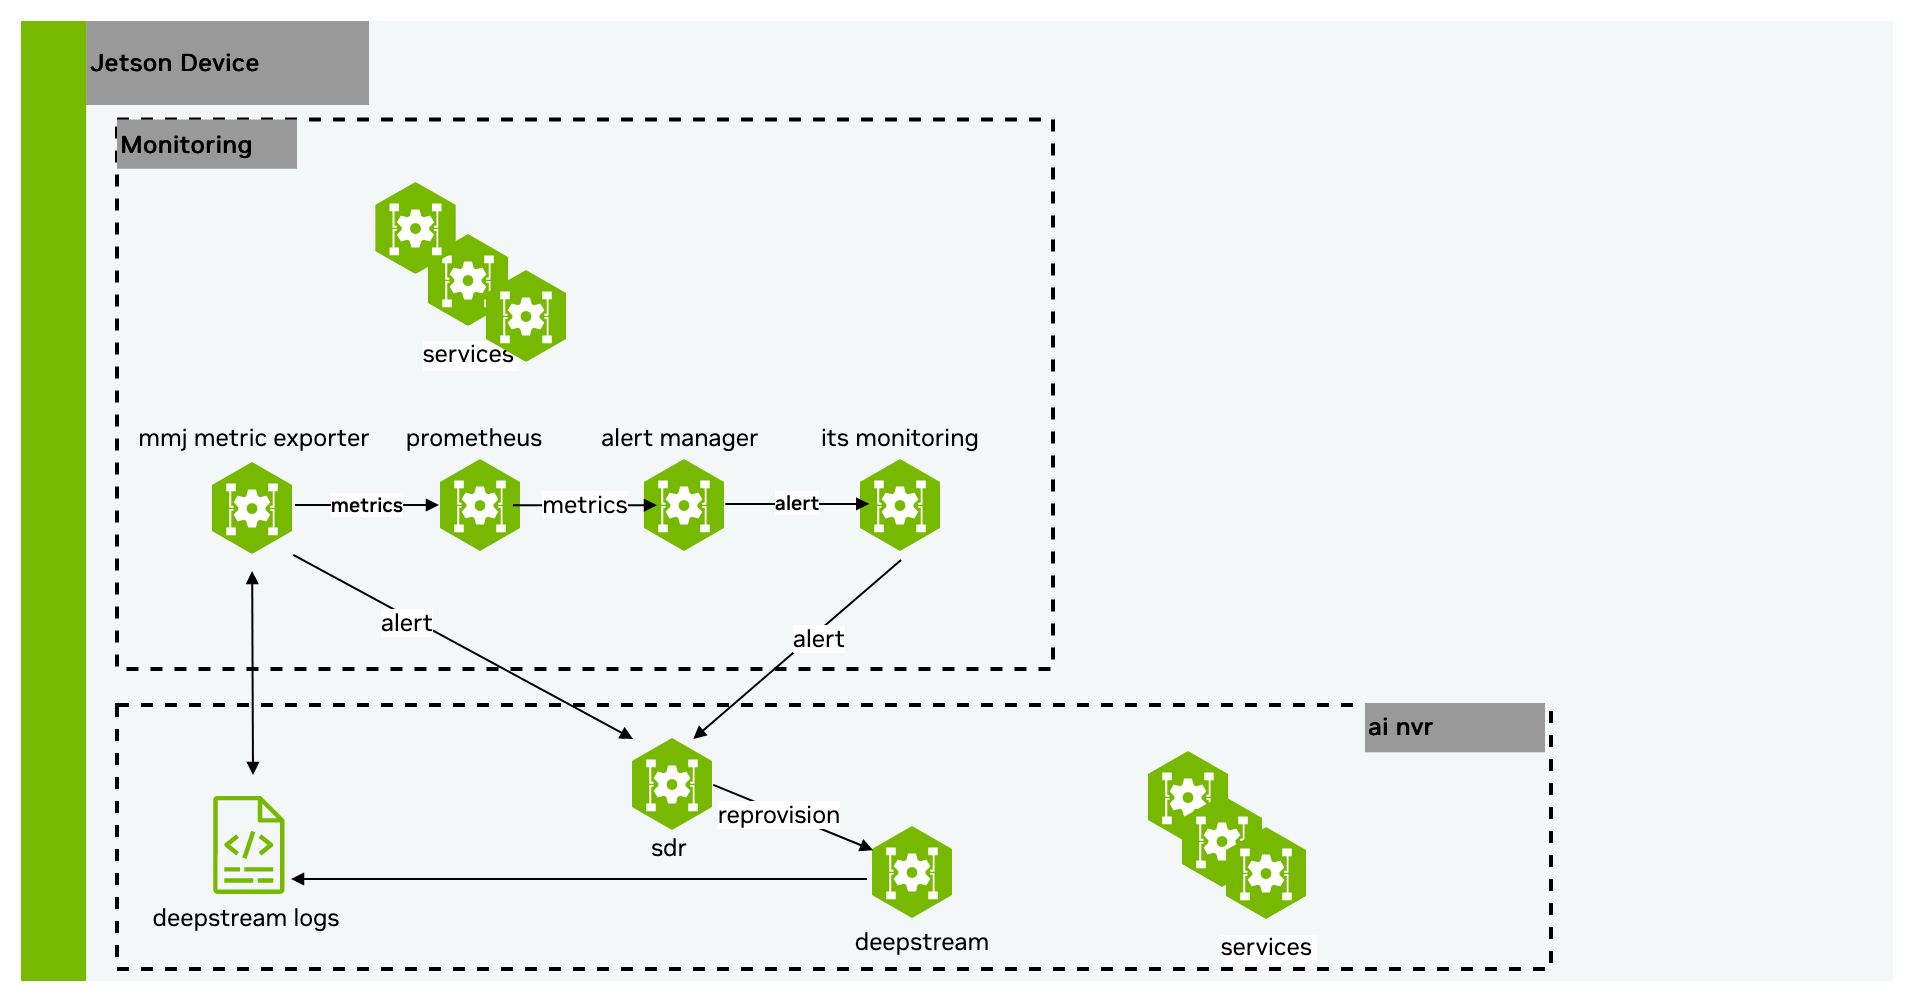
Architecture#
Dashboards#
Dashboards can be access at <HOST_ADDR>:3000. The default credential: <admin, admin> is used if not otherwise overridden.
Tegrastats#
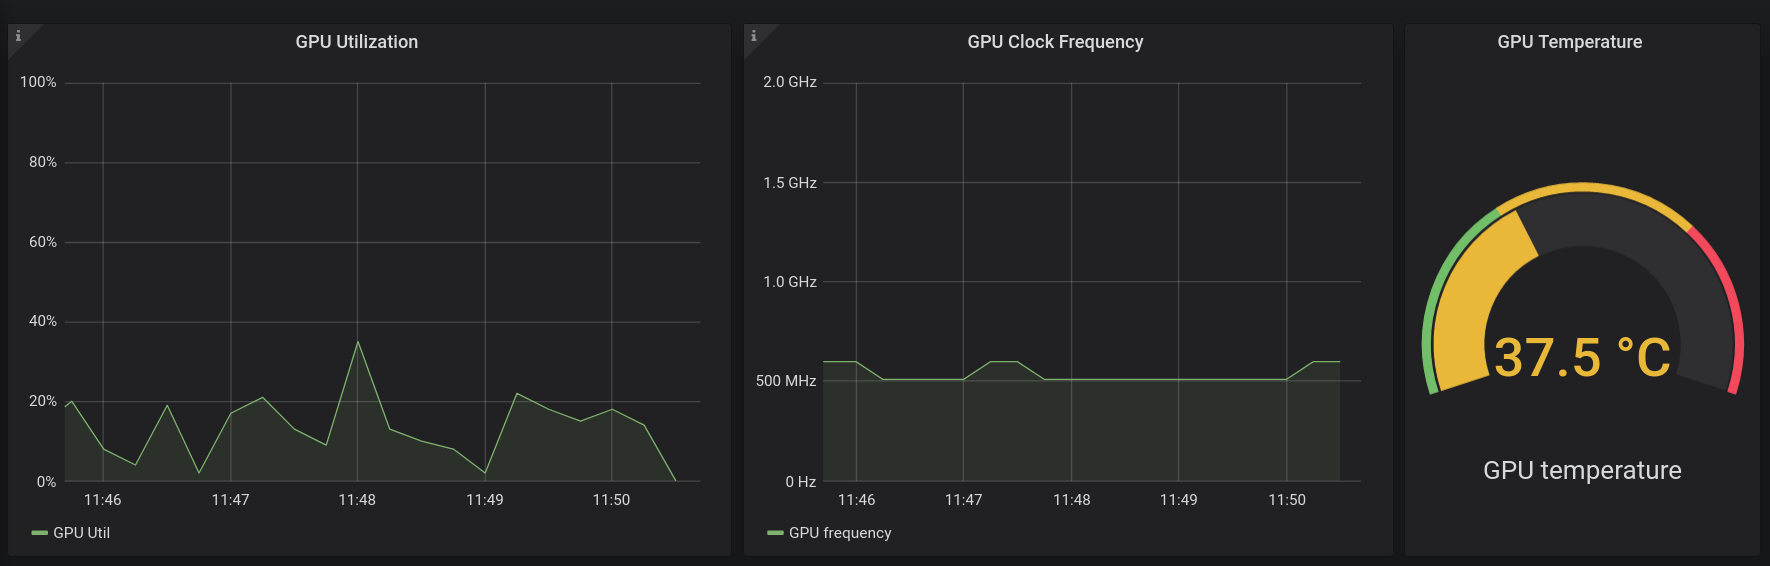
GPU stats#
GPU utilization rate in percentage, clock frequency in GHz, and temperature in Celsius.
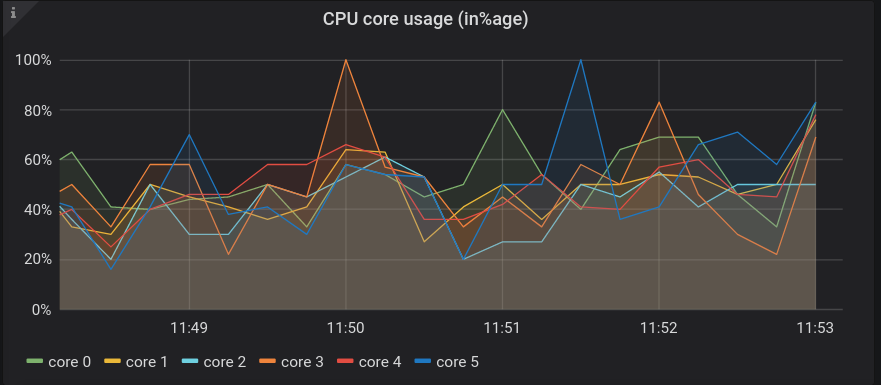
CPU stats#
CPU core usage in percentage:
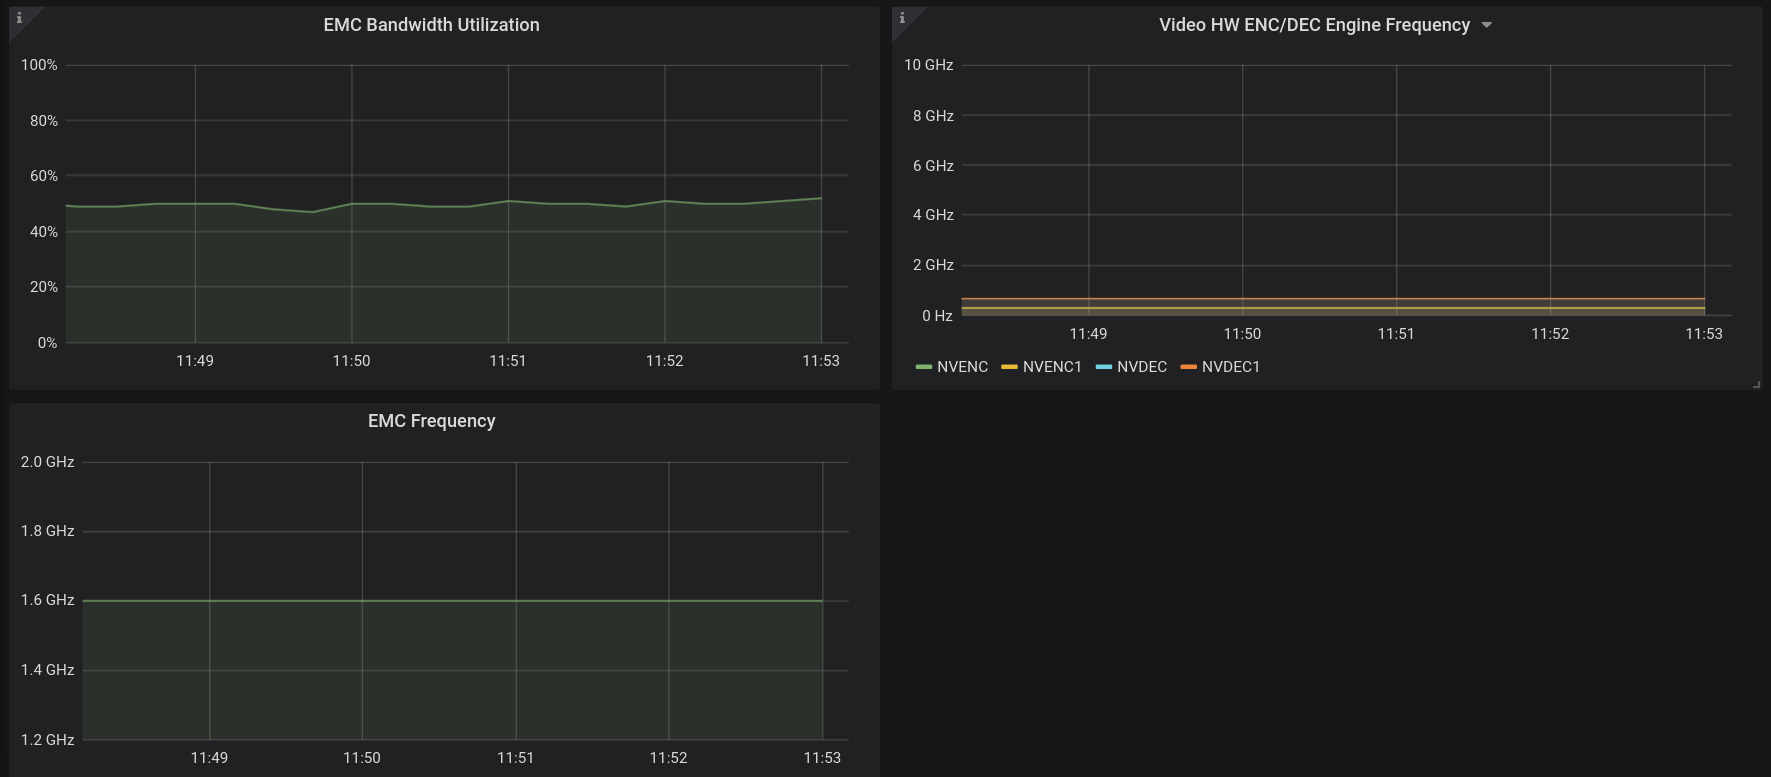
EMC & ENC/DEC#
EMC bandwidth utilization in percentage and frequency in GHz, and decoder/encoder frequency in GHz:
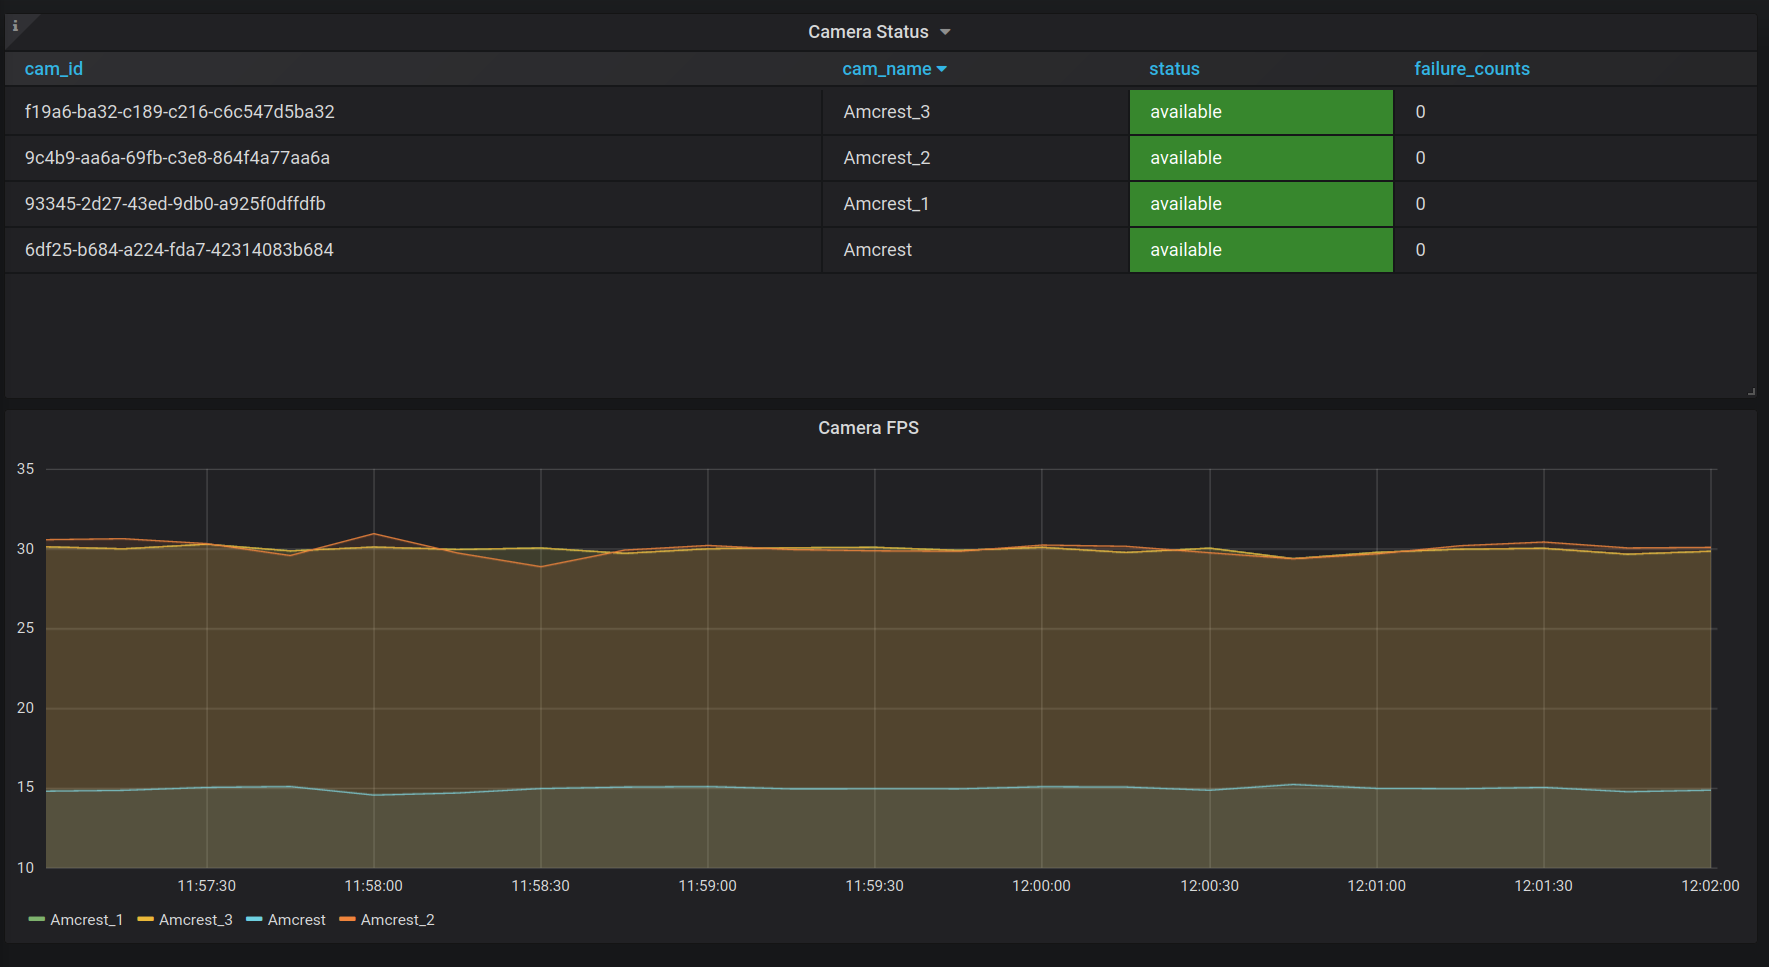
Camera Status#
Table with camera id, camera name, current status, and accumulated failure counts and diagram of fps labeled by stream name.
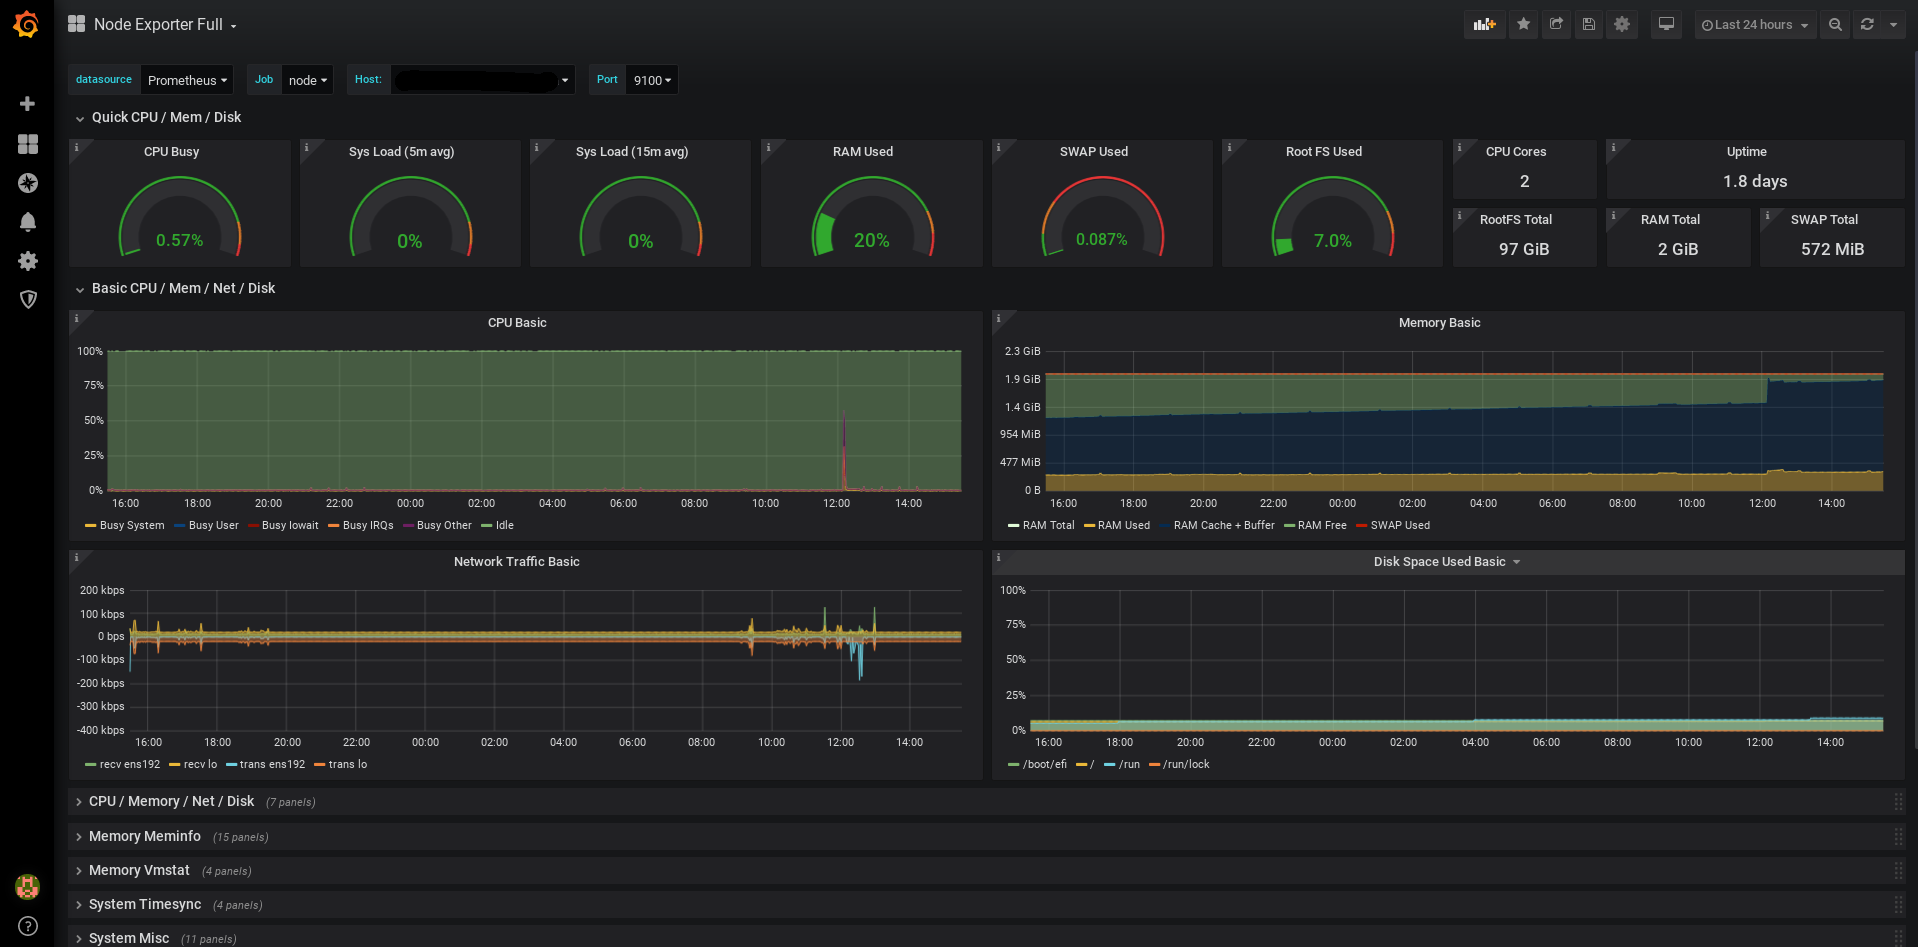
System Metrics#
Table shows default system dashboard that include all metrics exporter by node exporter including RAM, CPU, Network, Filesystem, and etc.,
OSS#
Prometheus#
Prometheus is the central processing unit as well as the data persistence solution for time series data exported from all software components. The default expiration period is set to 14 days, after which data will be purged from the file system. If a longer expiration period is desired, the setting is configurable at the cost of increased RAM usage as the old time series data still need to be indexed in memory. Basic setting and alerting rules can be configured. See the configuration section for details. It is worth pointing out the trade-off between frequency and quantity of the scraping vs the CPU and RAM usage. In another word, if you desire more metrics with a strict requirement on the temporarity of the data, it will consume more RAM and CPU. You can access Prometheus server at <HOST_ADDR>:9090.
Alertmanager#
The Alertmanager handles alerts sent by the Prometheus server. It takes care of deduplicating, grouping, and routing them to the correct receiver. It also takes care of silencing and inhibition of alerts. Currently, Monitoring web server is the only receiver of Alertmanager. Depending on the alert type and its associated label, Alertmanager can be configured to have different handling mechanisms. See the configuration section for more detail. When an alert is resolved (meaning when alerting rule is no longer active), Alertmanager also sends back the acknowledgement to the web server for it to process and update the records accordingly. You can access Alertmanager server at <HOST_ADDR>:9093.
Node Exporter#
The Node Exporter exposes a wide variety of hardware and kernel-related metrics. It is essential for monitoring system level metrics such RAM and CPU usage. You may access Node Exporter at <HOST_ADDR>:9100/metrics.
GPU Exporter#
The tegrastats utility reports memory usage and processor usage for NVIDIA® Jetson™ based devices.
Grafana#
Grafana has two datasources: Prometheus and SimpleJson. Prometheus server provides all the time series data by scraping the targets, and SimpleJson plugin enables Grafana to call API endpoints hosted by the web server to get its data. As mentioned in the previous section, this dataflow help populates the alert dashboard with filtering capability. On top of that, camera status dashboard also uses this dataflow to query camera state from the web server, which delegates the request to the VST endpoints. You may access Grafana at <HOST_ADDR>:30080/grafana.
JPS-Metrics-Exporter#
jps-metrics-exporter processes DeepStream log and extracts information that are exposed as prometheus metrics. This current version of metrics exporter extracts DeepStream FPS values and stream addition/removal events which are then exposed as a prometheus metrics. Grafana will pull those metrics and expose them in the dashboard. On demand, prometheus will aggregate those metrics to create alerts which will be pushed to any receivers such as Slack or SDR.
Start and Stop Services#
Start the monitoring services
sudo systemctl start jetson-monitoringsudo systemctl start jetson-sys-monitoringsudo systemctl start jetson-gpu-monitoringVerify all the lines (for monitoring services) in the platform ingress config file are uncommented, and if not, then do so:
/opt/nvidia/jetson/services/ingress/config/platform-nginx.conf
After all the monitoring services have started, (re)start the ingress service:
sudo systemctl start jetson-ingressTo stop the monitoring services, do so in reverse order:
sudo systemctl stop jetson-ingress(if not needed for other services)sudo systemctl stop jetson-gpu-monitoringsudo systemctl stop jetson-sys-monitoringsudo systemctl stop jetson-monitoring