Production Deployment
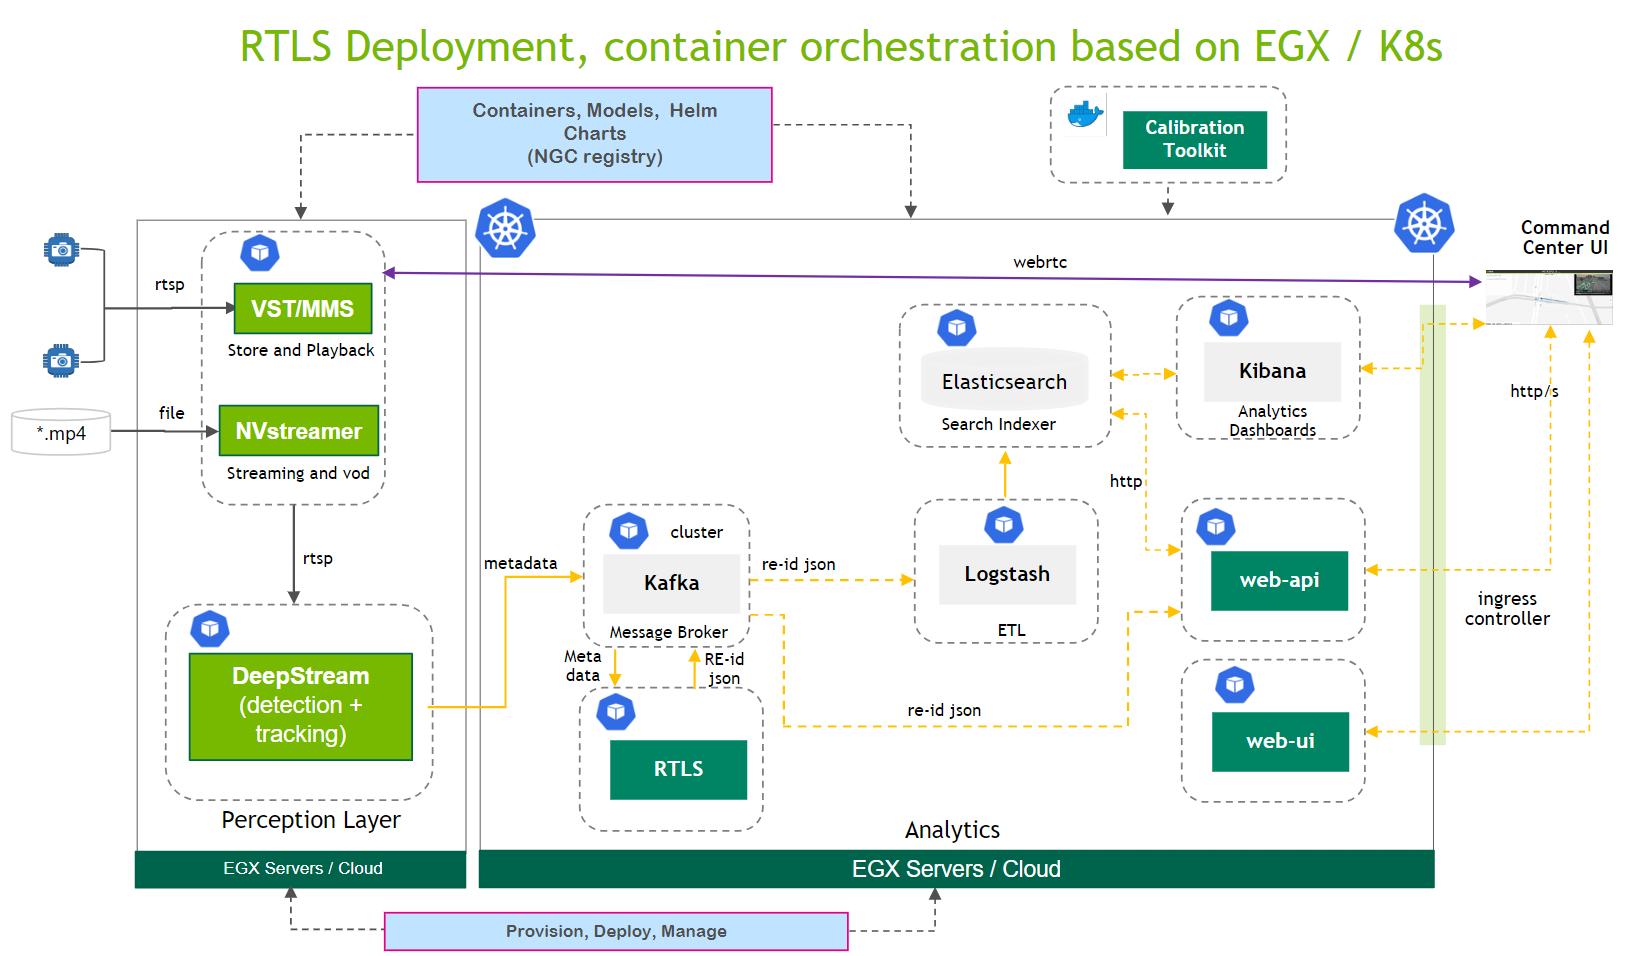
Here is the app overview if you need to refer again.
Deployment Using Helm Charts
Deployment Architecture
Order of Deployment
Some of the Microservices pods may not fully utilize GPU. If the system has less GPU available, then these can be shared, except DeepStream pipeline will require dedicated GPU allocation.
GPU sharing is enabled by using
NVIDIA_VISIBLE_DEVICESto assign same GPU-ID to different pods and ensure that it doesn’t overlap with DS GPU_ID. Also GPU_Operator allocation for GPU assignment for pods has to be disabled, below example can be used.
Following example shows how to time-slice a GPU and disable GPU_Operator (which dynamically assigns the GPU to a pod):
resources:
  limits:
    nvidia.com/gpu: 1

``Can be changed to``

env:
- name: NVIDIA_VISIBLE_DEVICES
  value: "<UNIQUE_GPU_ID>"
resources:
  limits:
    nvidia.com/gpu: 0
Deploy Tracking & Analytics Microservices
Install Chart for the tracking & analytics microservices of Real Time Location System (RTLS) application with the provided config file:
helm install mdx-rtls-app https://helm.ngc.nvidia.com/nfgnkvuikvjm/mdx-v2-0/charts/mdx-rtls-app-1.0.2.tgz --username='$oauthtoken' --password=<NGC API KEY> -f application-helm-configs/RTLS/rtls-app-override-values.yaml
Deploy Coturn Server for NVStreamer and VST Microservices
Install
export TURN_SERVER_EXTERNAL_IP=`hostname -I | awk '{print $1}'` && echo $TURN_SERVER_EXTERNAL_IP
Coturn Server runs as a Docker container in a separate machine/server. Run the below command to spin up the container.
docker run --name mdx-coturn -d --network=host instrumentisto/coturn \
           -n --log-file=stdout \
           --external-ip=$TURN_SERVER_EXTERNAL_IP \
           --listening-ip=$TURN_SERVER_EXTERNAL_IP \
           --lt-cred-mech --fingerprint \
           --user=admin:admin \
           --no-multicast-peers \
           --realm=nvstreamer.realm.org
Verify if the container is running by docker ps mdx-coturn.
TURN_SERVER_EXTERNAL_IP needs to be configured for NvSteamer and VST as for parameter static_turnurl_list.
Note
Coturn needs to run on a separate machine/server from K8s node cluster.
Example is using default user/pass as admin/admin, you can change in docker run command to specific credentials.
Make sure to configure for NVStreamer/VST.
Configure
Under the application-helm-configs.tar.gz tar, We need to configure static_turnurl_list parameter mentioned files “nvstreamer-with-ingress-values.yaml and vst-app-with-ingress-values.yaml to play webrtc streams.
Example static_turnurl_list: ["user:pass@<TURN_SERVER_EXTERNAL_IP>:3478"].
Note
Make sure to use correct IP for “TURN_SERVER_EXTERNAL_IP and credentials”.
TURN_SERVER_EXTERNAL_IPthis should be a separate HOST IP from the K8s host IP.
Deploy NVStreamer and VST Microservices
NVStreamer
Note
Install NVStreamer if your application is operating on video files.
helm install nvstreamer-app https://helm.ngc.nvidia.com/rxczgrvsg8nx/vst-1-0/charts/nvstreamer-0.2.32.tgz --username='$oauthtoken' --password=<NGC API KEY> -f application-helm-configs/RTLS/nvstreamer-with-ingress-values.yaml
Videos needs to be uploaded in NVStreamer UI http://<K8s_node_IP>:31080/nvstreamer/. Sample videos are available in metropolis-apps-data tar downloaded in above steps.
VST
helm install vst-app https://helm.ngc.nvidia.com/rxczgrvsg8nx/vst-1-0/charts/vst-1.0.30.tgz --username='$oauthtoken' --password=<NGC API KEY> -f application-helm-configs/RTLS/vst-app-with-ingress-values.yaml
NVStreamer sources are fed to VST and considered as simulated live streams.
You can add live cameras directly from VST UI (
http://<K8s_node_IP>:31080/vms/).For running VST using edge-to-cloud setup, please use
application-helm-configs/RTLS/vst-app-edge-with-ingress-values.yamlfor helm configs, setting up edge details can be found here Edge-to-Cloud Deployment Using Scripts.
Deploy Perception (WDM-DeepStream) Microservice
helm install mdx-wdm-ds-app https://helm.ngc.nvidia.com/nfgnkvuikvjm/mdx-v2-0/charts/mdx-wdm-ds-app-0.0.33.tgz --username='$oauthtoken' --password=<NGC API KEY> -f application-helm-configs/RTLS/wdm-deepstream-rtls-values.yaml
Make sure to update application-helm-configs/RTLS/wdm-deepstream-rtls-values.yaml. We can also add or remove sources/inputs for the perception microservice directly using Add cameras / Remove cameras or DeepStream API.
Deploy Monitoring Exporter - Metrics Collector Microservices
helm install mdx-mon-exporter-app https://helm.ngc.nvidia.com/nfgnkvuikvjm/mdx-v2-0/charts/mdx-mon-exporter-app-0.0.2.tgz --username='$oauthtoken' --password=<NGC API KEY>
Exporter chart collects metrics for Elasticsearch and Kafka for monitoring metrics in Grafana Dashboard using Promethus as a data source.
Elasticsearch Metrics will be available under Grafana UI > General > Elasticsearch Exporter Quickstart and Dashboard.
Kafka Metrics will be available under Grafana UI > General > Strimzi Kafka Exporter.
Optional Chart, you can skip if monitoring for Kafka/elasticsearch is not needed for your environment.
Deploy Calibration App - Camera Calibration Toolkit
helm install mdx-calibration-app https://helm.ngc.nvidia.com/nfgnkvuikvjm/mdx-v2-0/charts/mdx-calibration-app-0.0.2.tgz --username='$oauthtoken' --password=<NGC API KEY> -f application-helm-configs/calibration-and-notebook-app/calibration-toolkit-app-values.yaml
Camera Calibration Toolkit as a service app for generating calibration.json
Calibration App UI will be available at
http://<K8s_node_IP>:31080/calibration/.Optional Chart, you can skip if no need to generate or doing camera calibration.
Deploy Notebook App - Metropolis Jupyter Notebook
helm install mdx-notebook-app https://helm.ngc.nvidia.com/nfgnkvuikvjm/mdx-v2-0/charts/mdx-notebook-app-0.0.2.tgz --username='$oauthtoken' --password=<NGC API KEY> -f application-helm-configs/calibration-and-notebook-app/notebook-app-values.yaml
Notebook as a service app for running Jupyter notebooks.
Notebook App UI will be available at
http://<K8s_node_IP>:31080/notebook/.Optional Chart, you can skip if no need to generate or doing running Jupyter metropolis app notebooks.
Verify Deployment Installation
kubectl get pods -owide
kubectl get pods -owide | grep -v 'Compl\|Runn' <<=== to check if any pod is not running or failing.
Note
Once all pods are up and running, RTLS UI is available at
http://<K8s_node_IP>:31080/ui/rtls/.If there are any failed pod(s) please debug the issue using troubleshooting steps described below.
Troubleshoot Pod/Deployment Failures
Check the events for the failed/crashed pods:
kubectl describe pod <Failed_Pod_Name>.View logs of failed pods to find failure error using:
kubectl logs -f <Failed_Pod_Name>.View logs of a specific container inside a pod using
kubectl logs -f <Failed_Pod_Name> -c <failed_pod_container_name>(Usekubectl describe pod <Failed_Pod_Name>to list all the containers running for a pod).If pod is not running due to K8s scheduling then events will shows failure errors. Also, if pod is crashing then logs for a pod/container will have information on why it failed to start.
Explore Application Reference UI
Once the application deployment is complete, open a browser and access the UI at http://<K8s_host_IP>:31080/ui/rtls/ (replace with the deployment Kubernetes master node system IP).
Before playing with UI you need to do the following steps to upload the required files for the specific cameras views.
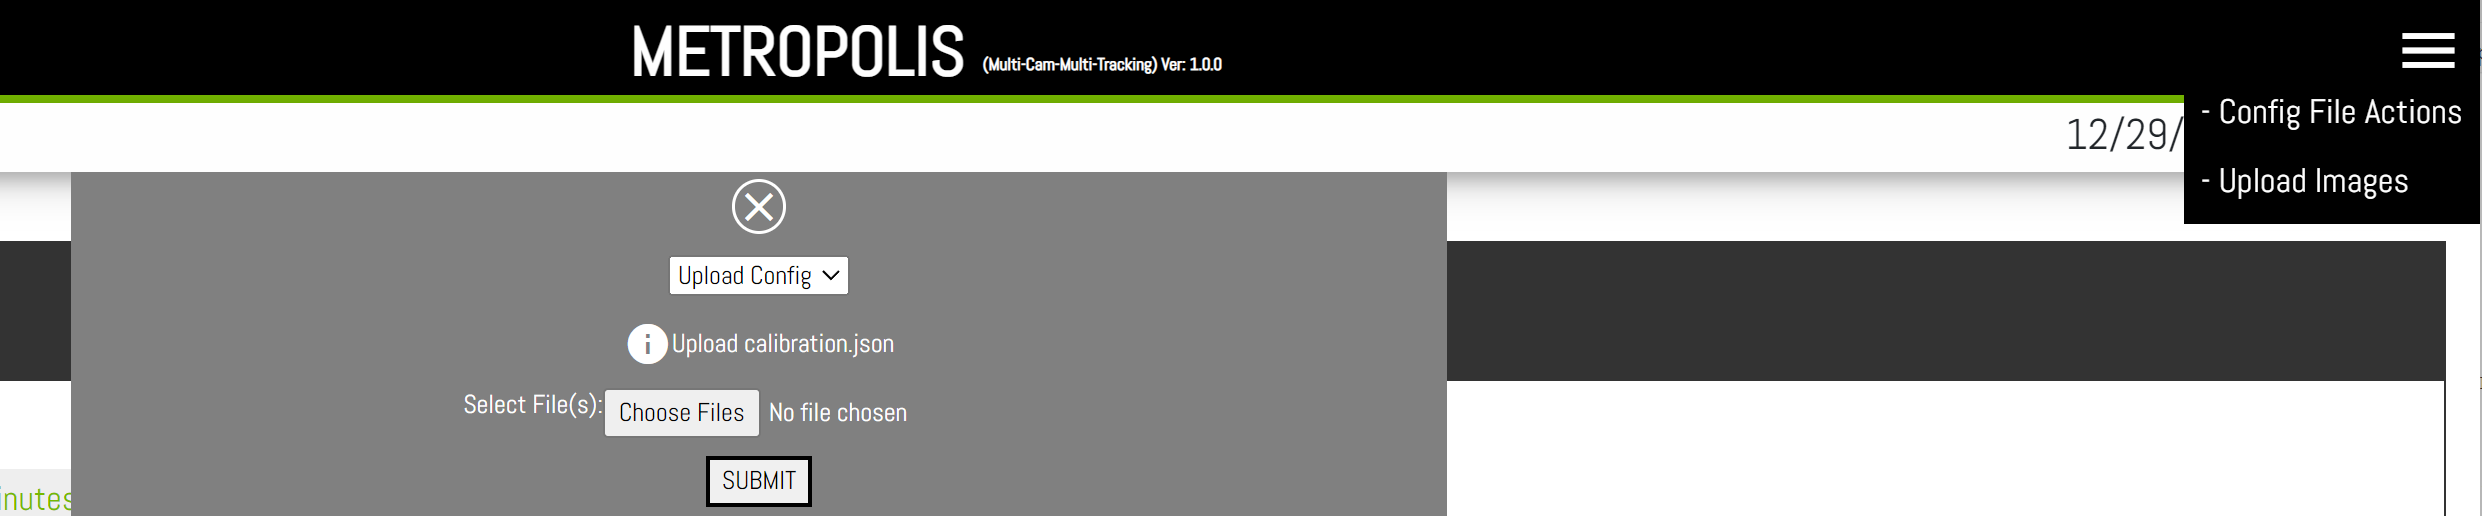
Upload Calibration File
Select the -Config File Actions option from the top-right corner.
Select
application-helm-configs/RTLS/calibration.jsonfrom Choose Files. This file is present under folderapplication-helm-configscreated in earlier stage.Click SUBMIT (as shown in the screen shot below).
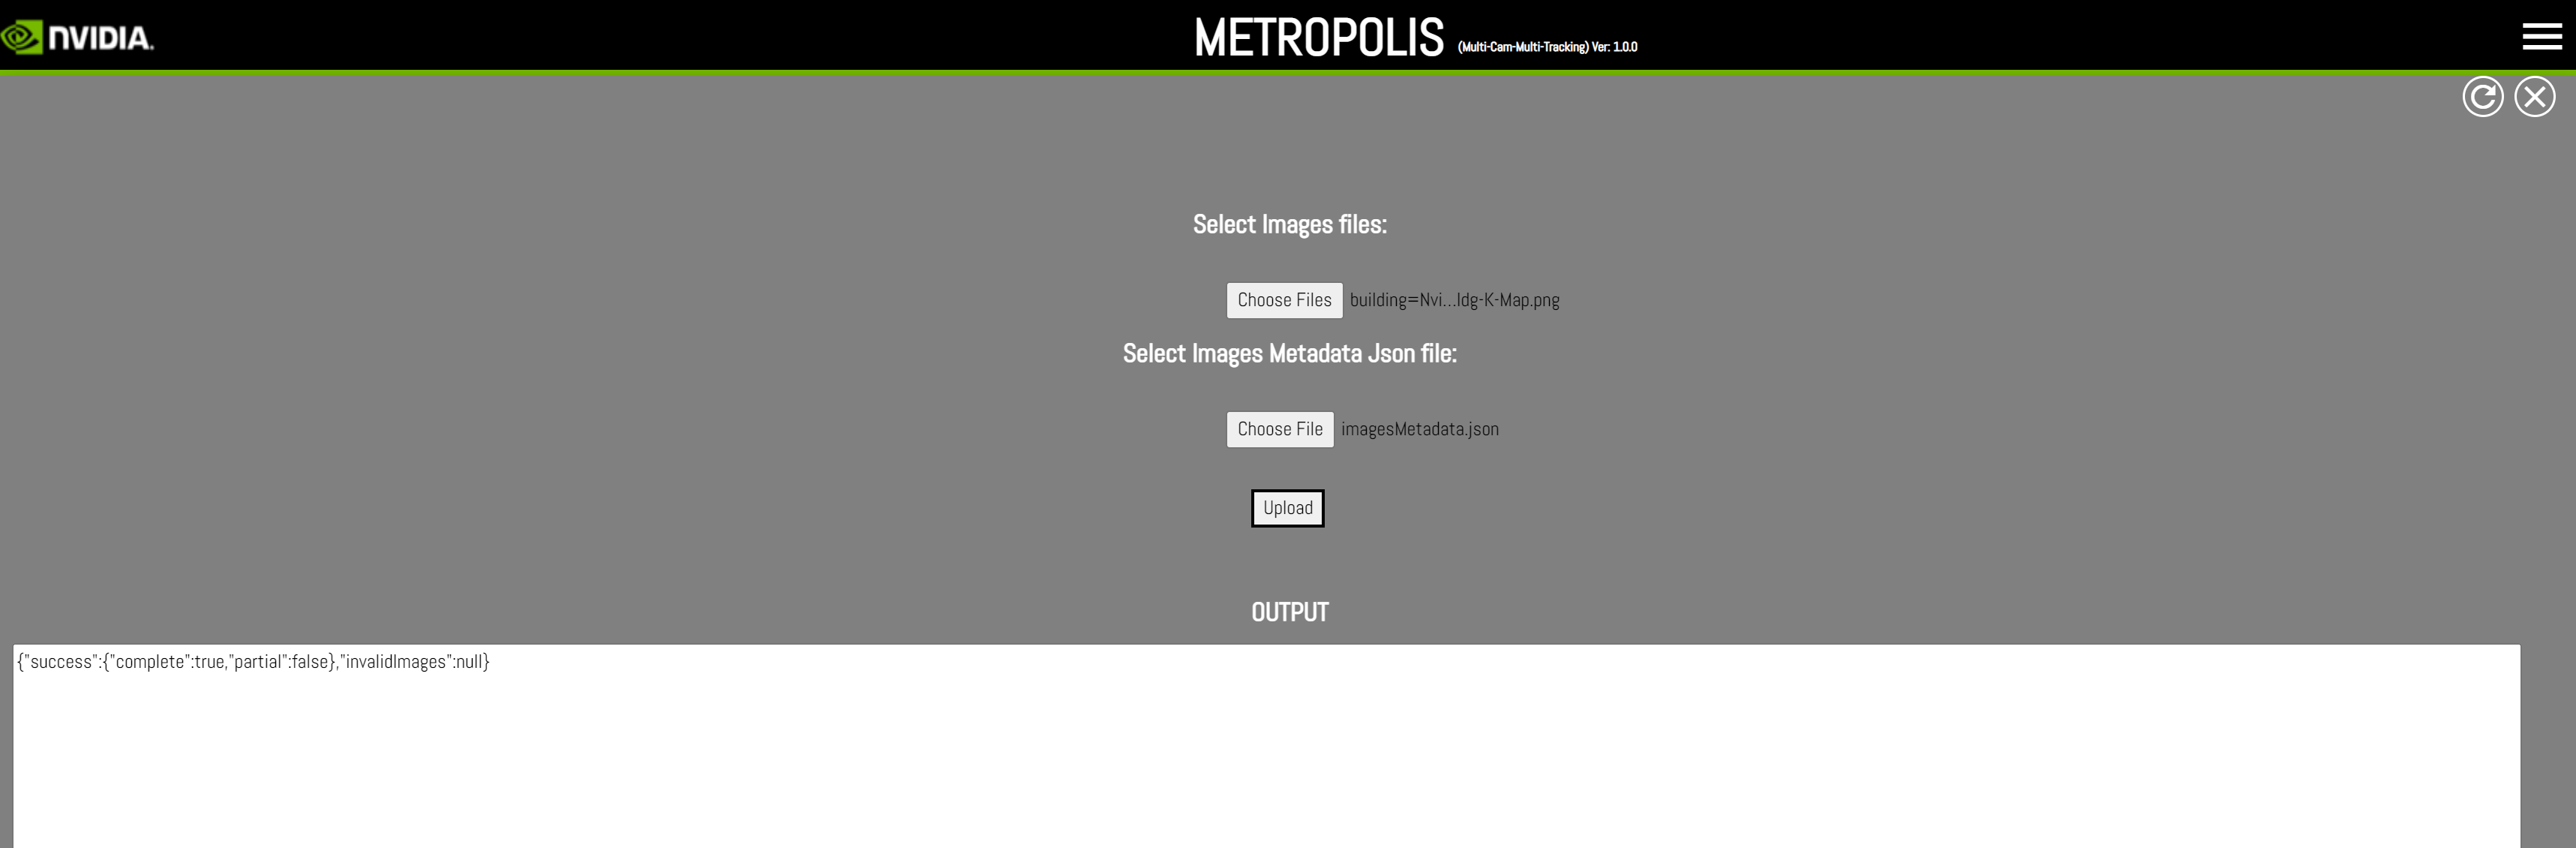
Upload Floor Plan Image and Image Metadata
Select the -Upload Images option from the top-right corner
Select
application-helm-configs/RTLS/images/building=Nvidia-Bldg-K-Map.pngandapplication-helm-configs/RTLS/images/imagesMetadata.jsonpresent under the folderapplication-helm-configscreated in earlier stage.Click Upload (as shown in the screen shot below).
Refresh UI
Now you should be able to see the UI window as below with Events window on the left and floor plan view on the right.
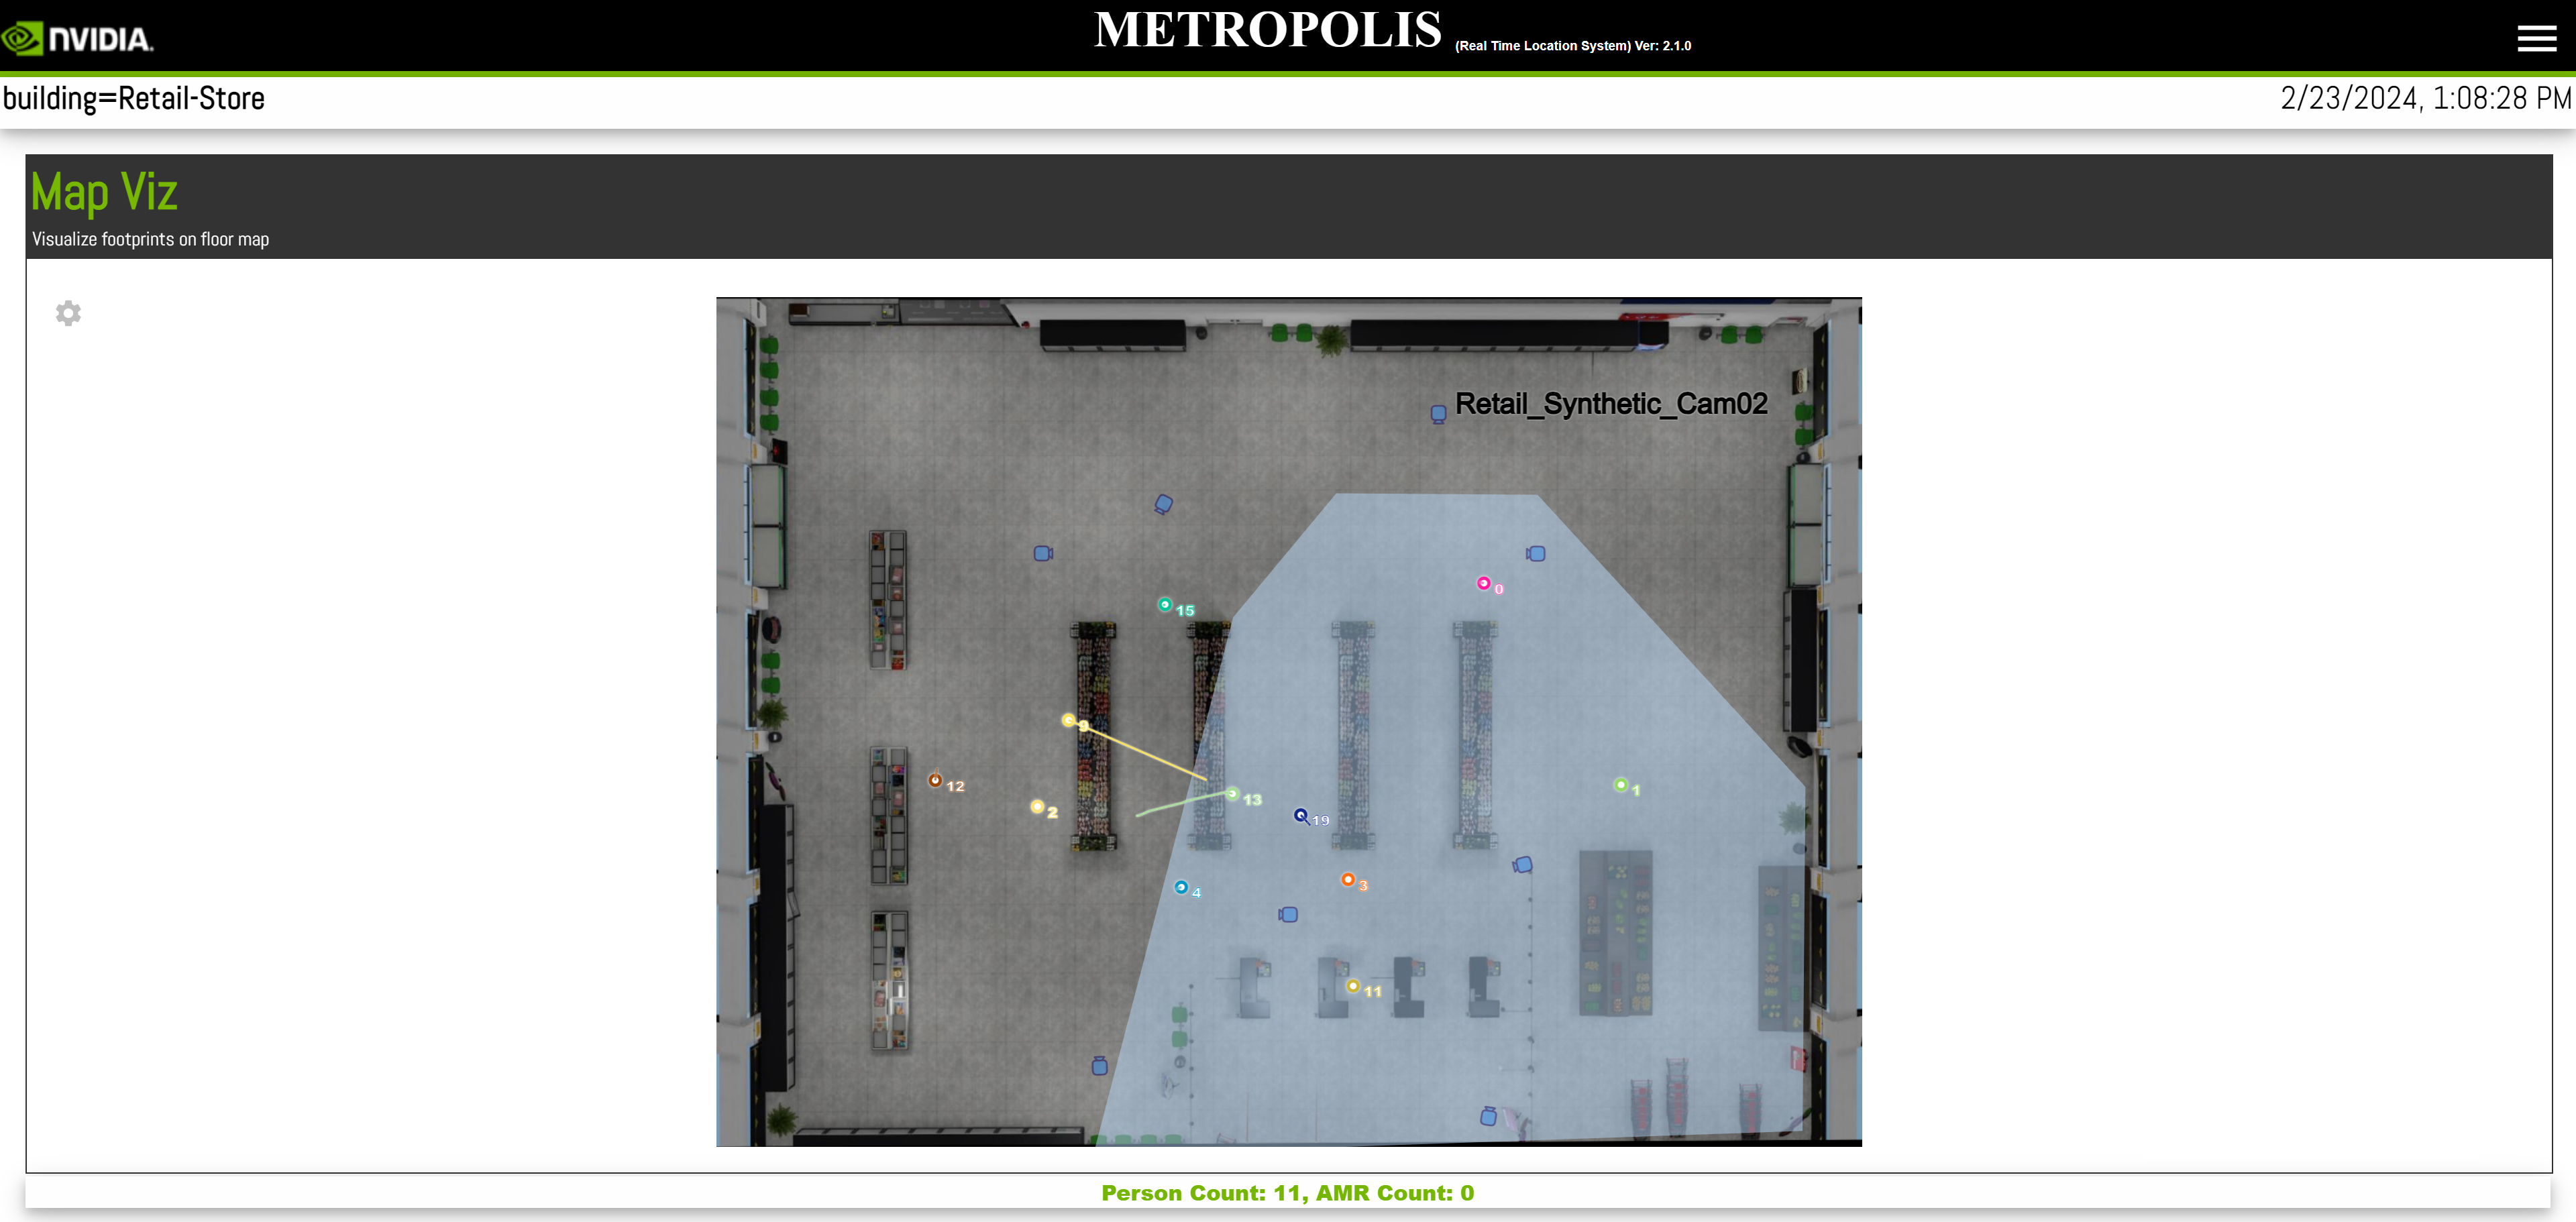
Now you should be able to see the UI as documented in Real Time Location System UI section.
Import Kibana Dashboard & Index Patterns
The application-helm-configs.tar.gz tar downloaded in above steps contains the file rtls_kibana_objects.ndjson present in the application-helm-configs/RTLS directory.
This needs to be uploaded via Kibana to view the dashboard.
Steps to upload Kibana dashboard from Kibana UI:
Go to Kibana UI
http://<K8s_host_IP>:31560/.From Menu Option, go to stack management > Saved Objects > Import > Upload Dashboard file
rtls_kibana_objects.ndjson> Done.Dashboard can be viewed from Menu option > Dashboard.
Remove Application Deployment
Delete a specific installed Helm chart
Grab the chart name for deleting specific chart by running “helm ls” command. Then,
helm delete <chart_name>
Delete all the installed Helm charts
for helm_chart in `helm ls -q` ; do helm delete $helm_chart ; done
Note
By default
helm deletewill not cleanup Kafka CRDs, which will make Kafka cluster still running. The next steps will clean up Kafka cluster.
Delete the Kafka CRD to cleanup Kafka cluster
for kafka_crd in `kubectl get crd | grep strimzi | awk '{print $1}'` ; do echo $kafka_crd ; kubectl delete crd $kafka_crd; doneClean up old PVCs and PVs to remove data
kubectl delete pvc --all --force && kubectl delete pv --all --force
Verify the cleanup
helm ls
kubectl get pods,pvc,pv
Clean up old PVCs data from machine filesystem
sudo rm -rf /opt/mdx-localpath /opt/mdx-local-nfs-path /opt/hostpath