Debug NeMo RL Applications#
This guide explains how to debug NeMo RL applications, covering two scenarios. It first outlines the procedure for debugging distributed Ray worker/actor processes using the Ray Distributed Debugger within a SLURM environment, and then details debugging the main driver script.
Debug Worker/Actors on SLURM#
Since Ray programs can spawn multiple workers and actors, using the Ray Distributed Debugger is essential to accurately jump to breakpoints on each worker.
Prerequisites#
Install the Ray Debugger VS Code/Cursor extension.
Launch the interactive cluster with
ray.sub.Launch VS Code/Cursor on the SLURM login node (where
squeue/sbatchis available).Add
breakpoint()in your code under actors & tasks (i.e. classes or functions decorated with@ray.remote).Ensure
RAY_DEBUG=legacyis not set since this debugging requires the default distributed debugger.
Forward a Port from the Head Node#
From the SLURM login node, query the nodes used by the interactive ray.sub job as follows:
teryk@slurm-login:~$ squeue --me
             JOBID PARTITION        NAME     USER ST       TIME  NODES NODELIST(REASON)
           2504248     batch ray-cluster   terryk  R      15:01      4 node-12,node-[22,30],node-49
The first node is always the head node, so we need to port forward the dashboard port to the login node:
# Traffic from the login node's $LOCAL is forwarded to node-12:$DASHBOARD_PORT
# - If you haven't changed the default DASHBOARD_PORT in ray.sub, it is likely 8265
# - Choose a LOCAL_PORT that isn't taken. If the cluster is multi-tenant, 8265
#   on the login node is likely taken by someone else.
ssh -L $LOCAL_PORT:localhost:$DASHBOARD_PORT -N node-12

# Example choosing a port other than 8265 for the LOCAL_PORT
ssh -L 52640:localhost:8265 -N node-12
The example output from the port-forwarding with ssh may print logs like this, where the warning is expected.
Warning: Permanently added 'node-12' (ED25519) to the list of known hosts.
bind [::1]:52640: Cannot assign requested address
Open the Ray Debugger Extension#
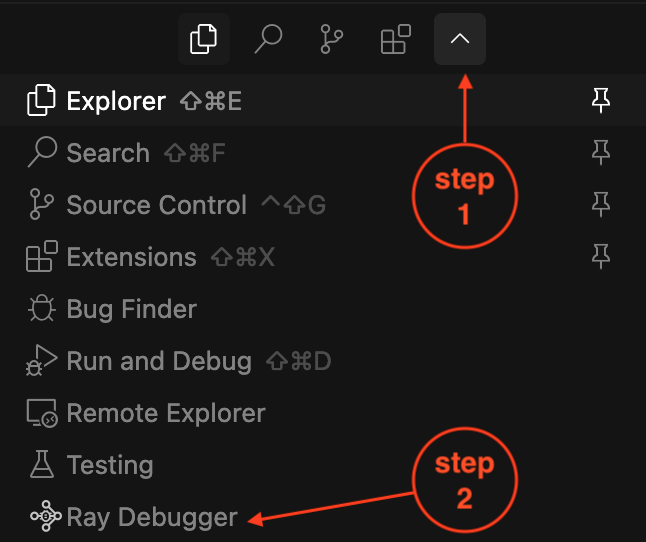
In VS Code or Cursor, open the Ray Debugger extension by clicking the Ray icon in the activity bar or searching for “View: Show Ray Debugger” in the Command Palette (Ctrl+Shift+P or Cmd+Shift+P).
Add the Ray Cluster#
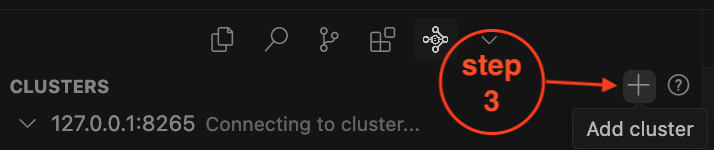
Click on the “Add Cluster” button in the Ray Debugger panel.
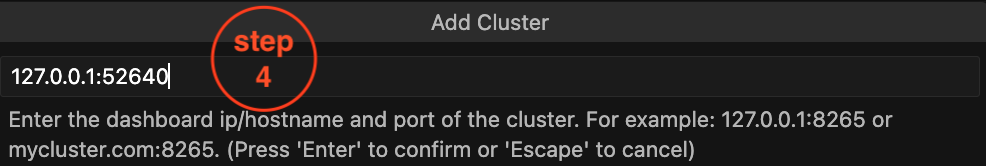
Enter the address and port you set up in the port forwarding step. If you followed the example above using port 52640, you would enter:
Add a Breakpoint and Run Your Program#
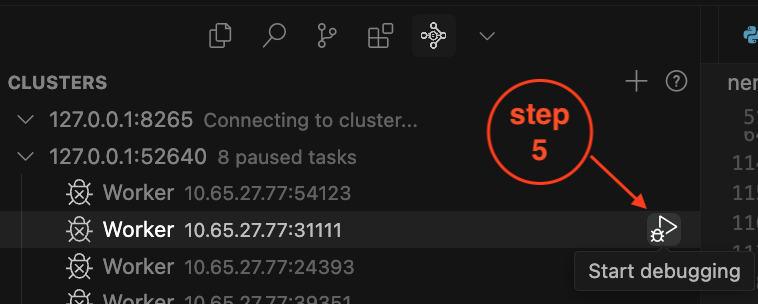
The Ray Debugger Panel for cluster 127.0.0.1:52640 lists all active breakpoints. To begin debugging, select a breakpoint from the dropdown and click Start Debugging to jump to that worker.
Note that you can jump between breakpoints across all workers with this process.
Debug with legacy Ray debugger#
To use legacy ray debugger, you can use two ways
In general, set
RAY_DEBUG=legacyand add--ray-debugger-externalto yourray startcommandIf you are using
ray.subin a slurm cluster, you can simply setRAY_DEBUG=legacybeforesbatch ray.sub, the script can detect this environment variable and attach--ray-debugger-externalautomatically.
After you start ray with these changes, you can add breakpoint to your code. When you run the program, it will stop at where breakpoints are inserted. Then you can use a separate terminal to attach to the head node via bash <JOB_ID>-attach.sh (this script should automatically be generated by ray.sub), and run ray debug to see all the breakpoints. You can enter any breakpoint and interactively debug. Please refer to Ray documentation for more info on this debugging approach.