Logger#
The logger is designed to track key training metrics (including distributed metrics with reductions and timing), as well as providing integration with logging backends like WandB, Tensorboard, MLflow and Swanlab.
Requirements#
Tracking distributed metrics with specified reductions (mean, max, etc.)
Tracking distributed timing with (usually) ‘max’ reduction across ranks
Logging:
WandB
Tensorboard
MLflow
Swanlab
Overall Design#
Since there is a single controller, the single process running the main training loop will gather the metrics and do the logging.
To handle multiple logger backends, we will have a LoggerInterface interface that the TensorboardLogger, WandbLogger, MLflowLogger and SwanlabLogger will implement:
class LoggerInterface(ABC):
    """Abstract base class for logger backends."""

    @abstractmethod
    def log_metrics(self, metrics: dict[str, Any], step: int, prefix: Optional[str]: "") -> None:
        """Log a dictionary of metrics."""
        pass

    @abstractmethod
    def log_hyperparams(self, params: dict[str, Any]) -> None:
        """Log dictionary of hyperparameters."""
        pass
A Logger wrapper class will also implement LoggerInterface and maintain a list of loggers to which it delegates writing logs. This will be the main class the user uses in the training loop. Usage example:
# Initialize logger with wandb, tensorboard, mlflow and swanlab enabled
logging_config = {
    "wandb_enabled": True,
    "tensorboard_enabled": False,
    "mlflow_enabled": True,

    "wandb": {
        "project": "grpo-dev",
        "name": "grpo-dev-logging",
    },
    "swanlab": {
        "project": "nemo-rl",
        "name": "grpo-dev-logging",
    },
    "tensorboard": {
        "log_dir": "logs",
    },
    "mlflow": {
        "experiment_name": "nemo-rl-experiment",
        "run_name": "grpo-dev-run",
        "tracking_uri": None,  # Use local tracking
    },
}
logger = Logger(
    cfg=logger_config,
)

# Log metrics, will go to all enabled backends
logger.log_metrics({
    "loss": 0.123,
}, step=10)
Supported Logging Backends#
The logger supports three main logging backends:
WandB (Weights & Biases)#
Provides cloud-based experiment tracking
Supports custom step metrics for better visualization
Includes built-in hyperparameter logging
Offers rich visualization and collaboration features
Swanlab#
Training visualization (Android, iOS, Wechat public account and Web)
Automatic logging
Hyperparameter recording
Experiment comparison
Multi-user collaboration
Tensorboard#
Local file-based logging
Standard TensorBoard visualization
Supports hyperparameter logging via HParams
Lightweight and self-contained
MLflow#
Comprehensive platform for experiment tracking and model management
Supports both local and remote tracking servers
Provides model versioning and artifact management
Includes a web UI for experiment visualization
Supports model deployment and serving
MLflow Configuration#
MLflow can be configured with the following parameters:
mlflow:
  experiment_name: "nemo-rl-experiment"  # Name of the MLflow experiment
  run_name: "my-training-run"            # Run name
  tracking_uri: "http://localhost:5000"  # Optional tracking server URI
Warning
Using MLflow’s default file-based backend (for example, the mlruns/ directory store) is not recommended for NeMo RL.
NeMo RL logs hierarchical metric names such as timing/train/policy_training and
timing/train/policy_training/sharding_data. With MLflow’s file-based backend, / is treated
as a path separator, which can lead to file-versus-directory conflicts and raise
IsADirectoryError.
If you want to use a local filesystem-backed MLflow store, prefer a SQLite backend instead of the default file store. For example:
mlflow:
  experiment_name: "nemo-rl-experiment"
  run_name: "my-training-run"
  tracking_uri: "sqlite:////path/to/mlflow.db"
This keeps the tracking data on the local filesystem while avoiding the metric name path collisions that can happen with the file-based backend.
MLflow UI#
After starting training with MLflow enabled, you can view the MLflow UI to monitor your experiments:
# Start MLflow UI (run in a separate terminal)
mlflow ui --host 0.0.0.0 --port 5000
If you are using SQLite as the MLflow backend, point the UI at the same database file:
mlflow ui --host 0.0.0.0 --port 5000 --backend-store-uri sqlite:////path/to/mlflow.db
Then access the UI at http://127.0.0.1:5000/ to view:
Training runs and experiments
Metrics (loss, validation metrics, etc.)
Hyperparameters
Model artifacts and checkpoints
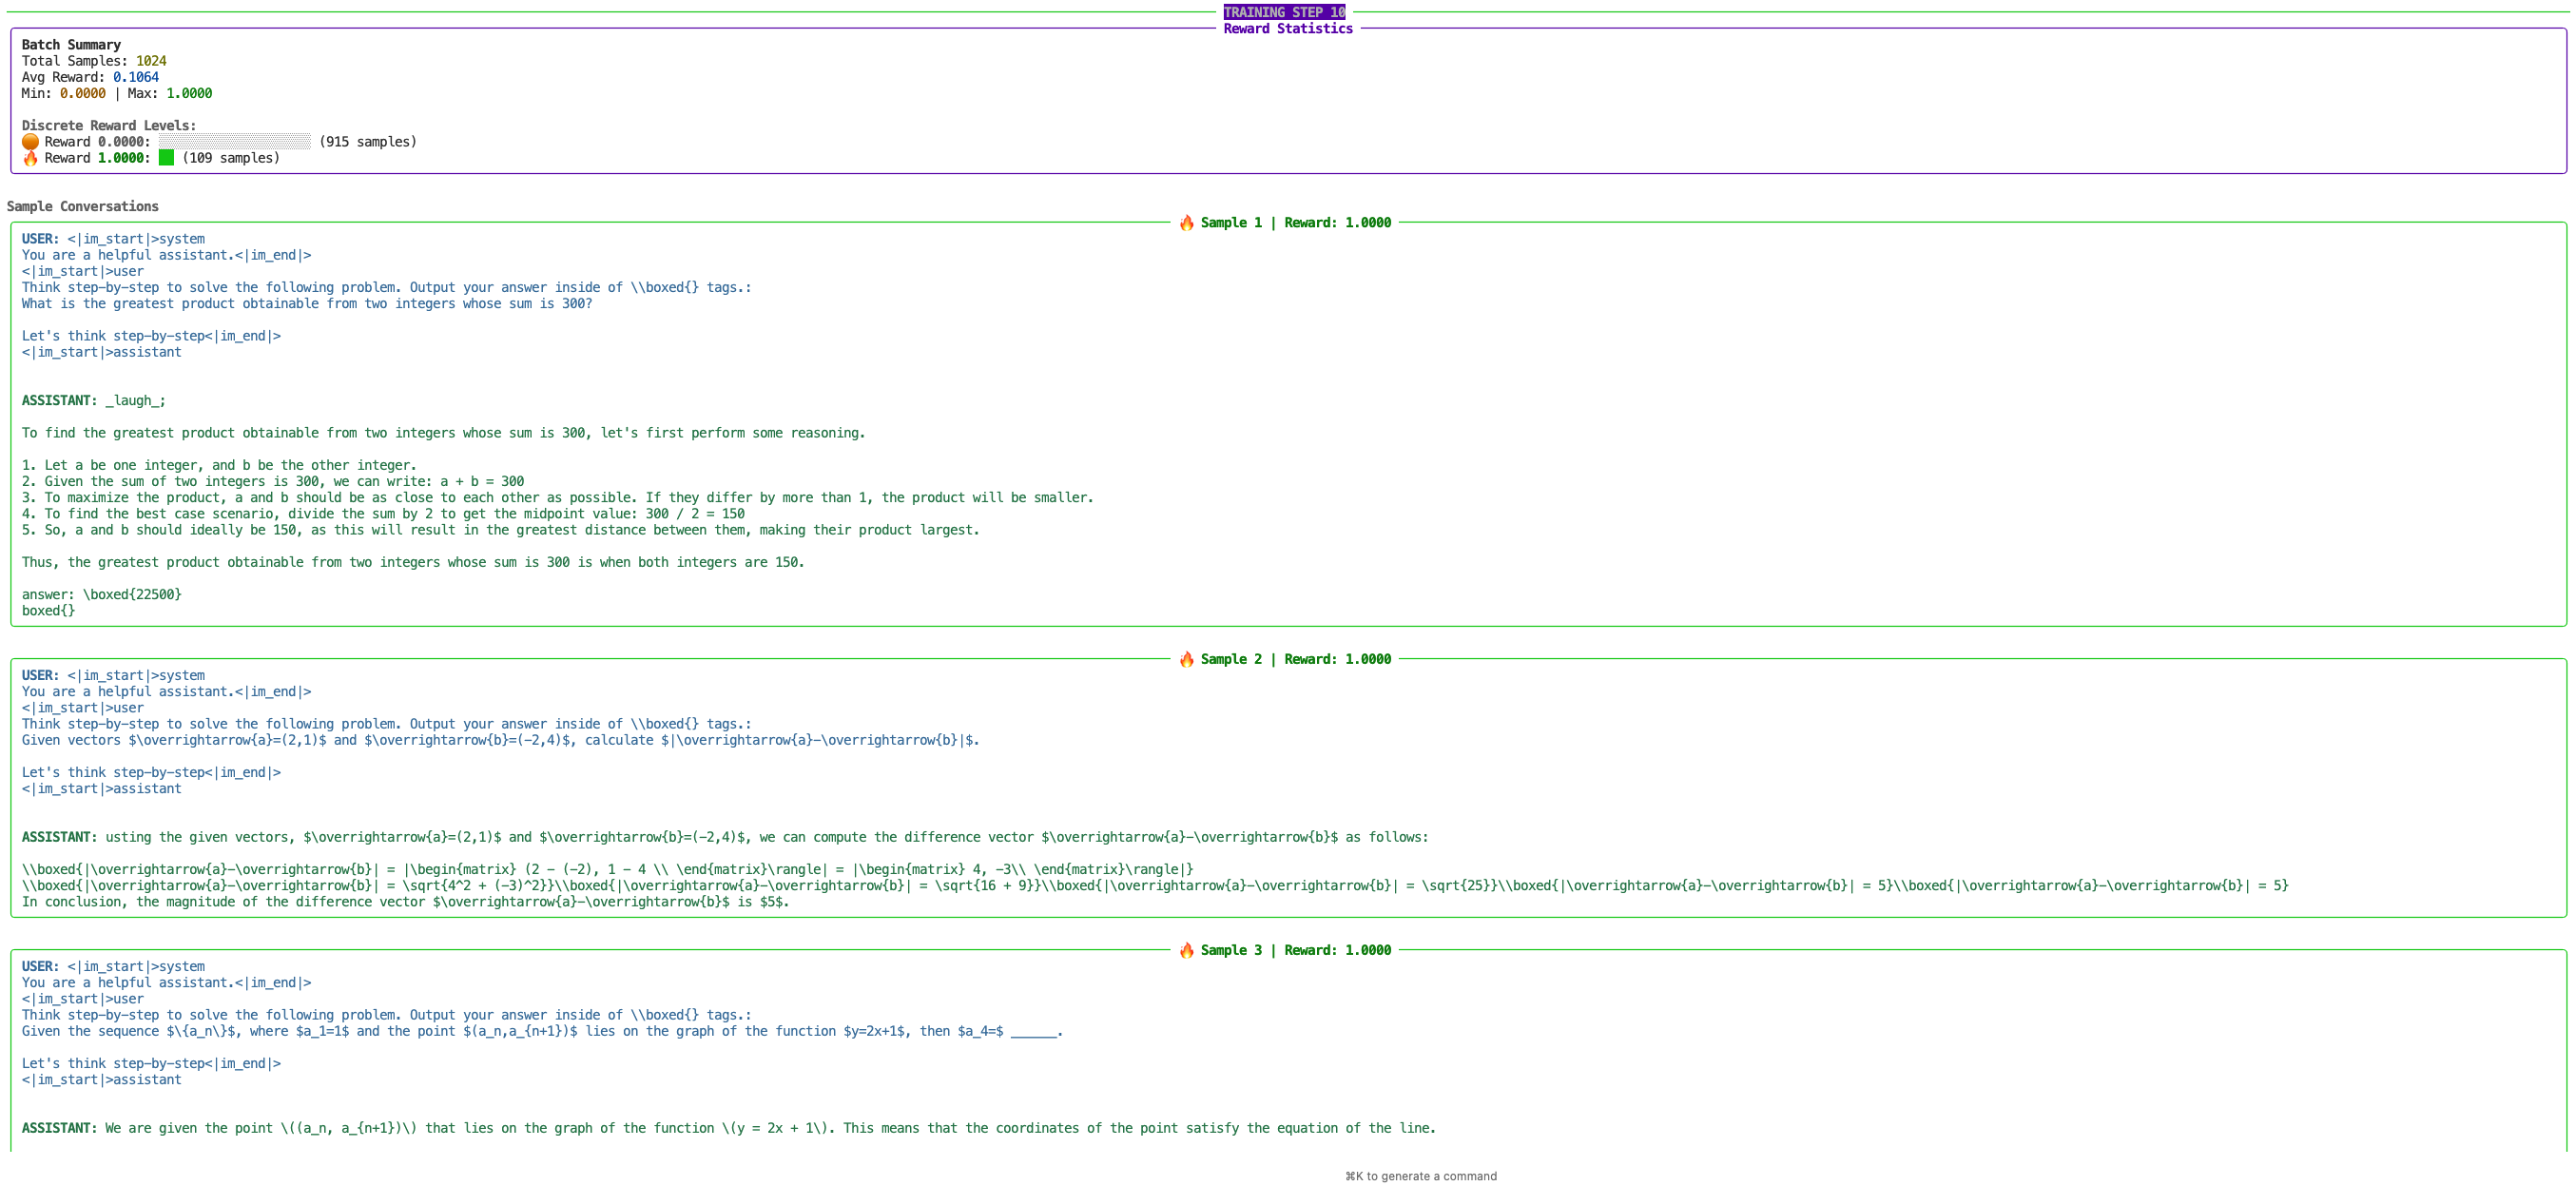
Validation Pretty Logging#
The logger supports pretty-formatted logging of validation samples to help visualize model outputs during training. This feature is controlled by the num_val_samples_to_print configuration parameter.
logger:
  wandb_enabled: false
  swanlab_enabled: false
  tensorboard_enabled: false
  mlflow_enabled: false
  num_val_samples_to_print: 10
When num_val_samples_to_print is set to a value greater than 0, the logger will generate well-formatted text outputs for the specified number of validation samples. This is particularly useful for:
Quickly inspecting model generation quality during training.
Comparing inputs and outputs side-by-side.
Tracking validation sample performance over time.
Example Output#
When enabled, the pretty logging will generate formatted text similar to:
GPU Metric Logging#
NeMo RL monitors GPU memory and utilization through system metrics exposed by Ray nodes. While Ray makes these metrics available for tools like Prometheus, NeMo RL directly polls GPU memory and utilization data and logs them to TensorBoard, WandB, MLflow and/or SwanLab.
This approach allows us to offer the same GPU metric tracking on all loggers and simplifies the implementation greatly.
This feature is enabled with the monitor_gpus configuration parameter. The frequency of data collection and flushing to the loggers is controlled by the gpu_collection_interval and gpu_flush_interval parameters, both specified in seconds.
logger:
  wandb_enabled: false
  swanlab_enabled: false
  tensorboard_enabled: false
  mlflow_enabled: false
  monitor_gpus: true
  gpu_monitoring:
    collection_interval: 10
    flush_interval: 10
Note
While it is feasible to monitor using remote workers, the implementation requires careful attention to details to ensure:
Logs sent back to the driver do not introduce significant overhead.
Metrics remain clear and interpretable, avoiding issues like double counting caused by colocated workers.
Workers can gracefully flush their logs in case of failure.
Logging behaves consistently across TensorBoard, WandB, MLflow and Swanlab.
Workers that spawn other workers accurately report the total resource usage of any grandchild workers.
Due to these complexities, we opted for a simpler approach: collecting metrics exposed by the Ray metrics server from the driver.