Test Findings#
Note
Details on the RTX PRO 6000 Blackwell Server Edition, including 3B vGPU profiles and results from the new Login Enterprise powered by NVIDIA nVector benchmark, are coming soon. Review this blog post for more details on the integration of Login Enterprise and NVIDIA nVector.
Single VM Multi-Monitor Resolution Test Results#
The following table summarizes the results of single VM testing configurations, where we explored the impact on frame buffer (FB) for higher resolution and multi-monitor scenarios based upon the nVector Knowledge Worker (KW) workload. As monitor resolutions continue to increase, more pixels are being delivered to the screen. As a result, the frame buffer usage in a virtual environment increases. While HD (1920x1080) is currently the most common resolution, an increasing number of devices are being released with higher resolution screens.
Resolution |
Monitors |
A16 vGPU Profile |
|---|---|---|
High Definition 1920x1080 |
1 |
1B |
High Definition 1920x1080 |
2 |
2B |
Quad High Definition 2560x1440 |
2 |
2B |
Quad High Definition 2560x1440 |
3 |
2B |
4K 4096x2160 |
1 |
2B |
4K 4096x2160 |
2 |
2B |
5K 5120x2880 |
1 |
2B |
Tip
Based upon benchmark testing, test your workloads to ensure FB sizing is appropriate for your users.
Knowledge worker workloads will vary per user depending on many factors, including use of multiple applications, the types of applications utilized, file sizes, in addition to the number of monitors and their resolution. Additional monitor and resolution support, including mixed displays, can be found here. It is highly recommended that you test your workloads during a POC since mileage may vary. Our nVector test results should be used for guidance purposes only.
Important
The nVector Knowledge worker workload is designed to simulate heavy usage scenarios using the typical productivity Apps where all the concurrent users are actively using the system resources simultaneously. These results are meant to give administrators an outline with which to plan POC deployments. Workloads within your environment might be less resource intensive than the nVector knowledge workload.
The results of Single VM frame buffer analysis results are used for sizing purposes since the maximum number of vGPUs that can be created (and then assigned to a VM) is defined by the amount of GPU memory per VM. The following sections describe the frame buffer usage captured on the VM for the nVector KW workload.
High Definition (1920x1080) Displays#
With GPU-enabled instances, increasing the number of monitors results in the delivery of more pixels to the screen. Our nVector KW workload reported an average 15% increase in FB Usage when monitors were increased from 1 to 2. The following graphs demonstrate the framebuffer utilization on single and dual HD monitors while a nVector KW workload was executed:
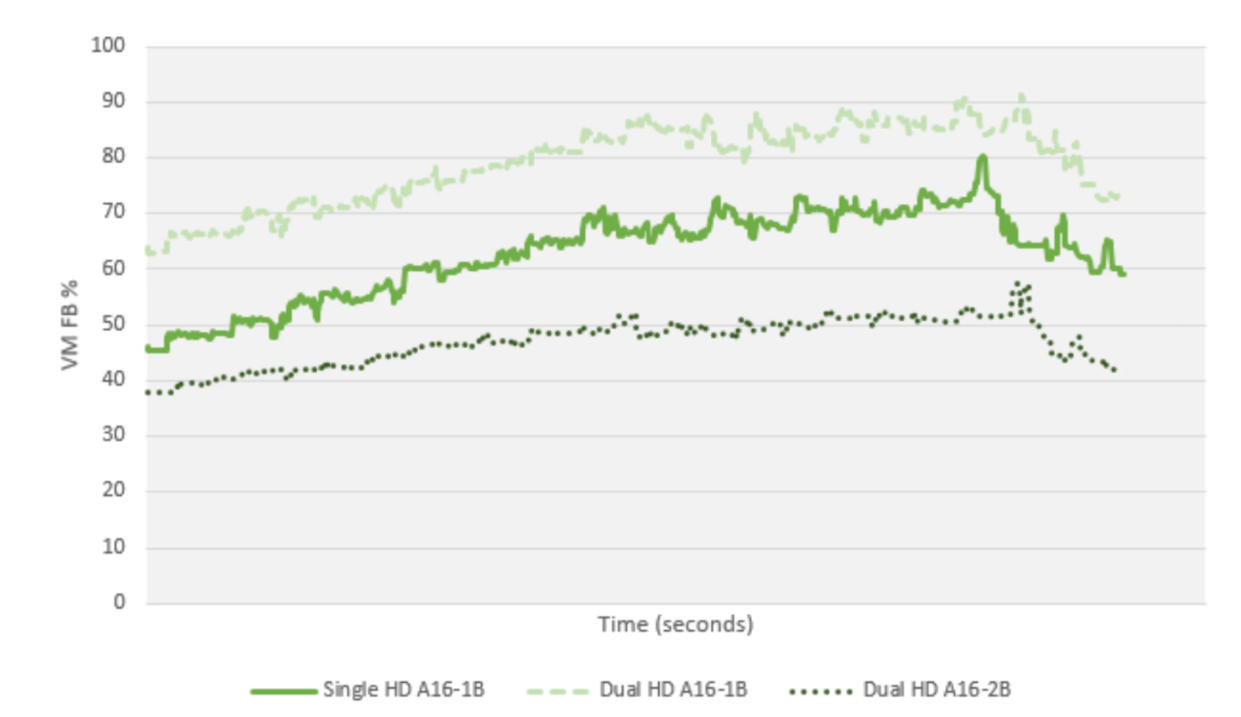
Figure 8 High Definition (1920x1080) Displays#
Quad High Definition (2560x1440) Displays#
Quad High Definition (2560x1440) resolution tests were executed using 2, 3, and 4 monitors. Quad high definition (QHD) has almost double as many pixels as HD; therefore, FB requirements for QHD monitors are greater than HD. Overall, our nVector test results for the KW workload illustrate that the 2B profile was sufficient for 2 QHD monitors. When monitors were increased from 2 to 3, there was a 15% increase in FB usage. The 2B profile provided an adequate amount of FB for 2 and 3 QHD monitors. The following sections portray our test findings with nVector.
The following graph illustrates the frame buffer usage captured while executing the nVector KW workload on dual QHD monitors:
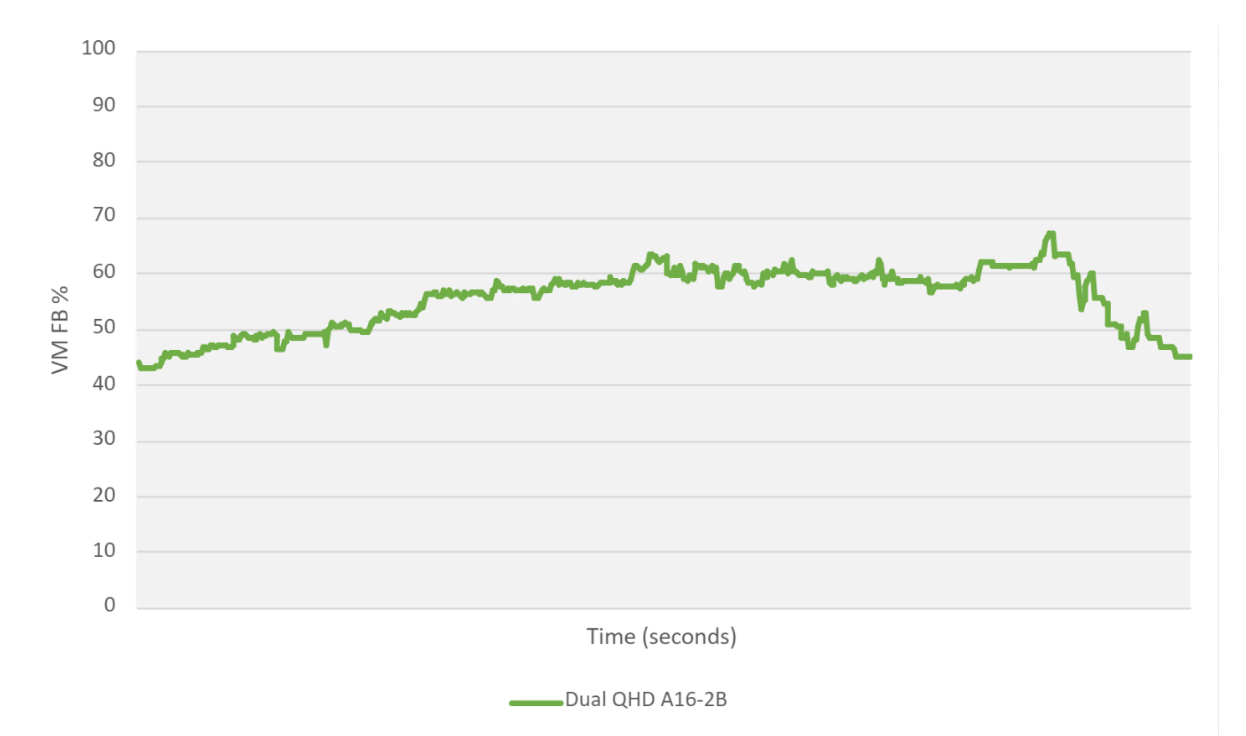
Figure 9 Dual QHD Monitor Test Results#
The following graph illustrates the impact on frame buffer when monitors are increased from 2 to 3 QHD monitors in separate nVector KW workload tests:
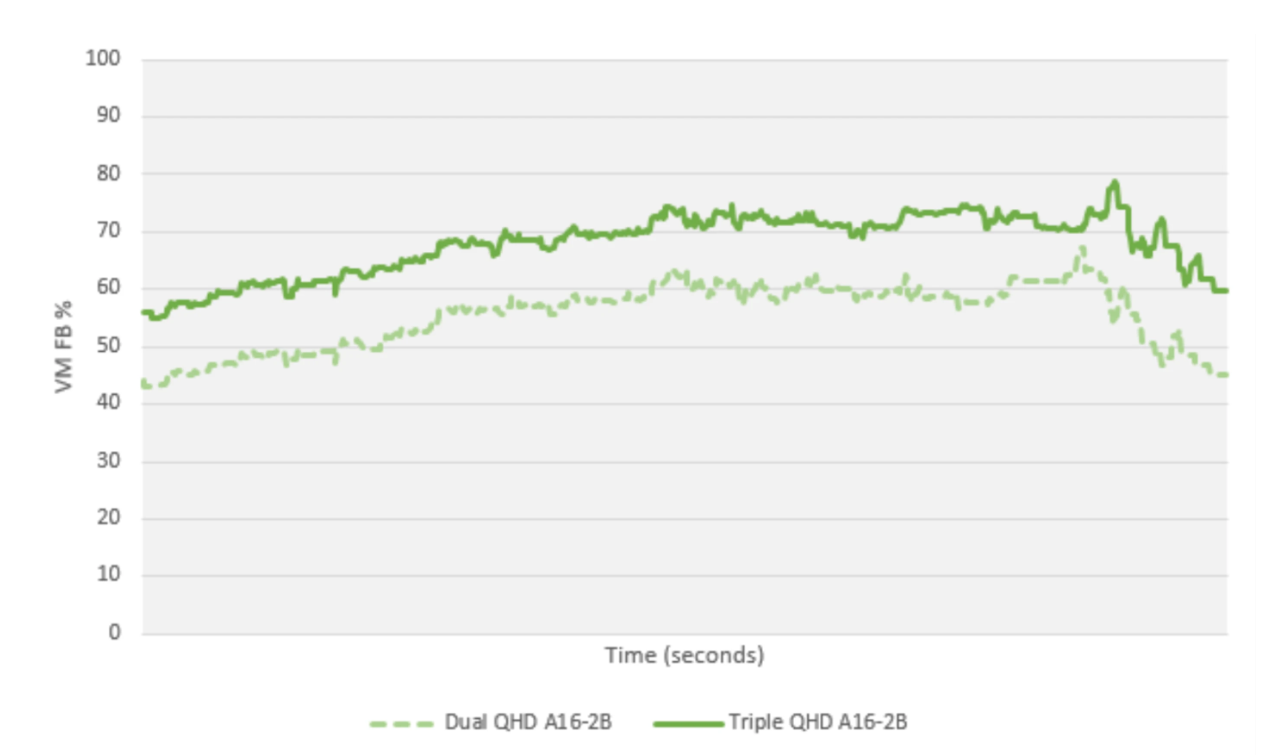
Figure 10 Triple QHD Monitor Test Results#
4K (4096x2160) Displays#
Tests were executed using a single 4K monitor as well as a dual 4K monitor. The nVector KW workload test results illustrated that a 2B vGPU profile for a single 4K monitor was sufficient; however, it certainly utilized the FB. Based upon this information, when the number of monitors was increased to two 4K monitors, admins will need to best determine whether a 2B profile can support Dual 4K displays at desired performance levels.
The following graph illustrates the FB usage of the nVector KW workload using the 2B profile for a single 4K monitor:
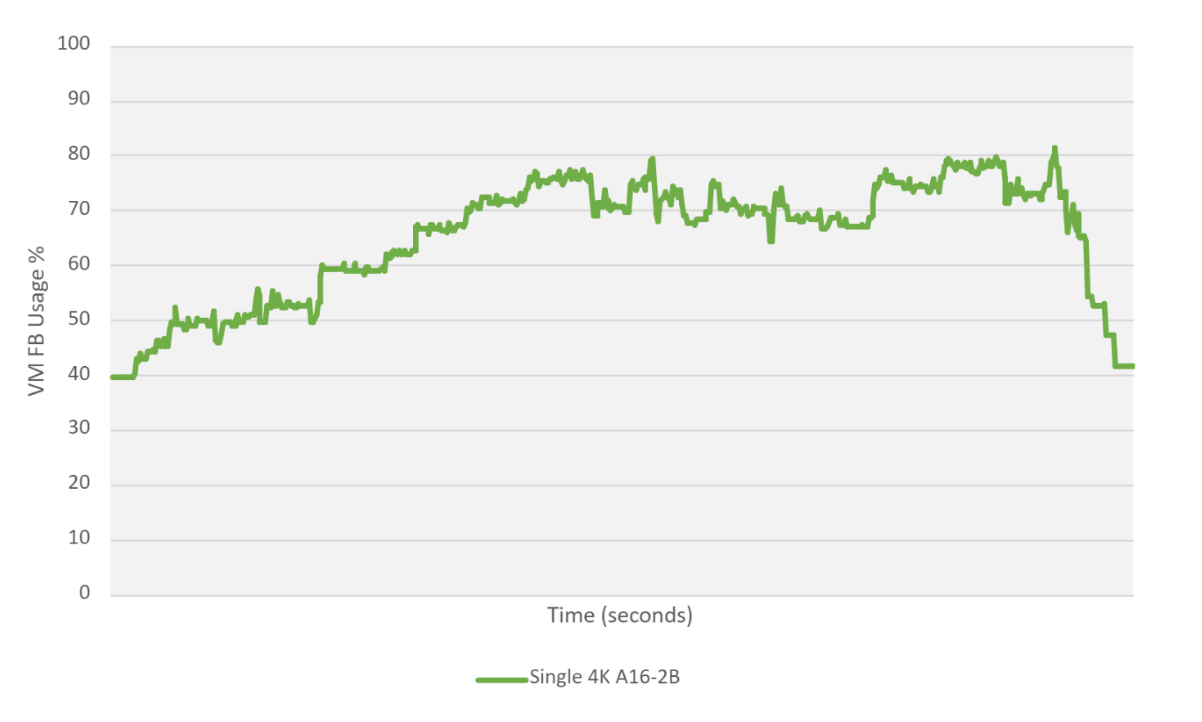
Figure 11 Single 4K Monitor Test Results#
The following graph illustrates the FB usage of the nVector KW workload using the 2B profile for a Dual 4K monitor configuration:
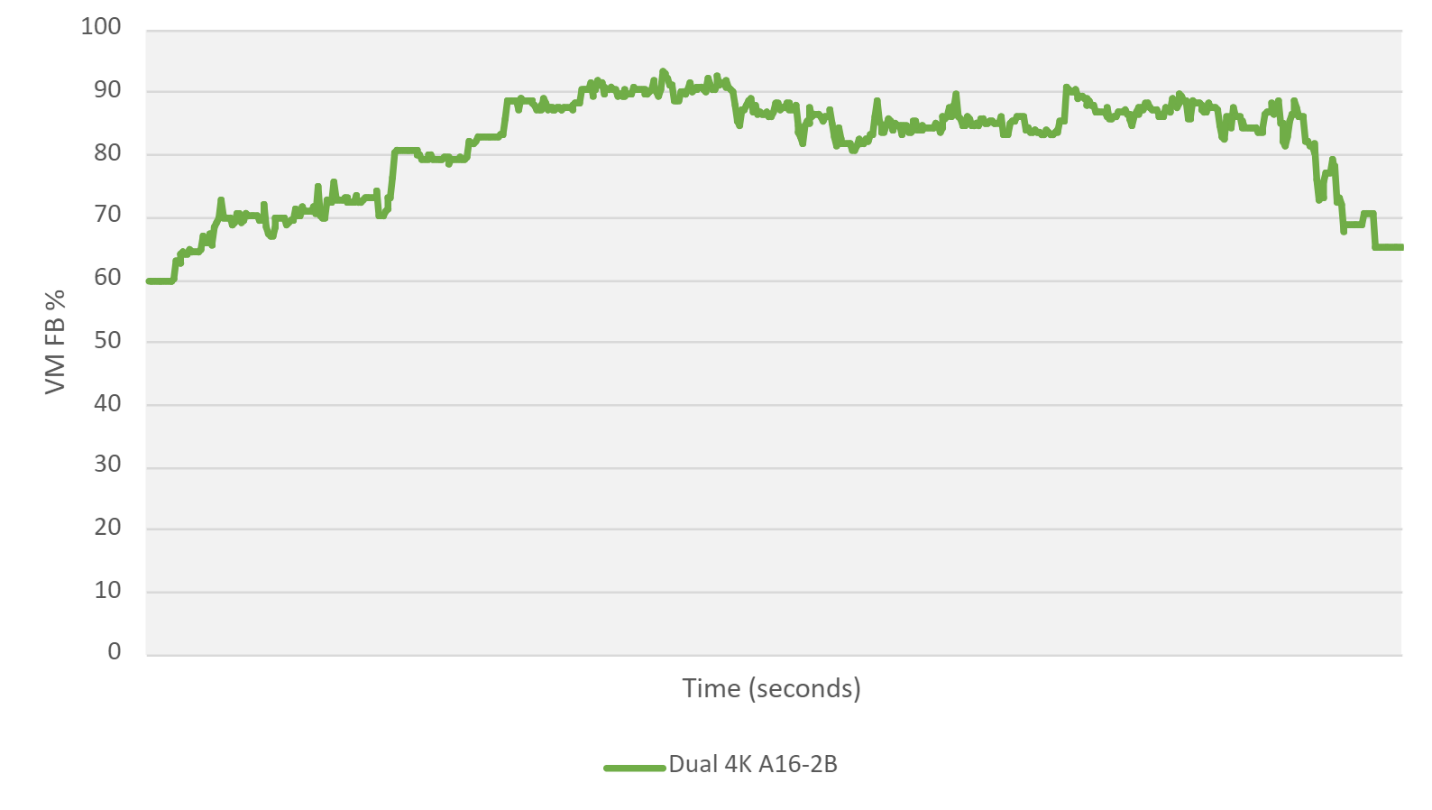
Figure 12 Dual 4K Monitor Test Results#
Running an nVector Knowledge Worker workload with dual 4K displays almost saturates the GPU frame buffer.
5K (5120x2880) Display#
NVIDIA vPC supports only a single 5K monitor, and for our nVector KW workload, the 2B vGPU profile was chosen based upon the known FB requirements of 5K resolution. 5K displays have a resolution of about seven times the pixels than high-definition displays (1920x1080). The following graph illustrates FB Usage for the nVector KW workload:
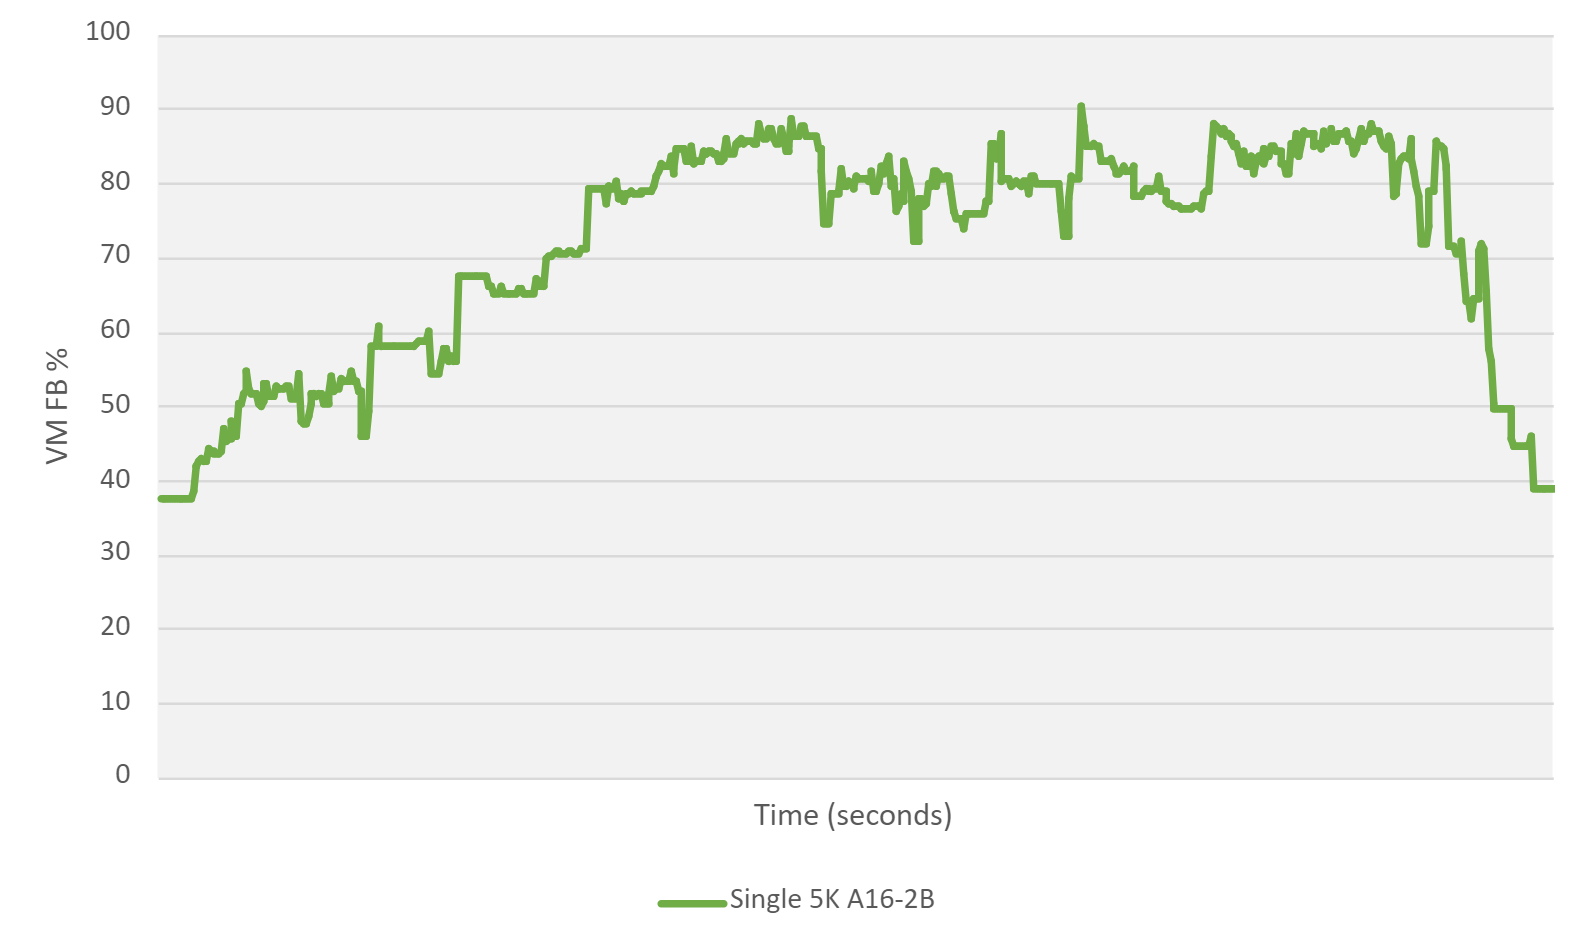
Figure 13 5K (5120x2880) Display#
Single VM Multi-Monitor Resolution Summary#
To recap, it is important to remember when sizing your environment, that a common practice to follow is that frame buffer utilization should not exceed 90% for a short time or an average of over 70% on the 1GB (1B) profile. If high utilization is noted, the vPC VM should be assigned a 2GB (2B) profile. In addition, when deciding whether to increase monitors for your configuration, our nVector KW workload reported an average 15% increase in FB Usage when monitors were increased from 1 to 2.
For a single HD or Dual HD configuration, the A16-1B will be adequate for most knowledge workers. However, if an A16-1B profile is not meeting organizational needs for a Dual HD configuration, switching to the A16-2B profile will be adequate.
Quad high definition (QHD) has almost double as many pixels as HD; therefore, FB requirements for QHD monitors are greater than HD. For QHD configurations our nVector test results show that the 2B profile was sufficient for 2 and 3 QHD monitors.
For a single 4K configuration, the 2B profile was sufficient however, it certainly utilized the FB. Based upon this information, when the number of monitors was increased to two 4K monitors, admins will need to best determine whether a 2B profile can support Dual 4K displays at desired performance levels given user application utilization.
With a single 5K monitor, an A16-2B profile can be utilized, however it should be noted again that admins will need to conduct internal testing to see if a single 5K monitor can support their respective workloads.
Important
The nVector Knowledge worker workload is designed to simulate heavy usage scenarios using the typical productivity apps where all the concurrent users are actively using the system resources simultaneously. These results are meant to give administrators an outline with which to plan POC deployments. Workloads within your environment might be less resource intensive than the nVector knowledge workload.
Multi-VM Scalability Test Results#
Running a single VM on a large environment does not allow you to capture the usage of a production environment. Since full HD is currently the most common resolution, our scalability testing results within this document focus on dual HD (1920x1080) monitors. It is highly recommended that you test your workloads during a POC for the most accurate results. Our nVector test results should be used for guidance purposes only.
For our server utilization testing, the scale was configured for 64 VMs on the ESXi host with an NVIDIA L4, contrasting CPU core utilization versus GPU utilization to show CPU offload with an NVIDIA GPU.
Important
The overall framebuffer footprint is larger on the newer architecture, leading Ada to have a larger footprint than Turing. The increase in the default CUDA buffer size for Ada, driven by a higher number of TPCs and SMs, results in elevated requirements for framebuffers. Therefore, conducting a POC is necessary to gain a better understanding of the performance, the needed profile, the VM scaling, and overall fit.
To showcase the user experience, tests were performed using identical CPUs and server configurations. The tests involved a 128 VM test with two NVIDIA A16 GPUs and a 64 VM test with three NVIDIA L4 GPUs. According to nVector’s user experience metrics, the 128 VM test with two A16 GPUs exhibited performance metrics similar to the 64 VM test with three L4 GPUs. Maintaining an identical CPU, the NVIDIA A16 effectively doubled our density while ensuring a consistent user experience comparable to the previous generation NVIDIA L4.
The following table summarizes the multi-monitor high-resolution test environment as well as how many NVIDIA GPUs were used for each scalability test:
of VMs at Scale |
GPUs Cards |
vGPU Profile |
Monitor Resolution |
of Monitors |
|---|---|---|---|---|
64 |
3 |
L4-1B |
1920x1080 |
2 |
128 |
2 |
A16-1B |
1920x1080 |
2 |
During this process, the benchmark was used to execute various nVector KW workflows across multiple VMs with start and end times staggered across the environment.
Server Utilization Metrics#
Choosing the correct CPU for virtualization and proper configuration can directly affect scalability even when a virtual GPU is present. Processor resources are often hyper-threaded and overprovisioned to a certain degree. In terms of CPU specs, you should evaluate the number of cores and clock speed. The following paragraphs describe our test findings when using 64 VMs:
The following graph illustrates CPU Core utilization using an Intel Xeon Gold 6338 3.2 GHz Turbo (Ice Lake) for 64 VMs. This server configuration has 64 cores with hyperthreading enabled.
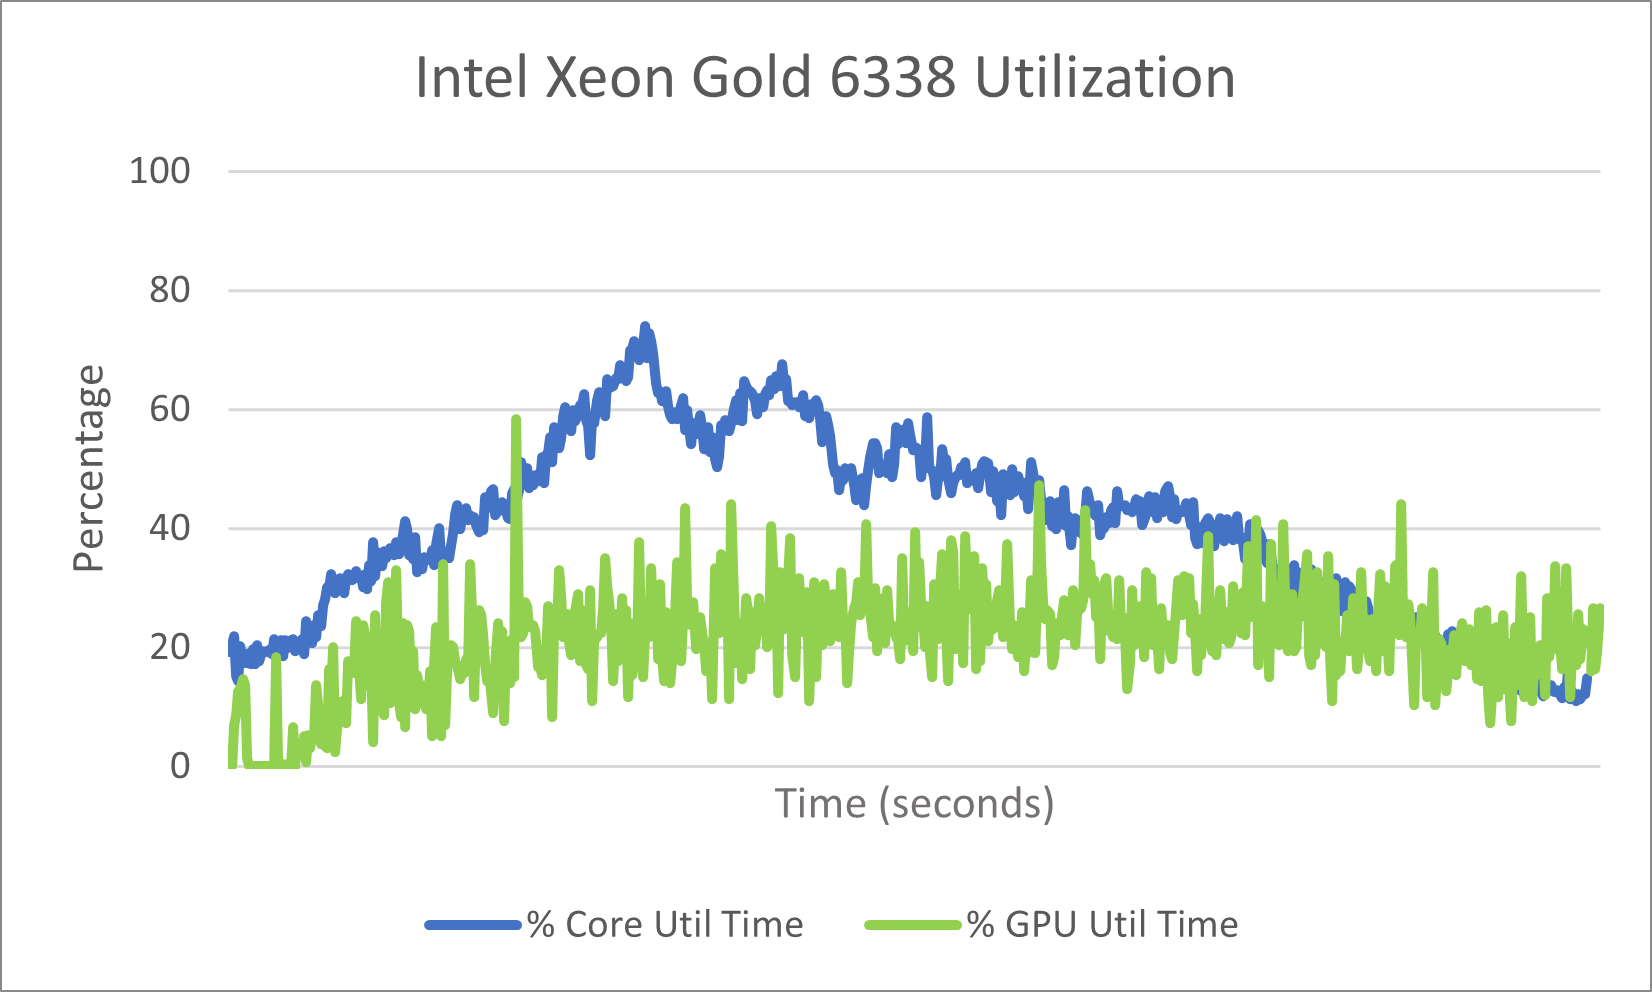
Figure 14 Server Utilization Metrics#
This graph of the 64 VM L4 test shows that as the GPU utilization ramps up during the nVector KW workload test, CPU Core utilization is offloaded and drops accordingly.
nVector User Experience Metrics#
To further assess the trade-offs between end-user experience and resource utilization, we used nVector’s built-in mechanisms to measure user experience. The following sections describe our findings for the nVector KW workload for a 128 A16 vPC VM test contrasted with a 64 L4 vPC VM test using identical server specs and CPU’s.
Our results show a consistent user experience and performance across both the NVIDIA A16 and NVIDIA L4, however the NVIDIA A16 has doubled our density in the server to 128 VM’s.
Frame Rate#
The nVector benchmark tool captures frame rate, which provides an excellent metric in determining the end-user experience. Providing a consistent and high frame rate can lead to a smoother experience for the user, while an inconsistent frame rate will create a less than acceptable experience.
The following graph illustrates the frame rate differences for Dual High Definition 1920x1080 monitors while running the nVector KW workload. The average frame rates were nearly identical between the NVIDIA A16 and NVIDIA L4, with a slight edge going to the A16.
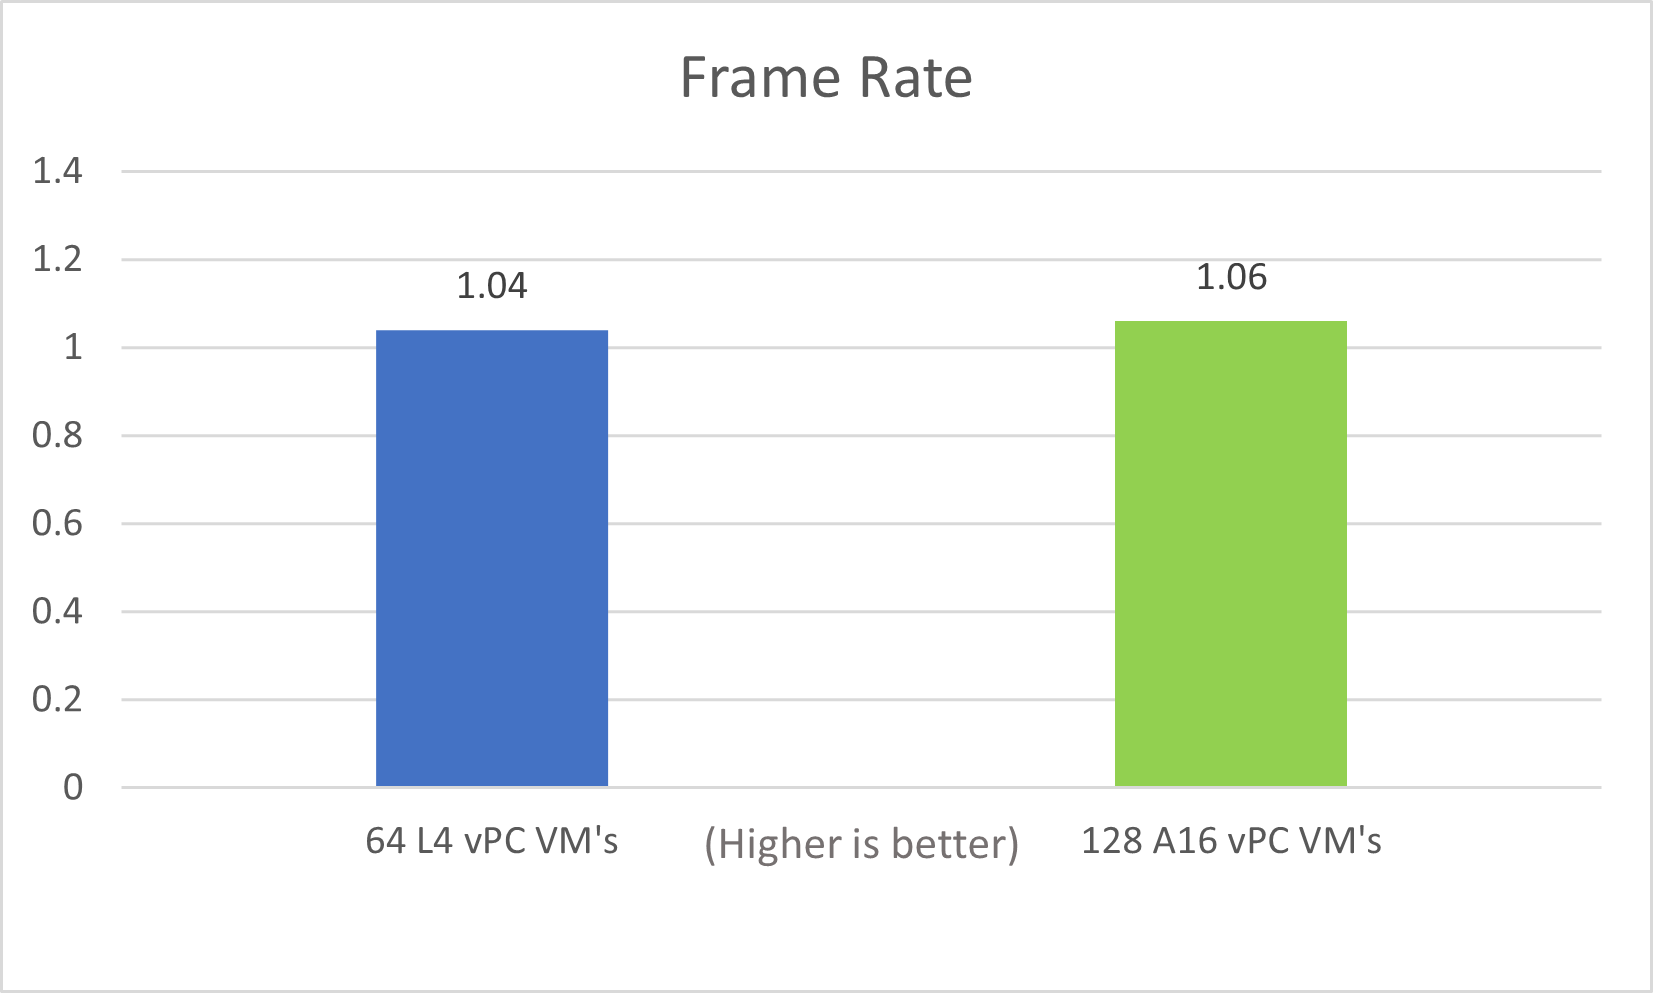
Figure 15 Frame Rate#
Latency Metrics#
Another critical metric captured by the nVector benchmark tool is latency or, in this case, end-user latency. Latency can affect mouse speed, characters showing up on the screen behind what is typed, and poor video playback.
The following graph illustrates end-user latency for Dual High Definition 1920x1080 monitors while running the nVector KW workload. User latency had a 8 percent increase with the A16 when compared with the L4. However, the NVIDIA A16 was able to double our density within the server. Striking a balance between performance and density is best determined by admins when conducting an internal POC to appropriately address the needs of the organization.
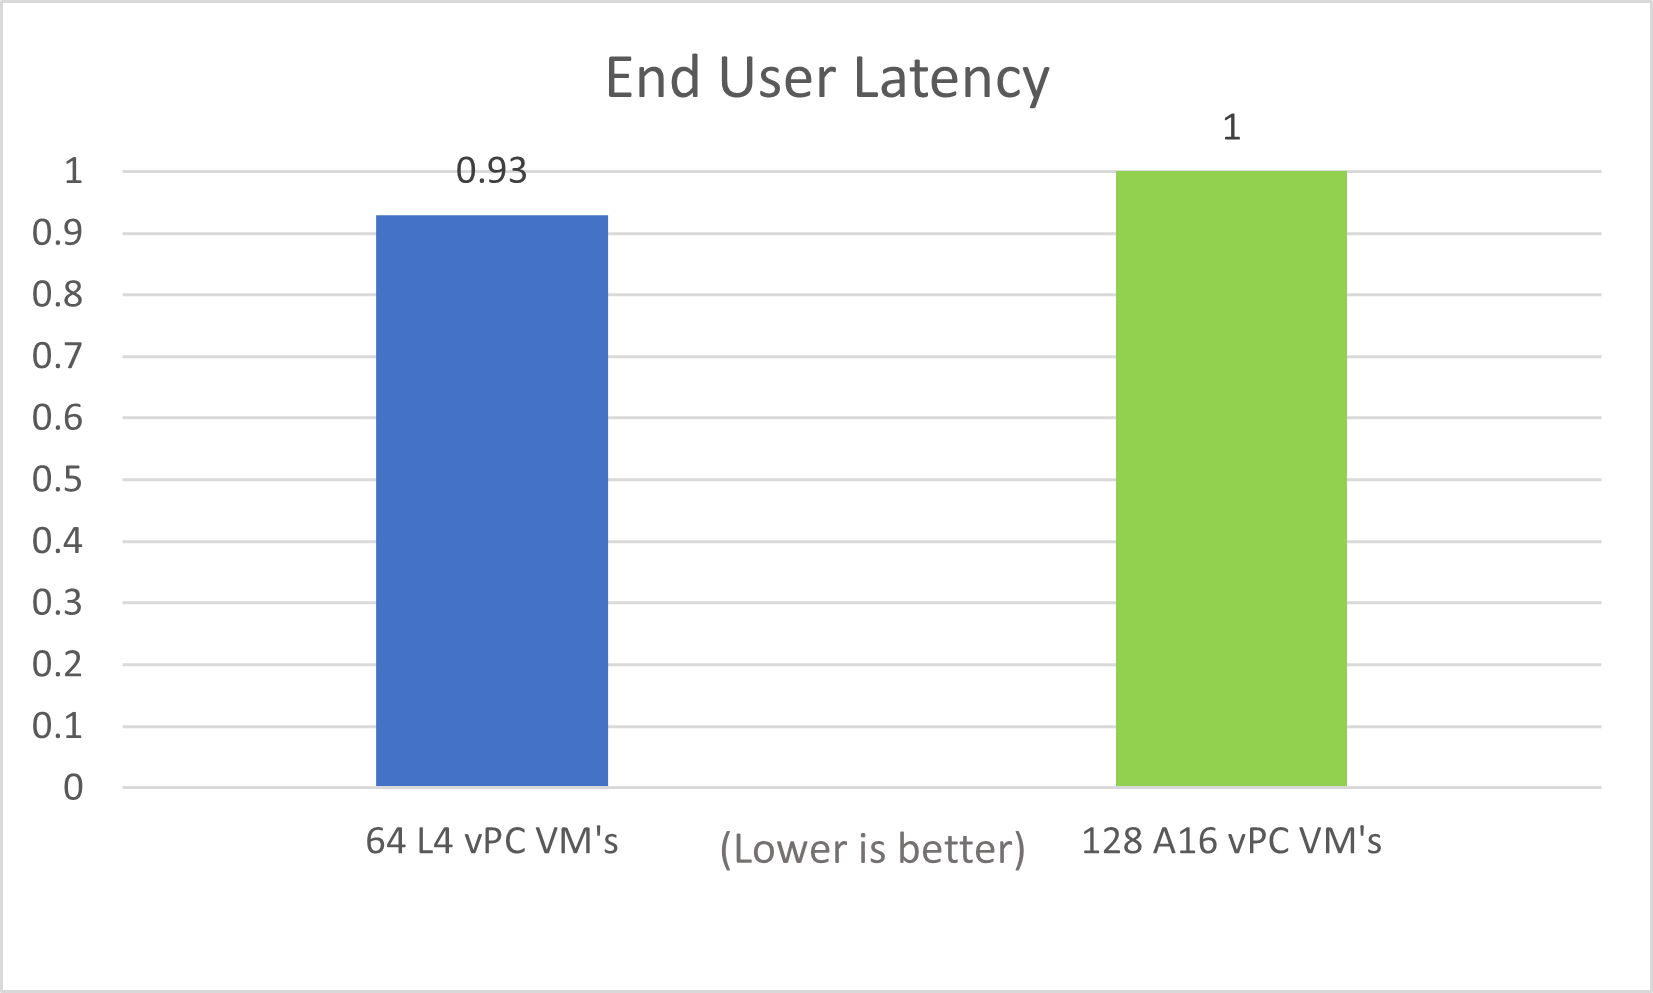
Figure 16 End User Latency#
Encoder Utilization#
The encoder utilization is a critical metric that reflects the efficiency of your encoder in processing data. In our testing with both NVIDIA L4 and NVIDIA A16, using the nvector benchmarking tool, we observed that the encoder utilization remained consistently within a good range for both 64 VM and 128 VM tests. The graph illustrates that the results between L4 and A16 are nearly identical, indicating that the encoder utilization is well-optimized for both configurations. This uniformity suggests that, regardless of whether the specific hardware model is L4 or A16, the encoder is effectively handling the processing load, providing reliable and comparable performance across different scenarios.
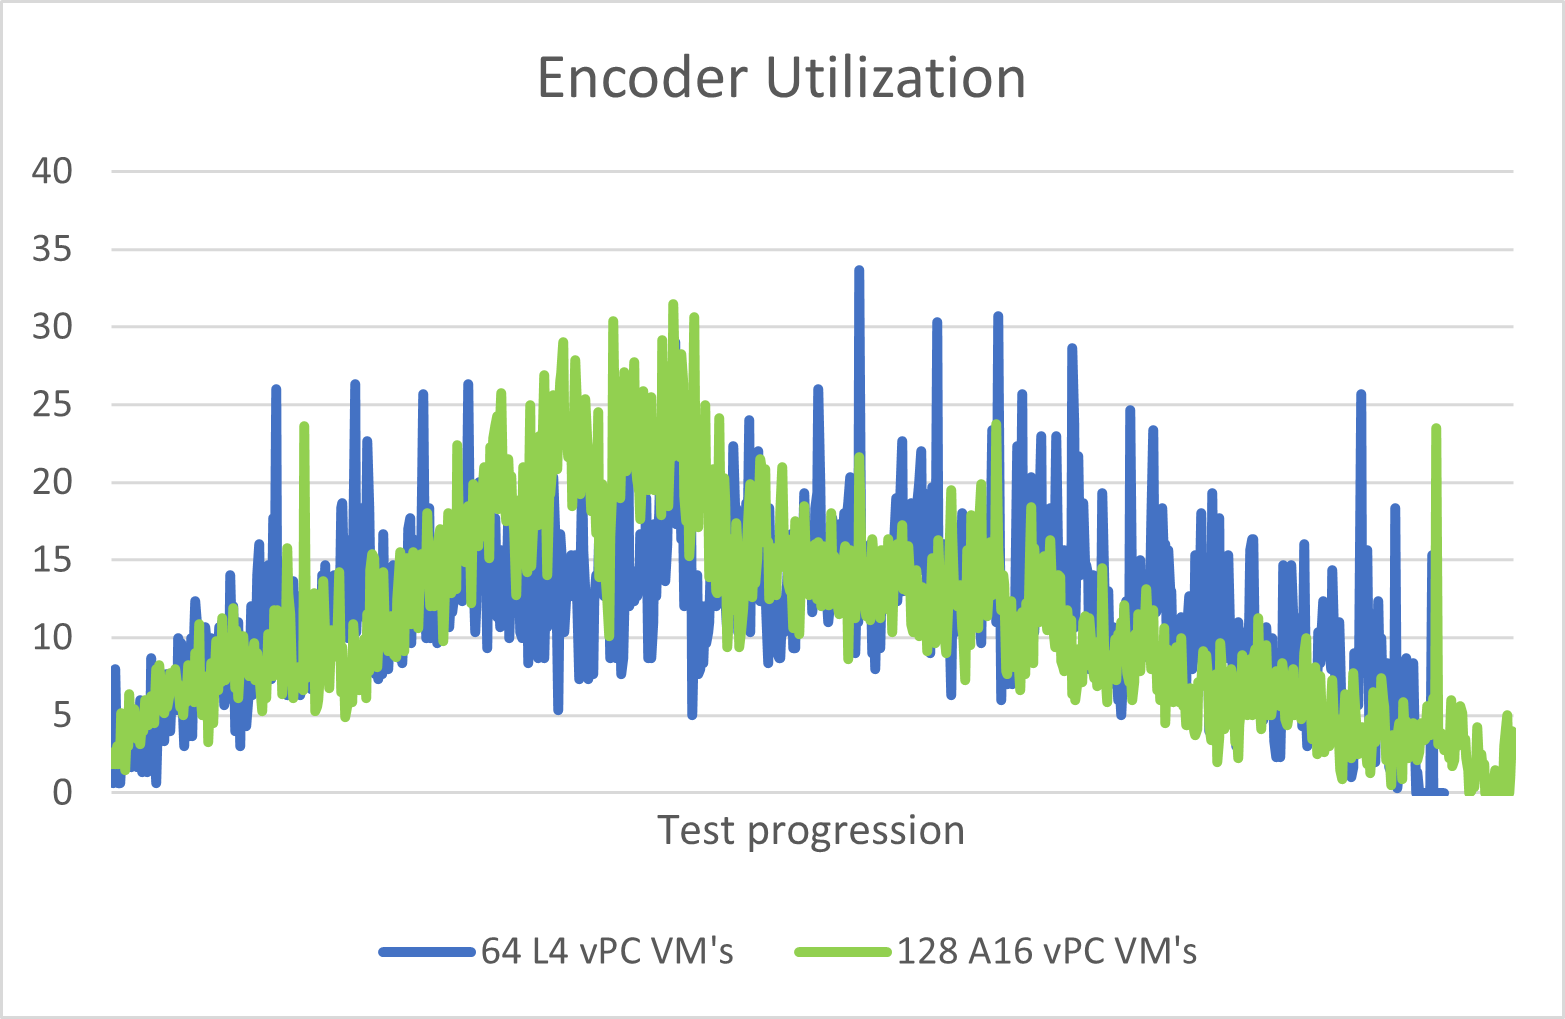
Figure 17 Encoder Utilization#
Image Quality#
The nVector benchmark tool calculates image quality. It is determined by the remoting protocol, the configuration, and policies set in the VDI environment (please refer to Appendix A regarding the configuration used within our testing). Poor image quality, under 0.90, can cause issues with text display, line sharpness, and other graphical issues.
Our nVector testing illustrates that GPU-accelerated VMs with vPC deliver uncompromised image quality as SSIM of the screen capture using Dual High Definition 1920x1080 monitors. Both the NVIDIA A16 and NVIDIA L4 tests for vPC VMs reported higher than the 0.90 thresholds at an exceptional 0.98 SSIM.
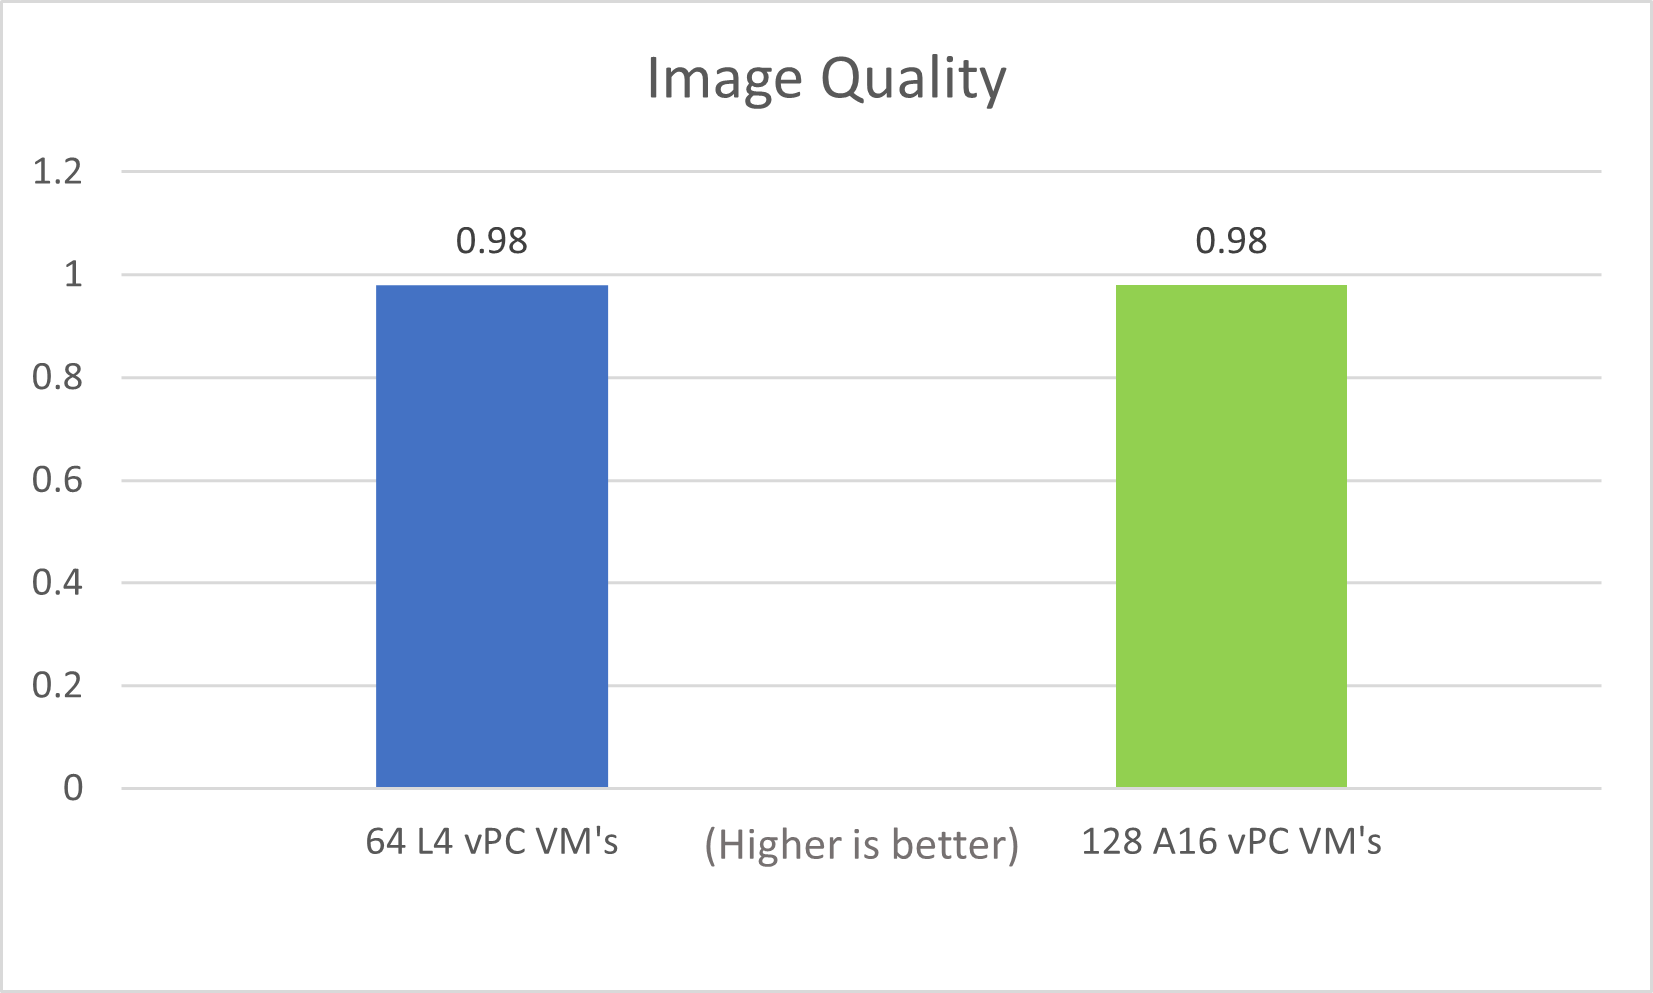
Figure 18 Image Quality#
Multi-Monitor Resolution Scalability Summary#
To recap our multi-monitor resolution scalability tests, we used identical CPUs and server configurations for a 128 VM test with two NVIDIA A16s contrasted against a 64 VM test with four NVIDIA L4s. User experience metrics such as framerate, end-user latency, and image quality were noted to have similar performance levels in the NVIDIA A16 when compared to the NVIDIA L4. However, with an identical CPU, the NVIDIA A16 effectively doubled our density while providing a consistent user experience in line with the next generation NVIDIA L4.
During the 64 VM L4 test to assess CPU offload by the GPU, GPU utilization was effectively shown to ramp up during the nVector workload in tandem with the CPU Core utilization being offloaded and dropping accordingly.
Admins should expect to reliably scale an NVIDIA-Certified with 2x NVIDIA A16s to 128 VMs while using a Dual HD configuration for optimal density. In addition, admins should expect similar performance with 4x NVIDIA L4s in combination with an NVIDIA Certified Server in a Dual HD configuration scaling to 64 VMs.