Testing Methodology and Findings#
Methodology#
Note
More details on the new Login Enterprise powered by NVIDIA nVector benchmark, are coming soon. Review this blog post for more details on the integration of Login Enterprise and NVIDIA nVector.
Single VM Testing#
The first phase of testing explored the impact of higher resolution and multi-monitor scenarios.
Important
The nVector Knowledge worker workload is designed to simulate peak usage scenarios using the typical productivity apps where all the concurrent users are actively using the system resources simultaneously. These results are meant to give administrators an outline with which to plan POC deployments. Workloads within your environment might be less resource intensive than the nVector knowledge workload.
Test Metric - Framebuffer Usage#
Frame buffer utilization is based upon many factors, including application load, monitor configuration, and screen resolution. Since our test focuses on the impact of higher resolutions and multi-monitor scenarios, frame buffer utilization is a critical test metric.
Scalability Testing#
Typical VDI deployments have two conflicting goals: Achieving the best possible user experience and maximizing user density on server hardware. Problems can arise as density is scaled up because it can negatively impact user experience after a certain point. Scalability testing used nVector to execute tests at scale on 64 and 128 VMs while leveraging dual HD (1920x1080) monitors. Capacity planning for the server is often dependent upon server resource utilization metrics and user experience. This testing phase examined both, and the following sections summarize their importance and how to analyze these metrics. The GPU Profiler is a commonly used tool that can quickly capture resource utilization while a workload is being executed on a virtual machine. More information on the GPU Profiler is available in this section.
Server Utilization Metrics#
Observing overall server utilization will allow you to assess the trade-offs between end-user experience and resource utilization. To do this, monitoring tools periodically sample CPU core and GPU utilization during a single workload session. To determine the ‘steady state’ portion of the workload, samples are filtered, leaving out when users have all logged on, and the workload ramps up and down. Once a steady state has been established, all samples are aggregated to get the total CPU core utilization on the server.
The utilization of the GPU compute engine, the frame buffer, the encoder, and the decoder can all be monitored and logged through NVIDIA System Management Interface (nvidia-smi), a command-line interface tool. In addition, NVIDIA vGPU metrics are integrated through management packs like VMware vRealize Operations. For our testing purposes, nVector automated the capture of the following server metrics. It is strongly advised to test your specific workloads during a POC. You can run nvidia-smi commands on the hypervisor to monitor the GPU utilization of the physical GPU. Please refer to Deployment Best Practices for further syntax information.
User Experience Metrics#
NVIDIA’s nVector benchmarking tool has built-in mechanisms to measure user experience. This next section will dig deeper into how the end-user experience is measured and how results are obtained.
Latency Metrics#
Latency defines the response or feel of the end-user when working with applications in the VDI. Increased latency can provide a poor experience, including mouse cursor delay, text display issues when typing, and audio/video sync issues. The lower the latency, the better! Imagine that you are working on a PowerPoint presentation, adding a shape, and resizing it. On the first attempt, this process is instantaneous. However, the second attempt is delayed by several seconds or is sluggish. With such inconsistency, the user tends to overshoot or have trouble getting the mouse in the correct position. This lack of consistent experience can be very frustrating. Often, it results in the user experiencing high error rates as they click too fast or too slow, trying to pace themselves with an unpredictable response time. NVIDIA’s nVector benchmarking tool measures the variation in end-user latency and how frequently it is experienced.
Remoted Frames Metrics#
Frame rate metrics are captured on the endpoint and provide an excellent metric on the possible end-user experience. The average frame rate is captured and calculated across the simulated workload. A lower frame rate can cause slow response during screen refresh and stuttering during scrolling or zooming. The higher the frame rate, the better!
Remoted frames are a standard measure of user experience. NVIDIA’s nVector benchmarking tool collects data on the ‘frames per second’ provided by the remote protocol vendor for the entire workload duration. The tool then tallies the data for all VDI sessions to get the total number of frames remoted for all users. Hypervisor vendors likewise measure total remoted frames as an indicator of the quality of user experience. The greater this number, the more fluid the user experience.
Image Quality#
Image quality is determined by the remoting protocol, configuration of the VDI environment, and endpoint capability. For this sizing guide, the protocol used is VMware Blast Extreme with High Color Accuracy (HCA) YUV444, a protocol specific to vPC use cases. HCA no longer removes any chroma information from images and provides a much better image quality.
NVIDIA’s nVector benchmarking tool uses a lightweight agent on the VDI desktop and the client to measure image quality. These agents take multiple screen captures on the VDI desktop and on the thin client to compare later. The Structural Similarity Index Measure (SSIM) is a metric used to quantify the visual similarity between two images. The structural similarity (SSIM) of the screen capture taken on the client is computed by comparing it to the one taken on the VDI desktop. When the two images are similar, the heatmap will reflect more colors above the spectrum shown on its right with an SSIM value closer to 1.0 (Figure 7). As the images become less similar, the heatmap will reflect more colors down the spectrum with a value less than 1.0. More than a hundred pairs of images across an entire set of user sessions are obtained. The average SSIM index of all pairs of images is computed to provide the overall remote session quality for all users. Poor image quality, under 0.90, can cause issues with text display, line sharpness, and other graphical issues. The threshold SSIM value is 0.98; scores above 0.98 indicate good image quality, with 1.0 perfect.
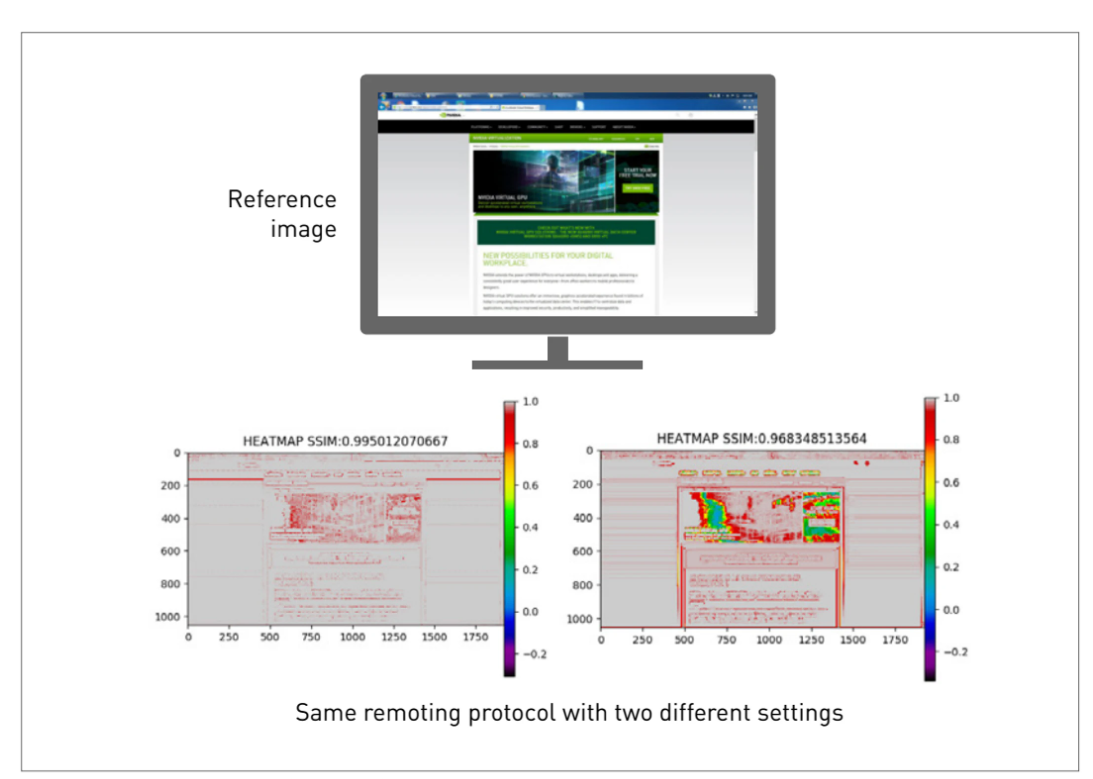
Figure 7 SSIM as a Measure of Image Quality#
Findings#
Details on the RTX PRO 4500 Blackwell Server Edition, including 3B vGPU profiles and test findings from the new Login Enterprise powered by NVIDIA nVector benchmark are coming soon.