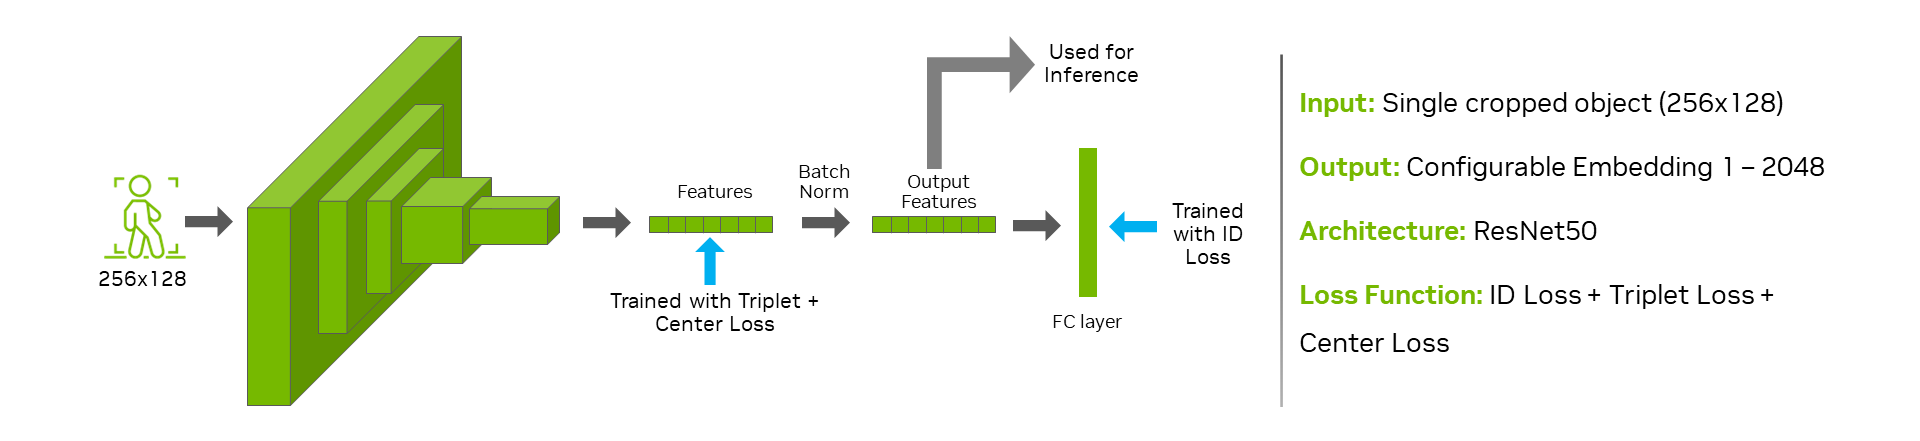
ReIdentificationNet
The ReidentificationNet models generate embeddings to identify objects captured in different scenes.
The model is essentially a ResNet50 backbone which takes in cropped images of objects as input produces feature embeddings as output.
The model is trained on the Market-1501 dataset with 751 annotated people and a sampled version of the MTMC people tracking dataset of the 2023 AI City Challenge with 156 annotated people. The dataset statistics are as follows:
subset |
no. total identities |
no. total images |
no. total cameras |
no. real identities |
no. real images |
no. real cameras |
no. synthetic identities |
no. synthetic images |
no. synthetic cameras |
Train |
907 |
44070 |
135 |
759 |
14537 |
13 |
148 |
29533 |
122 |
Test |
907 |
28768 |
135 |
759 |
21163 |
13 |
148 |
7605 |
122 |
Query |
906 |
4356 |
135 |
758 |
3539 |
13 |
148 |
817 |
122 |
Model Card
The datasheet for the models is captured in the model card hosted at NGC, which includes the detailed instructions to deploy the models with DeepStream.
TAO Fine-Tuning
You may also retrain/fine-tune the ReIdentificationNet models on customized datasets. Refer to the TAO tutorial notebook and TAO documentation for more details.
Currently, there are 2 methods for fine-tuning ReIdentificationNet.
REST API Notebook -
reid-model-finetuning-tao-api.ipynbTAO Toolkit Notebook -
reid-model-finetuning-tao-toolkit.ipynb
The Rest API notebook is available under metropolis-apps-standalone-deployment/notebooks/<version>_reference_apps/reid-model-finetuning-tao-api.ipynb
whereas the TAO Toolkit Notebook can be found here.
TAO Toolkit is supported on discrete GPUs, such as H100, A100, A40, A30, A2, A16, A100x, A30x, V100, T4, Titan-RTX, and Quadro-RTX. Refer to the TAO toolkit documentation for more details on the recommended hardware requirements. The expected time to fine-tune the ReIdentificationNet is as follows:
Backbone Type |
GPU Type |
No. of training images |
Image Size |
No. of identities |
Batch size |
Total Epochs |
Total Training Time |
|---|---|---|---|---|---|---|---|
Resnet50 |
1 x Nvidia A100 - 80GB PCIE |
13,000 |
256x128x3 |
751 |
128 |
120 |
~1.25 hours |
Resnet50 |
1 x Nvidia Quadro GV100 - 32GB |
13,000 |
256x128x3 |
751 |
64 |
120 |
~2.5 hours |
Rest API Notebook Guide:
The documentation provided below accompanies the cells in the API notebook and offers guidance on how to execute them:
Environment Setup for Notebook:
conda create -n reid_finetuning python=3.11
conda activate reid_finetuning
conda install jupyterlab
Notebook Configuration cell: Once the environment setup is complete, the notebook will ask you to set the TAO API, NGC & synthetic data location variables. Access to TAO server can be obtained via self-hosting.
ReID Training Configuration & Train ReID cell: For fine-tuning, train_num_epochs is set to 10 epochs. It is essential that the user monitors the training process for overfitting/underfitting by evaluating the final checkpoint on test data. If the overfitting is observed, the user can generate more samples incrementally & resume the training process to validate good results on test data. TAO API also provides finer controls on the configuration that can be modified. For more details about TAO ReIdentificationNet configurations refer to these docs.
Evaluate Trained Model cell: Once the model is trained, mAP & rank-1 accuracy scores have to be evaluated to ensure training is performed correctly.
Export to ONNX cell: After successful evaluation, you can export the model to ONNX format for easy deployment by launching an export job. The job artifacts can then be downloaded to get the exported ONNX model file.
Accuracy
The goal of re-identification is to identify test samples of the same identities for each query.
The key performance indicators are the ranked accuracy of re-identification and the mean average precision (mAP).
Rank-K accuracy: It is method of computing accuracy where the top-K highest confidence labels are matched with a ground truth label. If the ground truth label falls in one of these top-K labels, we state that this prediction is accurate. It allows us to get an overall accuracy measurement while being lenient on the predictions if the number of classes are too high and too similar. In our case, we compute rank-1, 5 and 10 accuracies. This means in case of rank-10, for a given sample, if the top-10 highest confidence labels predicted, match the label of ground truth, this sample will be counted as a correct measurement.
Mean average precision: Precision measures how accurate predictions are, in our case the logits of ID of an object. In other words, it measures the percentage of the predictions that are correct. mAP is the average of average precision (AP) where AP is computed for each class, in our case ID.
The experimental results on the test set of Market-1501 are listed as follows.
feature dimension |
mAP |
rank-1 accuracy |
rank-5 accuracy |
rank-10 accuracy |
64 |
91.0% |
93.4% |
96.7% |
97.7% |
128 |
92.1% |
94.5% |
96.9% |
97.9% |
256 |
93.0% |
94.7% |
97.3% |
98.0% |
512 |
93.4% |
95.1% |
97.5% |
98.1% |
1024 |
93.7% |
94.8% |
97.5% |
98.2% |
2048 |
93.9% |
95.3% |
98.0% |
98.4% |