Observability Setup for NVIDIA RAG Blueprint#
This guide provides step-by-step instructions to enable tracing and observability for the NVIDIA RAG Blueprint using OpenTelemetry (OTel) Collector and Zipkin.
The observability stack consists of:
OTel Collector - Collects, processes, and exports telemetry data.
Zipkin - Used for visualizing traces.
Enable Observability with Docker#
Use the following procedure to enable observability with Docker.
Set the required environment variable for the OTel Collector Config by running the following code from the root directory of the repo.
export OPENTELEMETRY_CONFIG_FILE=$(pwd)/deploy/config/otel-collector-config.yaml
Start the OTel Collector and Zipkin observability services by running the following code.
docker compose -f deploy/compose/observability.yaml up -d
Enable tracing in the RAG server by setting
APP_TRACING_ENABLEDis set to"True"indocker-compose-rag-server.yaml.services: rag-server: environment: # Tracing APP_TRACING_ENABLED: "True"
Start the RAG Server by following the instructions in the appropriate deployment guide.
View Traces in Zipkin#
After tracing is enabled and the system is running, you can view the traces in Zipkin by opening:
Open the Zipkin UI at: http://localhost:9411
View Metrics in Grafana#
Metrics are exposed at http://localhost:8889/metrics and can be viewed in Grafana.
Open Grafana:
Docker Compose: http://localhost:3000
Helm: port-forward Grafana and open http://localhost:3001.
Log in with
admin/admin, unless you changed the Grafana credentials.If the Prometheus data source is not configured, add it with URL
http://prometheus:9090.Go to Dashboards > Import.
Upload the dashboard JSON file:
Standard RAG:
deploy/config/rag-metrics-dashboard.jsonAgentic RAG:
deploy/config/agentic-rag-metrics-dashboard.json
Select the
Prometheusdata source, then select Import.
Query-to-Answer Pipeline and Studying Time Spent#
For a complete description of the flow from query to answer, and guidance on measuring time spent in each stage of the pipeline, refer to Query-to-Answer Pipeline.
The documentation explains the following:
Pipeline stages – Describes the sequence of stages (query rewriter → retriever → context reranker → LLM generation) and the role of each one.
Studying time – Shows how to use Zipkin span durations and Prometheus/Grafana metrics (
retrieval_time_ms,context_reranker_time_ms,llm_generation_time_ms,rag_ttft_ms, etc.) to identify where latency occurs.
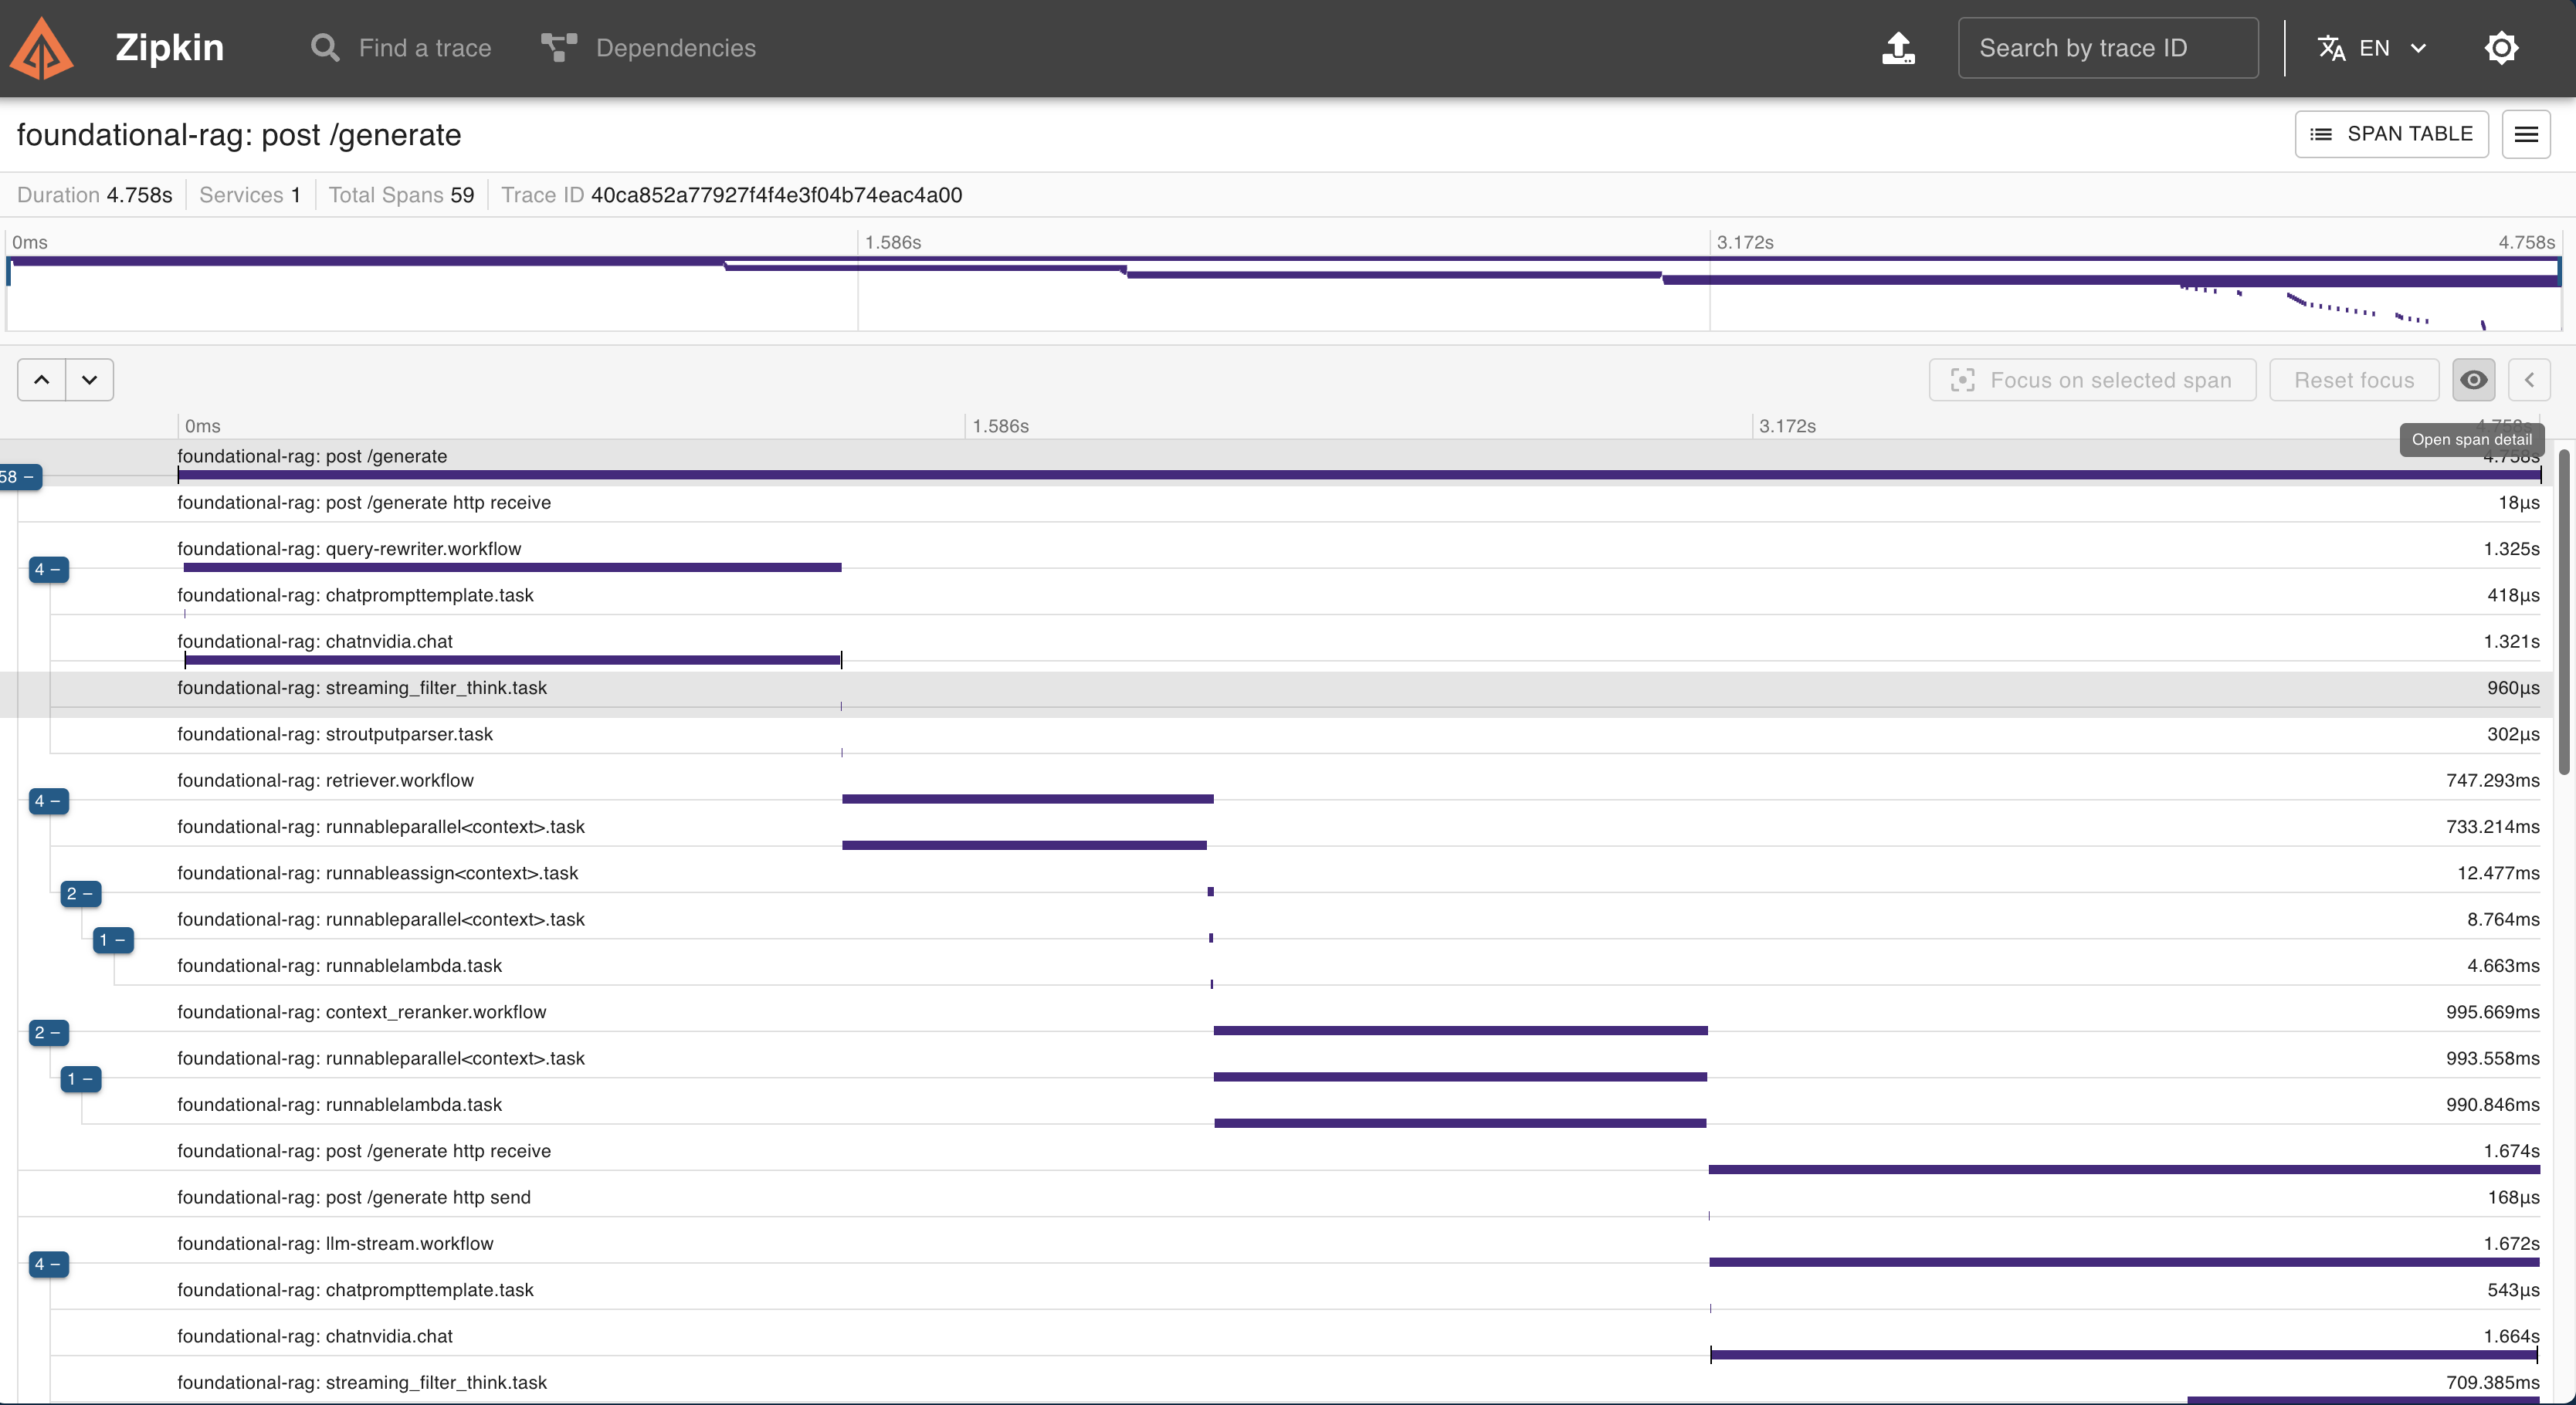
Each request trace in Zipkin includes spans such as query-rewriter, retriever, context-reranker, and llm-stream. Each span duration is the time spent in that stage. Metrics are exposed at http://localhost:8889/metrics and can be visualized in Grafana.
Viewing Inputs / Outputs of each stage of the RAG pipeline using Zipkin#
After tracing is enabled and running, you can view inputs and outputs of different stages of the RAG pipeline in Zipkin.
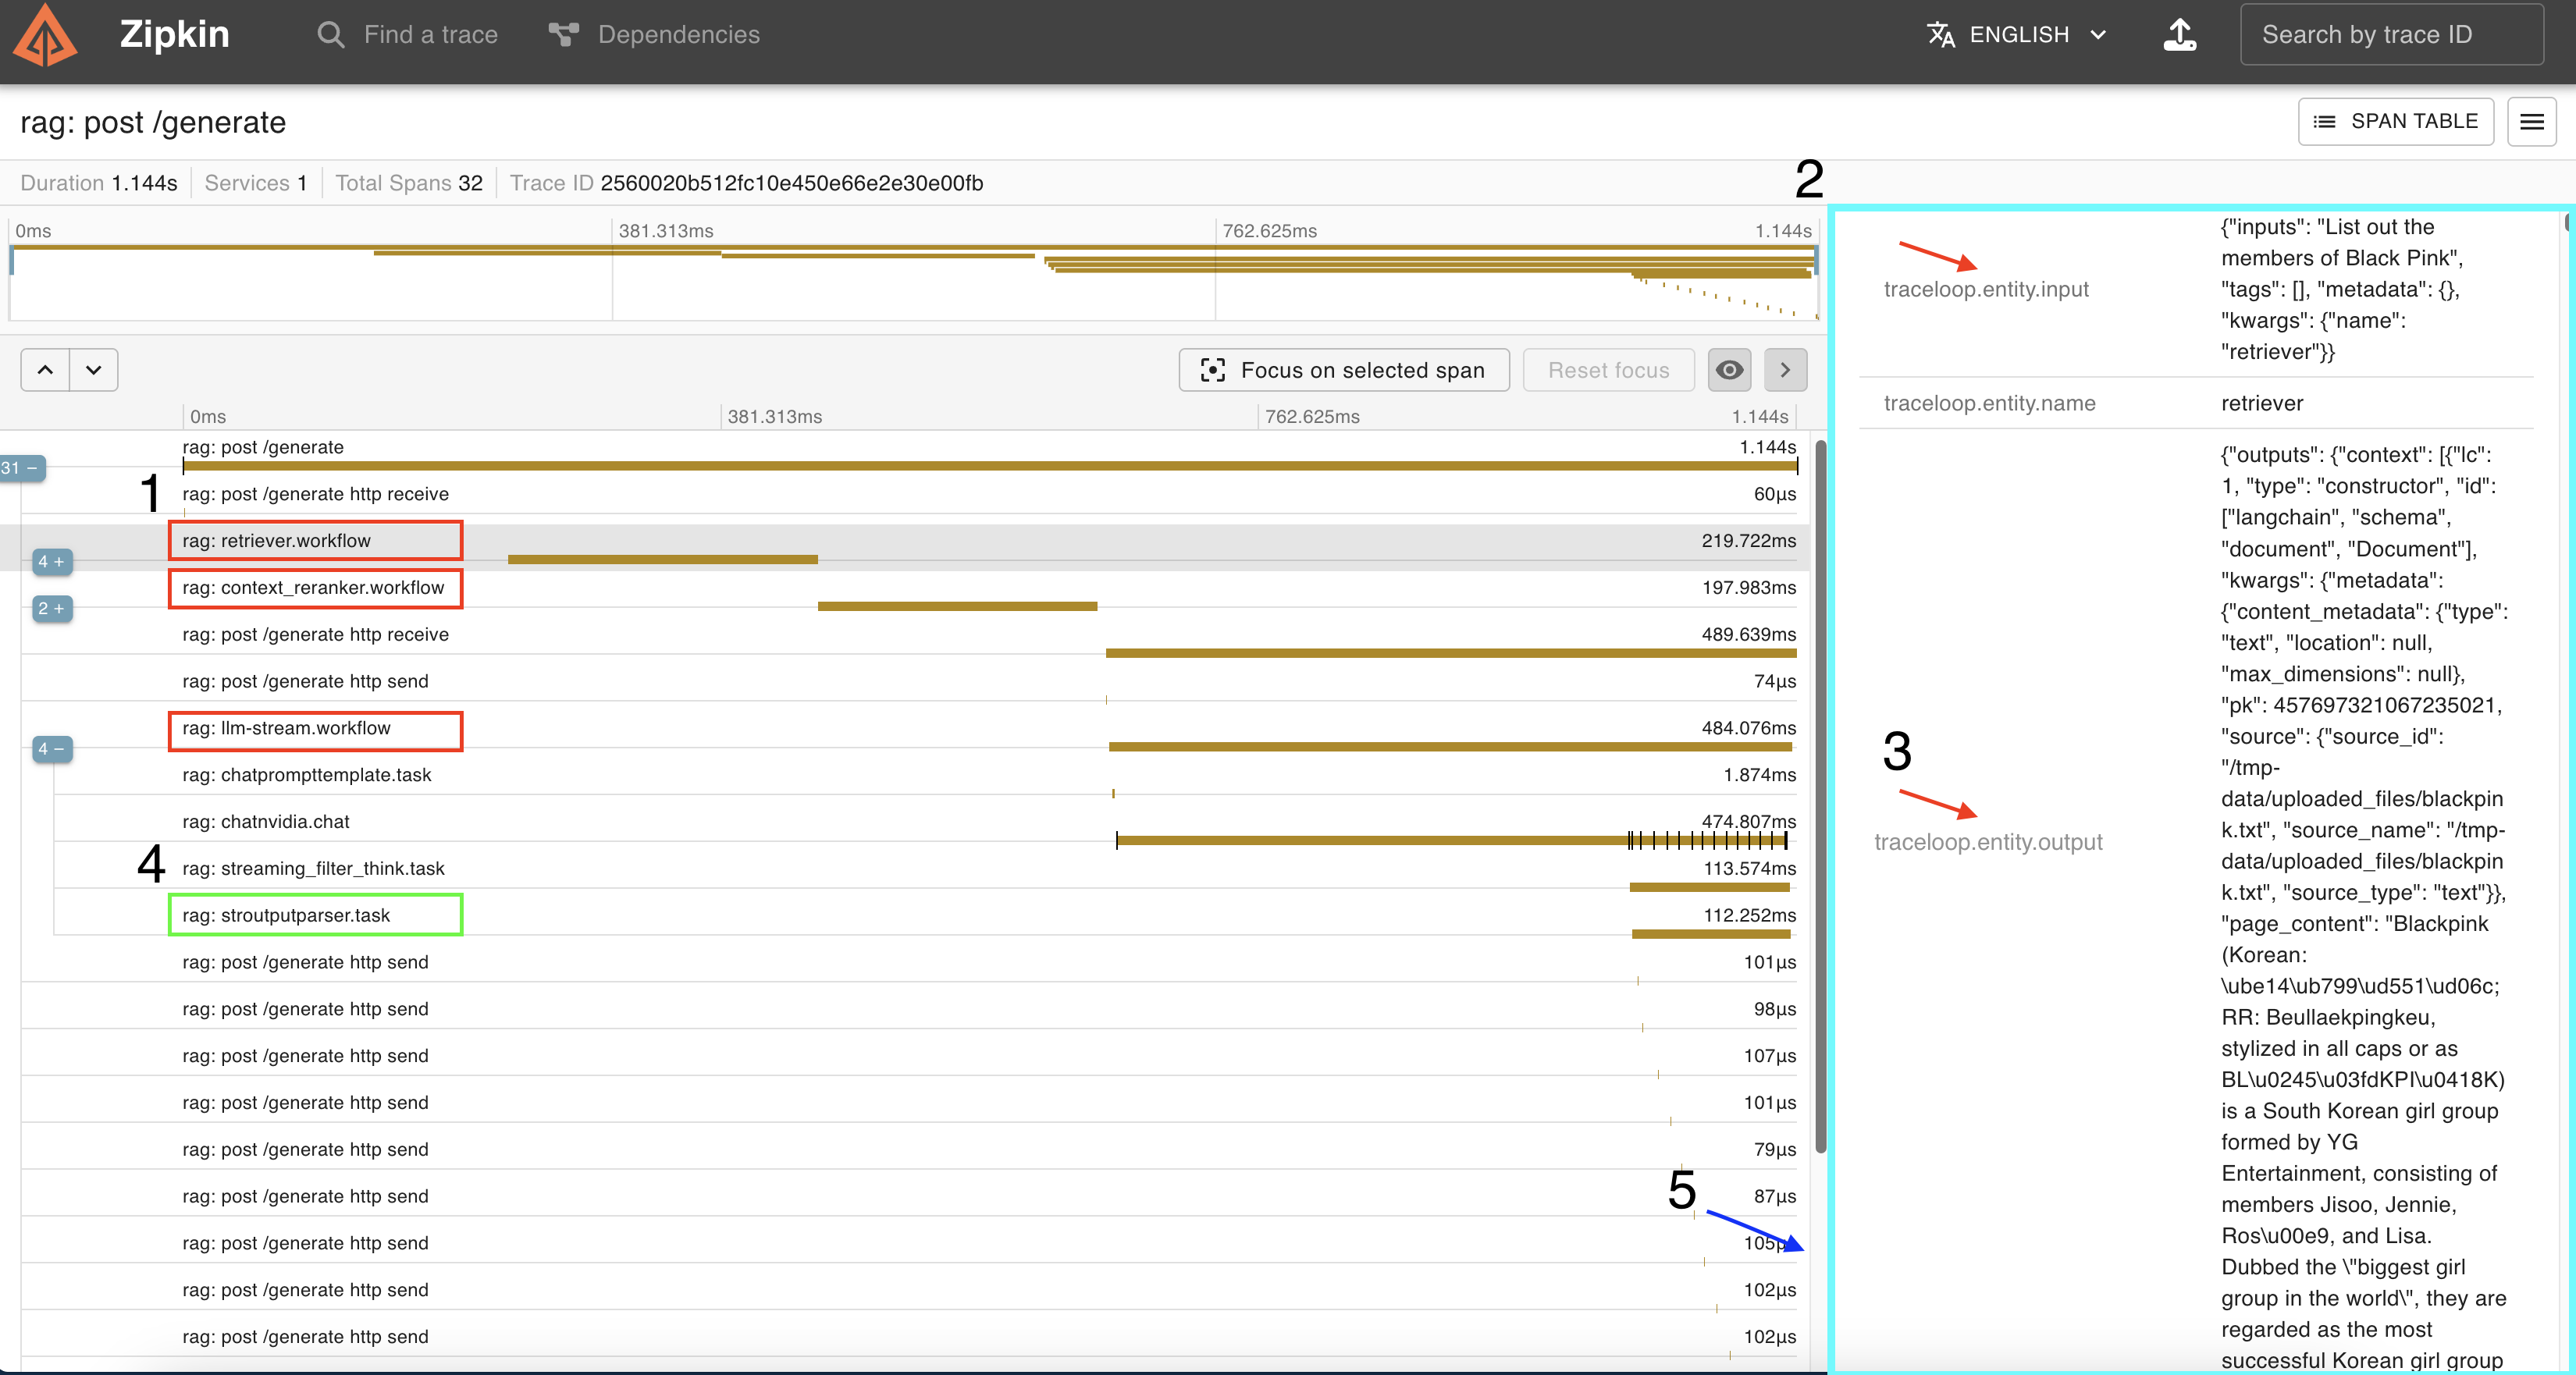
Click on any of the workflows out of
query-rewriter,retriver,context-rerankerorllm-stream. Details appear in the details pane.In the details, find the
traceloop.entity.inputandtraceloop.entity.ouputrows. These rows show the input and output of that particular workflow.Similarly, you can view inputs and outputs for sub stages within the workflows by clicking on a substage and finding the
traceloop.entity.inputandtraceloop.entity.ouputrows.
Enable Observability with Helm#
Use the following procedure to enable observability with Helm.
Prerequisites: Install Prometheus Operator CRDs#
Before enabling the observability stack, install the Prometheus Operator CRDs:
# Add the Prometheus Helm repository
helm repo add prometheus-community https://prometheus-community.github.io/helm-charts
helm repo update

# Install Prometheus Operator CRDs
helm upgrade --install prometheus-crds prometheus-community/prometheus-operator-crds \
  --version 26.0.1 \
  --namespace rag \
  --create-namespace
Note
The Prometheus Operator CRDs must be installed before deploying the RAG blueprint with observability enabled. These CRDs are required for ServiceMonitor and other Prometheus resources.
Enable OpenTelemetry Collector, Zipkin and Prometheus stack#
The observability stack is disabled by default to minimize resource usage. To enable it:
Install Prometheus Operator CRDs (if not already installed - see Prerequisites above)
Modify
values.yamlto enable the observability components:# Enable observability stack serviceMonitor: enabled: true opentelemetry-collector: enabled: true zipkin: enabled: true kube-prometheus-stack: enabled: true # Enable tracing in rag-server envVars: # === Tracing === APP_TRACING_ENABLED: "True" # Change from "False" to "True" APP_TRACING_OTLPHTTPENDPOINT: "http://rag-opentelemetry-collector:4318/v1/traces" APP_TRACING_OTLPGRPCENDPOINT: "grpc://rag-opentelemetry-collector:4317"
Deploy the changes:
After modifying
values.yaml, apply the changes as described in Change a Deployment.For detailed HELM deployment instructions, see Helm Deployment Guide.
Port-forwarding Zipkin and Grafana dashboards#
For Helm deployments, to port-forward services to your local computer, use the following instructions:
Zipkin UI – Run the following code to port-forward the Zipkin service to your local computer. Then access the Zipkin UI at
http://localhost:9411.kubectl port-forward -n rag service/rag-zipkin 9411:9411 --address 0.0.0.0
Grafana UI – Run the following code to port-forward the Grafana service to your local computer. Then access the Grafana UI at
http://localhost:3001and use the default credentials (admin/admin).kubectl port-forward -n rag service/rag-grafana 3001:80 --address 0.0.0.0
For detailed information on tracing, refer to Viewing Traces in Zipkin and Viewing Metrics in Grafana Dashboard.