Alert Verification Workflow#
The Alert Verification Workflow combines object detection with Vision Language Model (VLM) verification to reduce false positive rates in alerting systems.
Use Cases
PPE compliance verification (hard hats, safety vests)
Restricted area monitoring
Asset presence/absence detection
Custom object detection scenarios
Estimated Deployment Time: 15-20 minutes
The following diagram illustrates the alert verification workflow architecture:
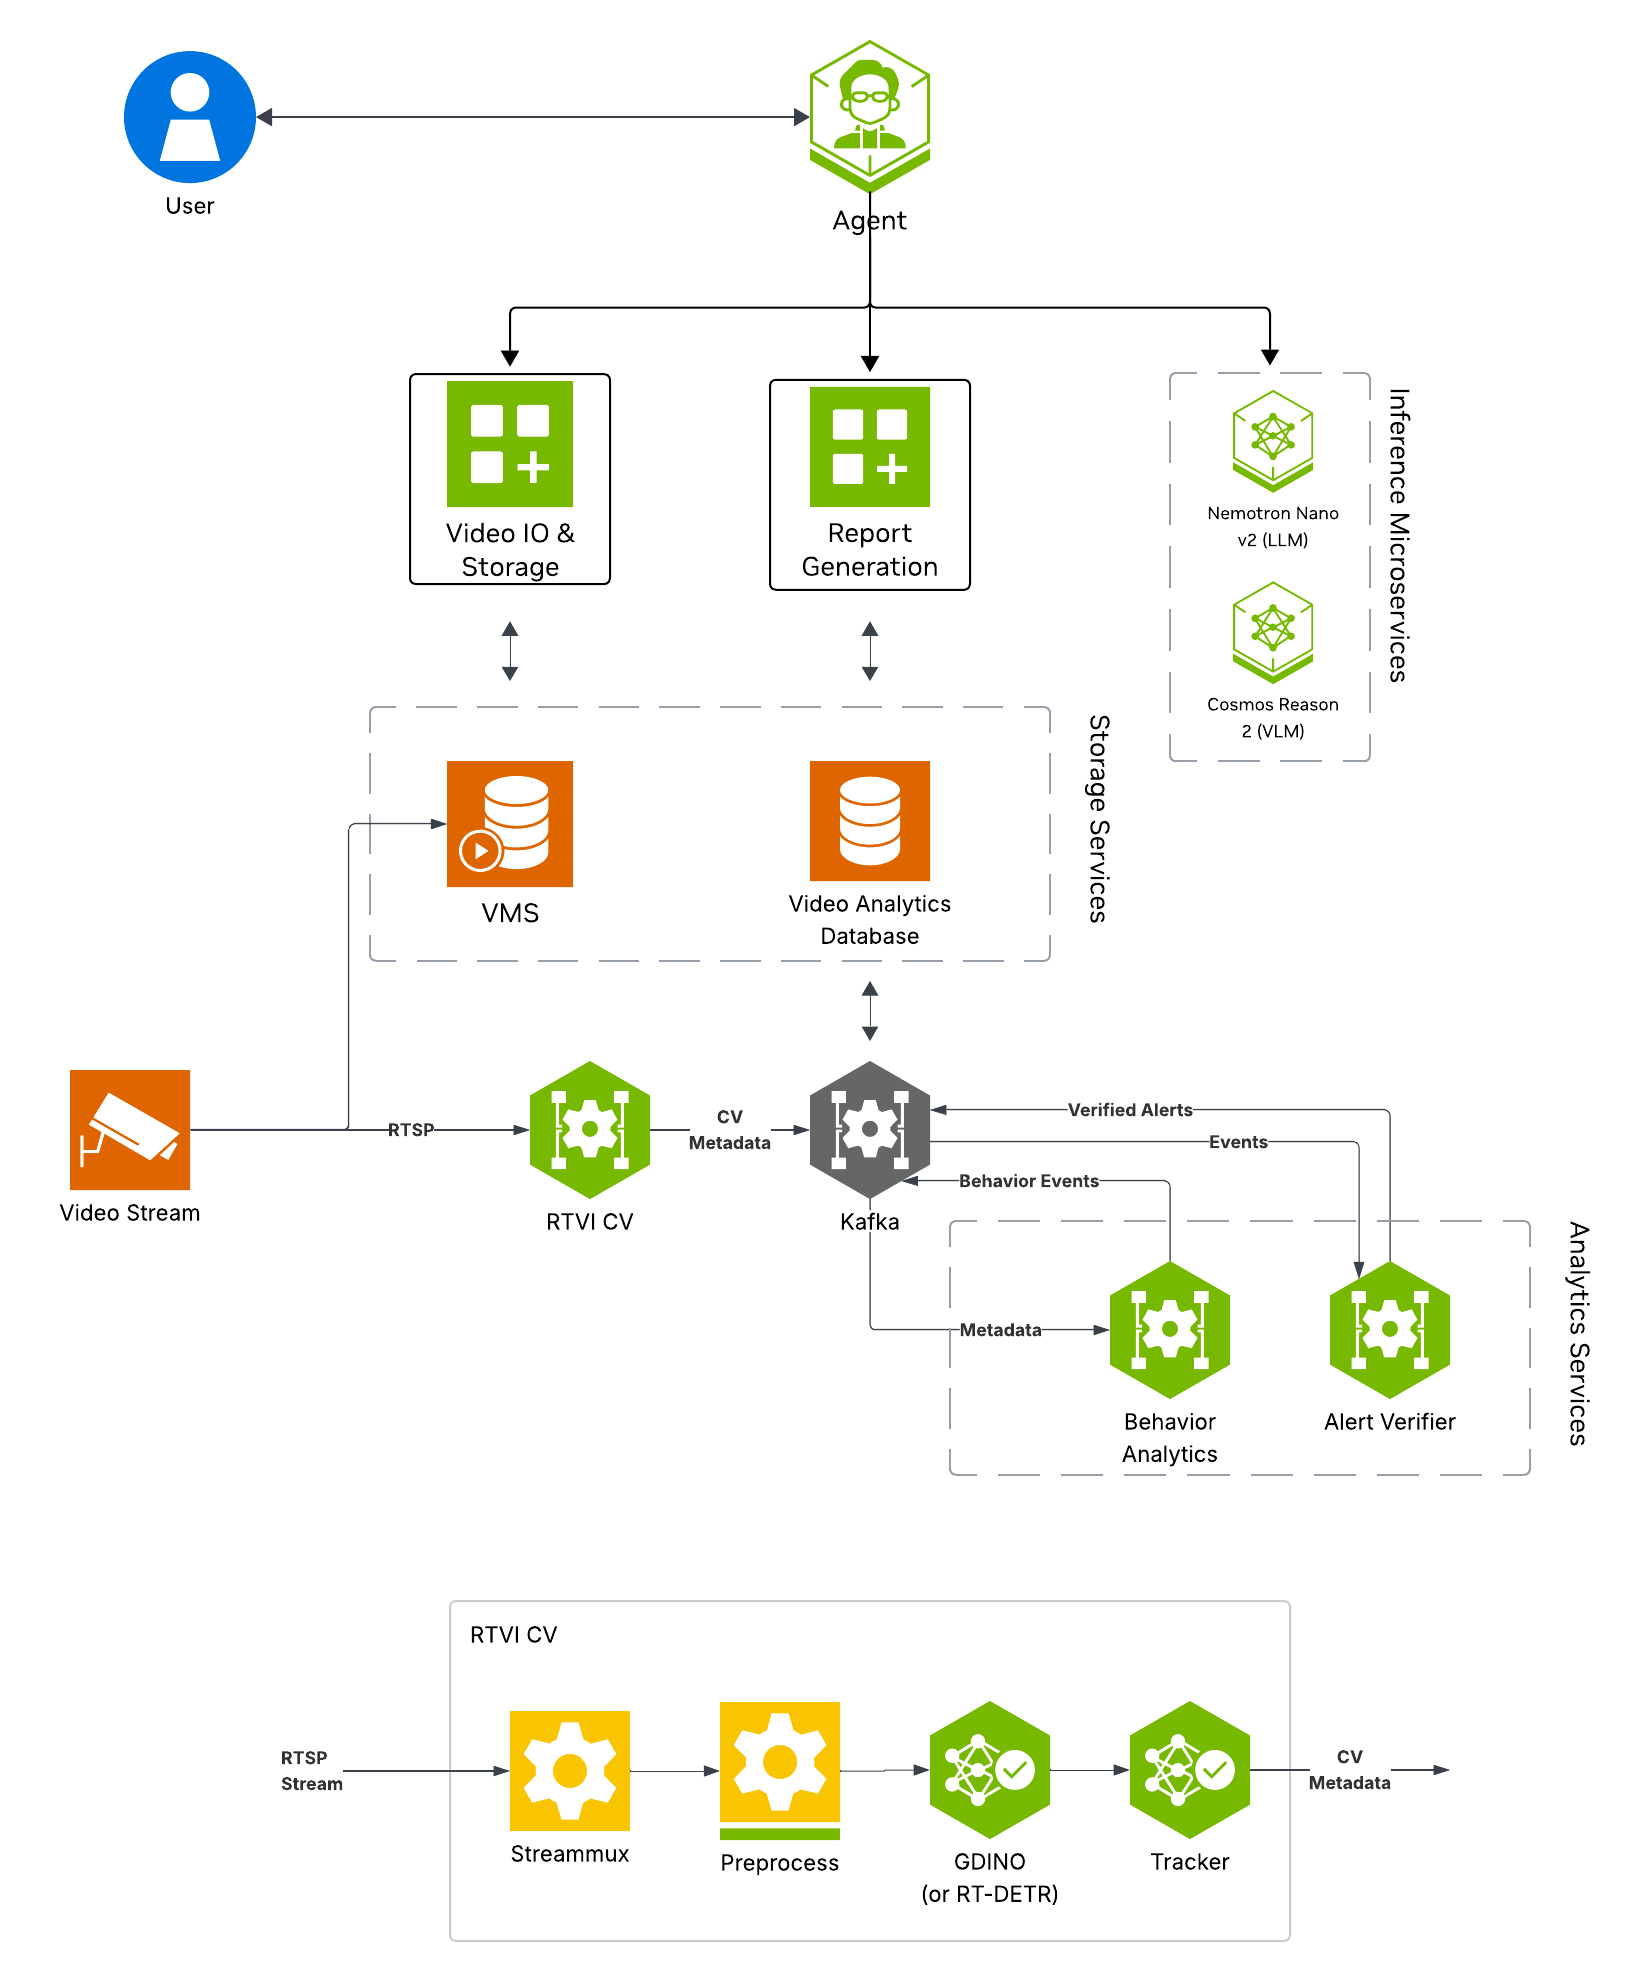
Key Features of the Alert Verification Agent:
Real-time object detection using Grounding DINO (open-vocabulary detection)
Rule-based and configurable alert generation from detection results
VLM-based alert verification to reduce false positives
Alert storage for querying and reporting
What’s being deployed#
VSS Agent: Agent service that orchestrates tool calls and model inference to answer questions and generate outputs
VSS Agent UI: Web UI with chat, video upload, and different views
Perception: Real-Time Video Intelligence CV Microservice for object detection
Alert Verification: Alert verification agent for verification via VLMs
Video IO & Storage (VIOS): Video ingestion, recording, and playback services used by the agent for video access and management
NVStreamer: Video streaming service for video playback
Nemotron LLM (NIM): LLM inference service used for reasoning, tool selection, and response generation
Cosmos Reason (NIM): Vision-language model with physical reasoning capabilities
ELK: Elasticsearch, Logstash, and Kibana stack for log storage and analysis
Phoenix: Observability and telemetry service for agent workflow monitoring
Prerequisites#
Before you begin, ensure all of the prerequisites are met. See Prerequisites for more details.
Deploy#
Note
For instructions on downloading sample data and the deployment package, see Download Sample Data and Deployment Package in the Quickstart guide.
Skip to Step 1: Deploy the Agent if you have already downloaded and deployed another agent workflow.
Step 1: Deploy the Agent#
Based on your GPU, run the following command to deploy the agent:
deployments/dev-profile.sh up -p alerts
deployments/dev-profile.sh up -p alerts -H RTX6000PROBW
deployments/dev-profile.sh up -p alerts -H L40S
This deployment uses the following defaults:
Host IP: Primary IP from
ip routeAlert mode: 2d_cv (default if
-mnot specified)LLM mode: local_shared
VLM mode: local_shared
LLM model: nvidia-nemotron-nano-9b-v2
VLM model: cosmos-reason2-8b
This command will download the necessary containers from the NGC Docker registry and start the agent. Depending on your network speed, this may take a few minutes.
Note
NGC API Key: The deployment requires an NGC CLI API key. You can either set it as an environment variable (export NGC_CLI_API_KEY='your_ngc_api_key') or pass it as a command-line argument using -k 'your_ngc_api_key'.
Note
For advanced deployment options such as hardware profiles, NIM configurations, and model selection, see Advanced Deployment Options.
Once complete, check that all the containers are running and healthy:
docker ps
Once all the containers are running, you can access the agent UI at http://<HOST_IP>:3000/.
If you would like to modify the workflow to work with other videos or usecases, you can update the following files:
deployments/developer-workflow/dev-profile-alerts/vlm-as-verifier/configs/alert_type_config.jsonModify the “output_category” and “user” fields here. “output_category” modifies the category type that shows up in the agent UI. “user” is the user prompt that is sent to the VLM for verification of each alert clip.
deployments/developer-workflow/dev-profile-alerts/deepstream/configs/config_triton_nvinferserver_gdino.txtUpdate the “type_name” field under “postprocess” to change the objects that are detected by Grounding DINO. By default this is “person” with a threshold of 0.5. This can be modified to support multiple classes by using “ . “ as a delimiter.
deployments/developer-workflow/dev-profile-alerts/vss-behavior-analytics/configs/vss-behavior-analytics-kafka-config.jsonUpdate the “value” field under
"name": "fovCountViolationIncidentObjectType"to change the objects that Behavior Analytics creates alerts for.
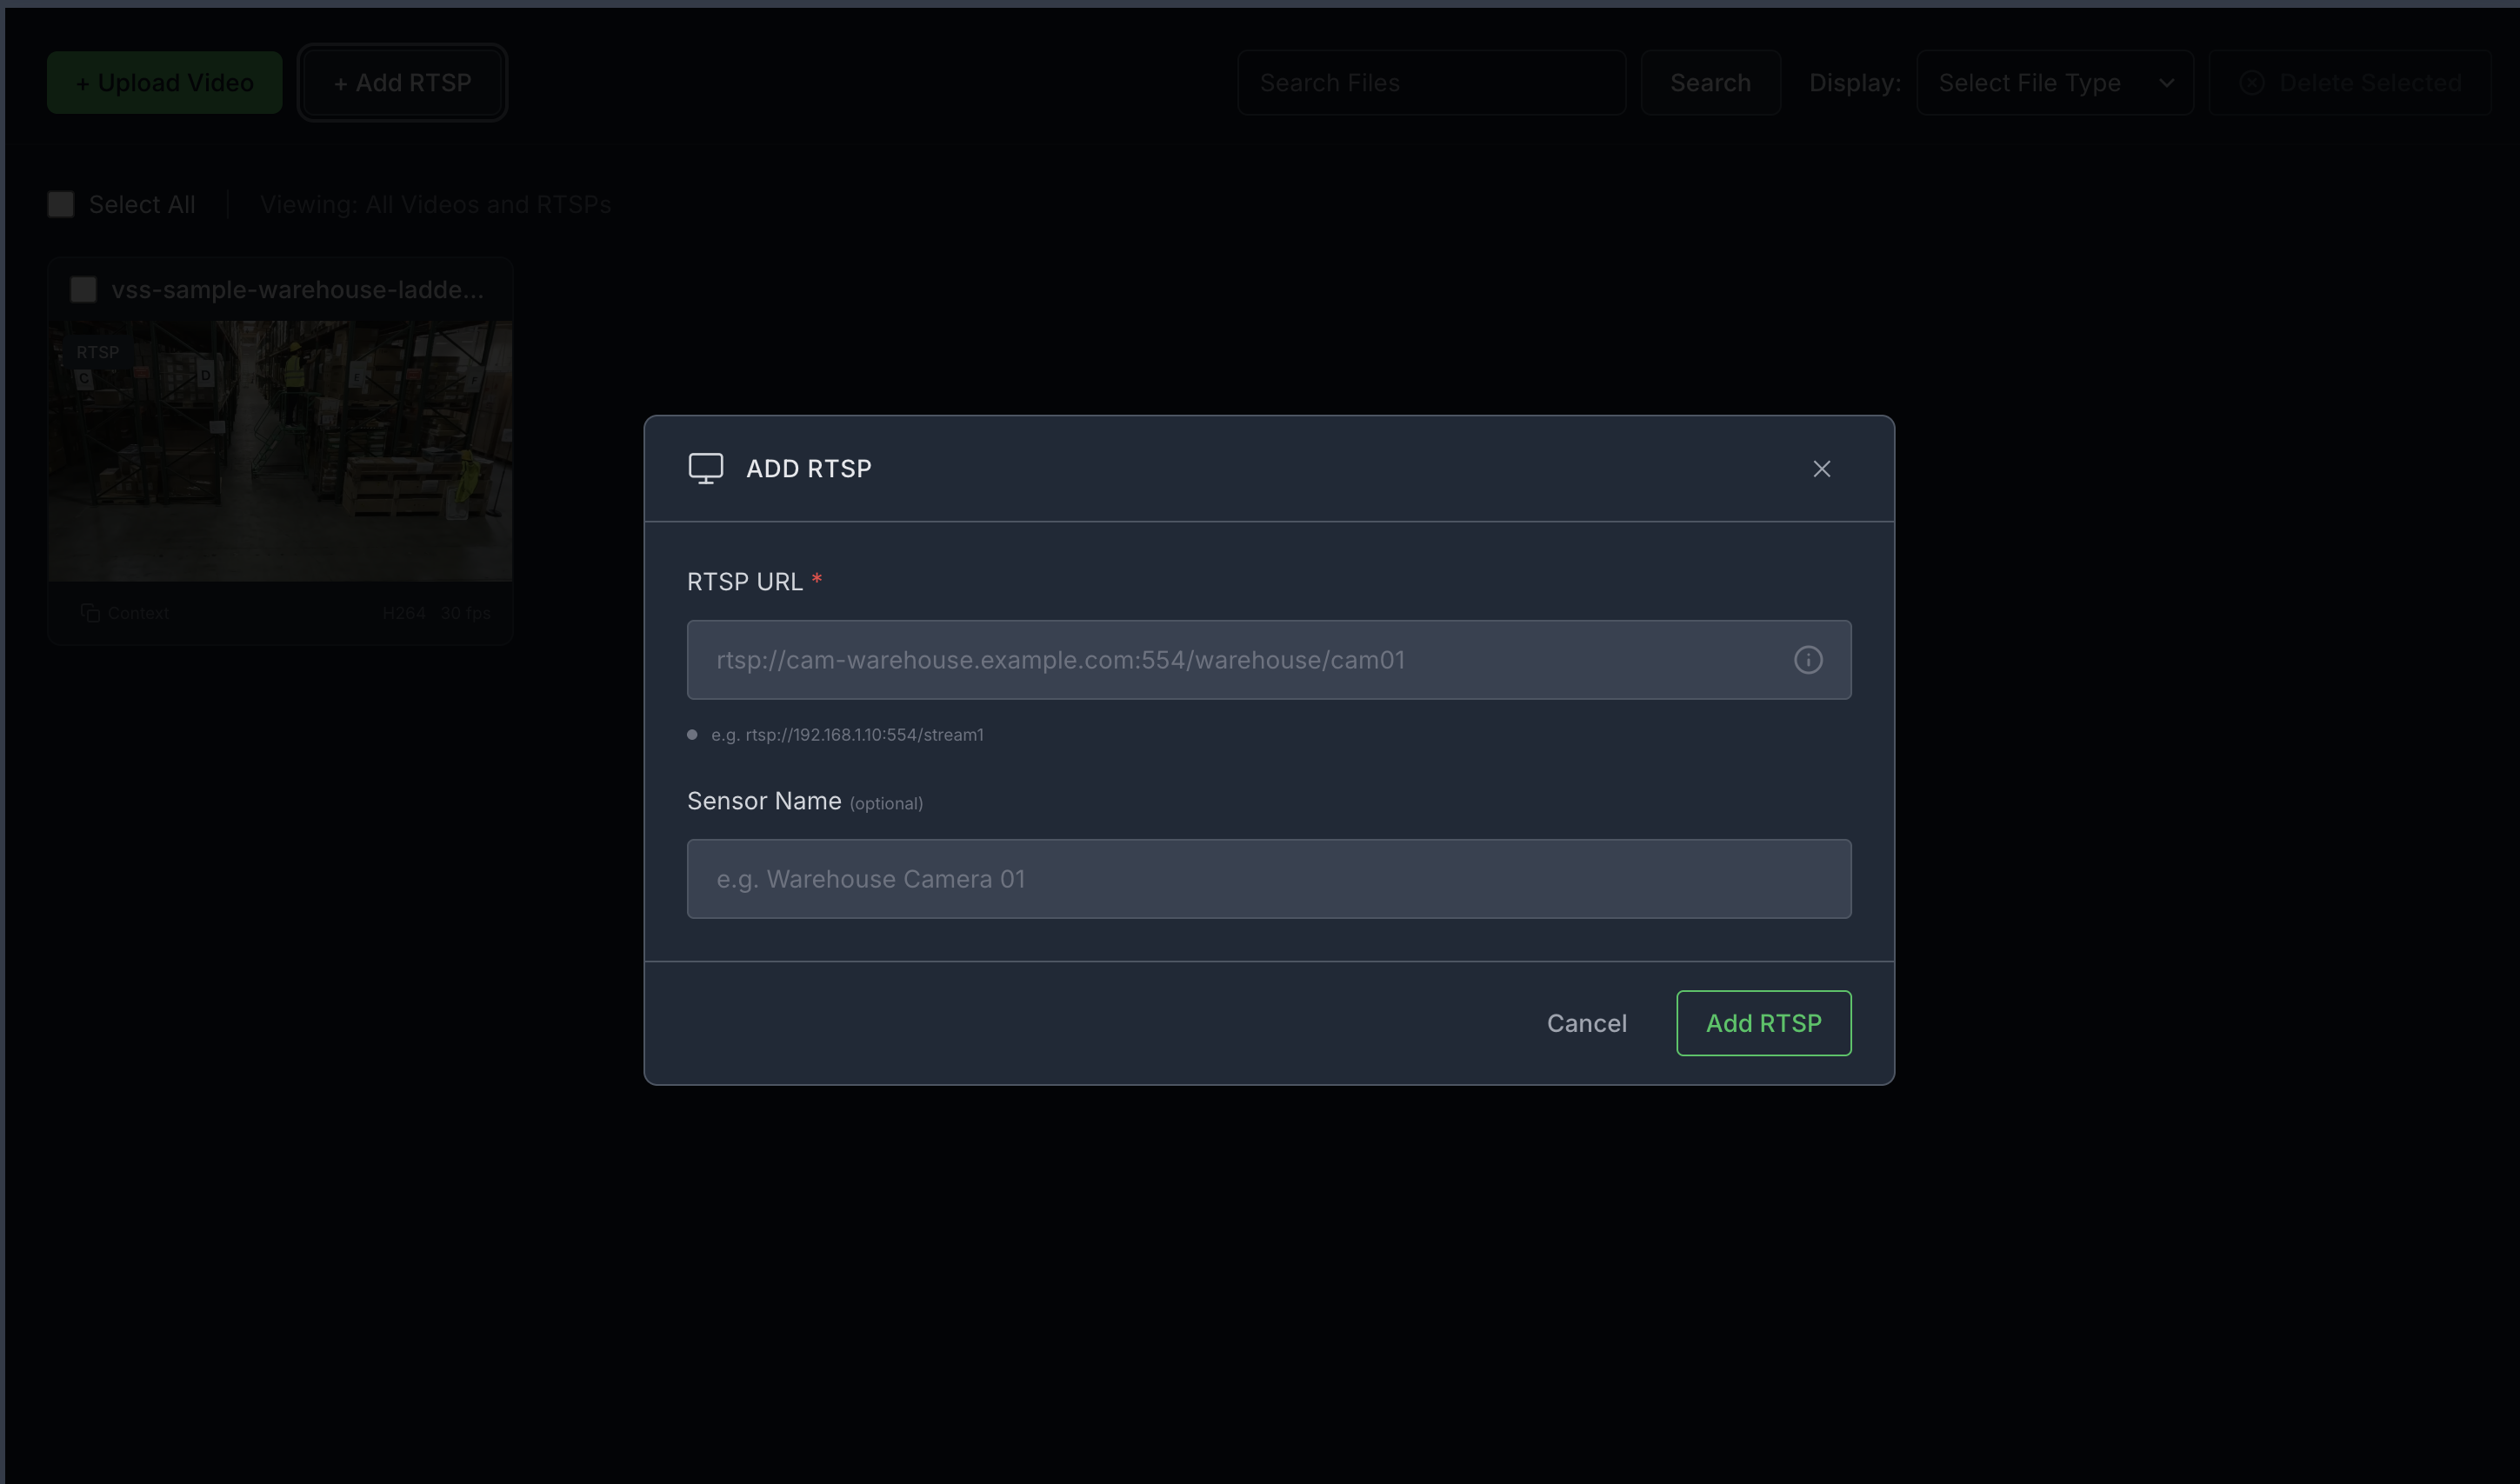
Step 2: Add a video stream#
Add an RTSP stream by clicking the “+ Add RTSP” button under the “Video Management tab” on the agent UI. If you do not have an RTSP stream, you can use NVStreamer at http://<HOST_IP>:31000 to upload a video file and create an RTSP stream.
For this profile, use the vss-sample-warehouse-ladder.mp4 stream.
Note
By default, this profile only supports up to one stream being processed at a time.
Step 3: Verify pipeline components#
Open the Kibana UI at http://<HOST_IP>:5601/app/home#/ and navigate to the Discover tab.
Verify the following data indices are populated, it may take a few minutes for data to start appearing after adding the stream:
mdx-raw-*- Raw detection datamdx-incidents-*- Generated incidentsmdx-vlm-incidents-*- VLM-verified alerts
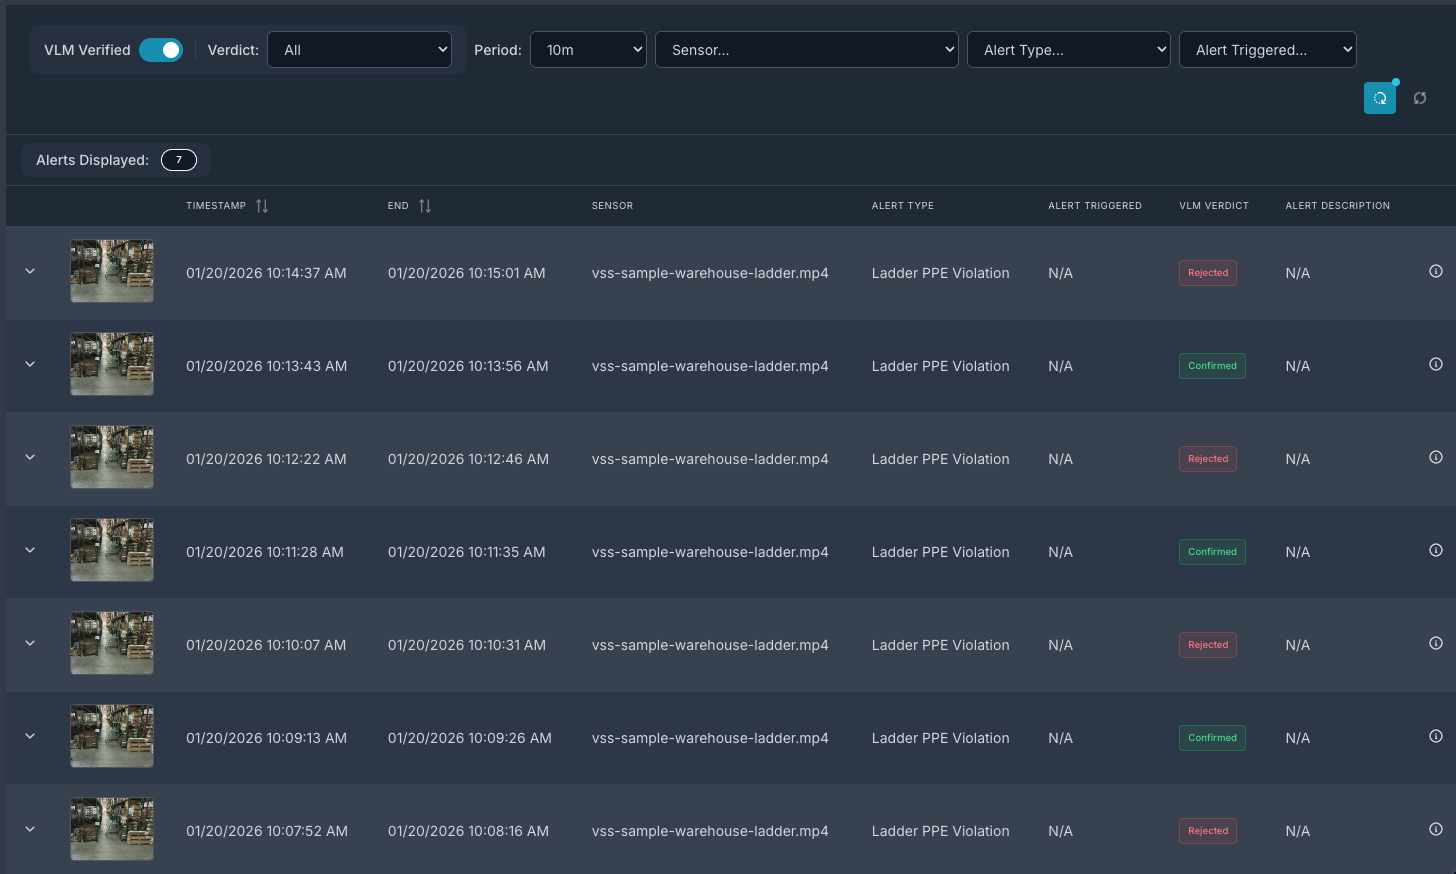
Step 4: View alerts in the Agent UI#
Launch the Agent UI at http://<HOST_IP>:3000/.
List streams to verify connectivity, then use the Alert Tab to list alerts. Select the verified alerts option to view VLM-verified alerts.
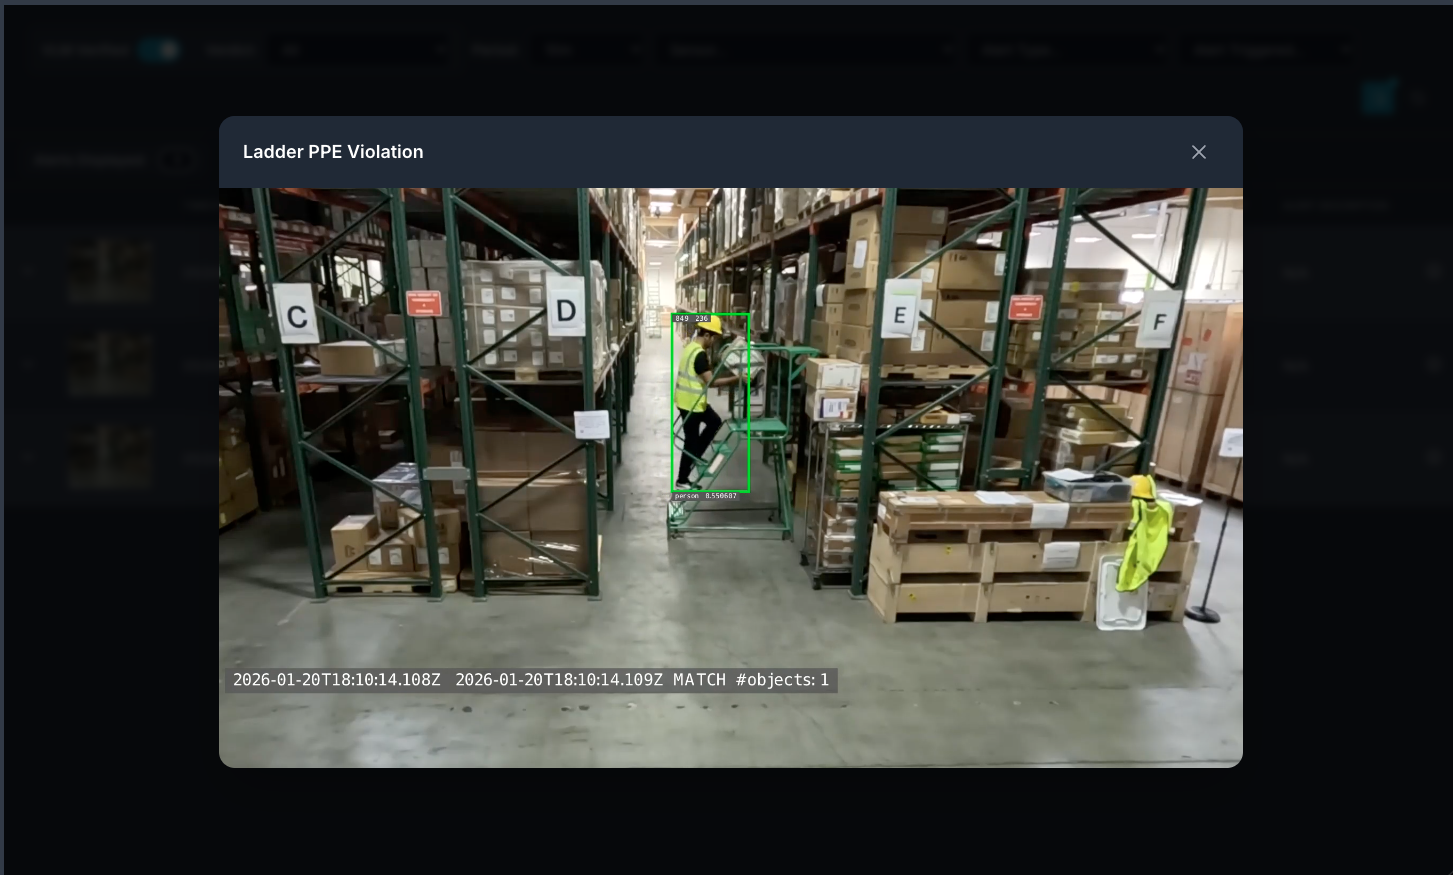
You can then click on a video thumbnail to play the video and view the alert. This will include overlay with bounding boxes over objects of interest.
Step 5: Teardown the agent#
To teardown the agent, run the following command:
deployments/dev-profile.sh down
This command will stop and remove the agent containers.
Service Endpoints#
Once deployed, the following services are available:
Service |
URL |
|---|---|
VSS UI |
|
Kibana UI |
|
NVStreamer UI |
|
VST UI |
|
Phoenix UI |
|
Next Steps#
Once you’ve familiarized yourself with the alert verification workflow, you can explore:
Modifying the alert prompt in the Alert Verification Microservice configuration.
Adjusting rate limit settings to control alert verification frequency.
Configuring G-DINO prompting and class thresholds for custom detection scenarios.
Appendix: Advanced Deployment Options#
The deployment script supports additional configuration options for advanced use cases. To view all available options, run:
deployments/dev-profile.sh --help
Hardware Profile#
Specify the hardware profile to optimize for your GPU:
deployments/dev-profile.sh up -p alerts -H RTX6000PROBW
Available hardware profiles: H100 (default), L40S, RTX6000PROBW
Host IP Configuration#
Manually specify the host IP address:
deployments/dev-profile.sh up -p alerts -i '<HOST_IP>'
Default: Primary IP from ip route
Externally Accessible IP#
Optionally specify an externally accessible IP address for services that need to be reached from outside the host:
deployments/dev-profile.sh up -p alerts -e '<EXTERNALLY_ACCESSIBLE_IP>'
LLM and VLM Configuration#
Configure the LLM and VLM (NVIDIA Inference Microservice) modes independently:
deployments/dev-profile.sh up -p alerts --llm-mode local --vlm-mode local
Available modes:
local_shared(default): Shared local NIM instancelocal: Dedicated local NIM instanceremote: Use remote NIM endpoints
Constraint: Both --llm-mode and --vlm-mode must be local_shared, or neither can be local_shared.
For remote LLM and VLM, specify the base URLs:
deployments/dev-profile.sh up -p alerts \
  --llm-mode remote \
  --vlm-mode remote \
  --llm-base-url https://your-llm-endpoint.com \
  --vlm-base-url https://your-vlm-endpoint.com
Note
To deploy your own remote NIM endpoint, refer to the NVIDIA NIM Deployment Guide for instructions on setting up NIM on your infrastructure.
Model Selection#
Specify custom LLM and VLM models:
deployments/dev-profile.sh up -p alerts \
  --llm llama-3.3-nemotron-super-49b-v1.5 \
  --vlm cosmos-reason2-8b
Available LLM models: nvidia-nemotron-nano-9b-v2, nemotron-3-nano, llama-3.3-nemotron-super-49b-v1.5, gpt-oss-20b
Available VLM models: cosmos-reason1-7b, cosmos-reason2-8b, qwen3-vl-8b-instruct
Note
Only the default models nvidia-nemotron-nano-9b-v2 (LLM) and cosmos-reason2-8b (VLM) have been verified on local and local_shared NIM modes.
Device Assignment#
Assign specific GPU devices for LLM and VLM:
deployments/dev-profile.sh up -p alerts \
  --llm-device-id 0 \
  --vlm-device-id 1
Note: --llm-device-id is not allowed if --llm-mode is remote. --vlm-device-id is not allowed if --vlm-mode is local_shared or remote.
Custom VLM Weights#
The VSS Blueprint supports using custom VLM weights for specialized detection scenarios. Custom weights can be used to improve accuracy for domain-specific use cases.
Download Custom Weights
Before using custom weights, you need to download them from NGC or Hugging Face. For detailed instructions on downloading custom weights, see the Custom VLM Weights section in Prerequisites.
Deploy with Custom Weights
Once you have downloaded custom weights to a local directory, specify the path when deploying:
deployments/dev-profile.sh up -p alerts \
  --vlm-custom-weights /path/to/custom/weights
Skip Custom Weights
To deploy without custom weights and use the default model weights (no download, no environment variable set):
deployments/dev-profile.sh up -p alerts \
  --vlm-custom-weights None
Dry Run#
To preview the deployment commands without executing them:
deployments/dev-profile.sh up -p alerts -d
Note: The -d or --dry-run flag is also available for the down command.
Known Issues#
Videos corresponding to an alert may be missing bounding box overlay for the last few seconds. Sometimes you may also not see overlay immediately after the alert is generated in which case checking again after a few seconds may show the overlay.
Video playback duration for verified alerts may not exactly match the alert timestamps.
Report generation may not work correctly with this profile.
Some CR2 VLM inaccuracies might be observed with the public model.