
DPS Power Steering Controller#
The DPS Power Steering Controller continuously evaluates device telemetry and allocates GPU power within configured power domains. It is separate from the DPS metrics service and has its own Prometheus endpoint.
Use this page with Telemetry and Observability, and use Prometheus Monitoring for the scrape infrastructure.
Access the Endpoint#
The in-cluster controller service listens on port 8001. For a release named
dps, inspect it locally:
kubectl -n dps port-forward service/dps-power-controller 8001:8001
curl -sk https://127.0.0.1:8001/metrics
Confirm the generated Service name before port-forwarding a release with a
different name or override. Scrape this endpoint separately from the
<release>-server-metrics Service; its controller series do not appear on the
DPS endpoint.
Signals#
Signal |
Purpose |
|---|---|
Prometheus metrics |
Controller progress, telemetry coverage, budget behavior, and confirmed limits. |
Kubernetes logs |
Failed controller actions and the affected domain or device. |
OpenTelemetry traces |
Slow or failed stages in a control-loop iteration. |
Telemetry dumps |
Offline incident investigation when controller object-store recording is configured. |
CPU profiles |
Controller CPU diagnosis when profiling is configured. |
Set global.tempo.url to export traces and global.pyroscope.url to export
profiles. Both are optional. Limit access to all collected data because it can
identify topology and workload activity.
First Signals to Watch#
Metric |
Why it matters |
|---|---|
|
Its rate should remain positive while the controller is enabled. |
|
A sustained increase means controller iterations are failing. |
|
A low ratio means too few devices are reporting usable telemetry. |
|
A sustained nonzero sum means the selected devices are budget-bound. |
|
An unexpected value change means the domain budget changed. |
Controller Metric Catalog#
Device Metrics#
These gauges are labeled by domain, node, device_type, and
device_index. The under-allocation metric also has a node_active label.
Metric |
Meaning |
|---|---|
|
Lowest configured device limit. |
|
Highest configured device limit. |
|
Measured device draw for the current iteration. |
|
Limit computed and requested by the controller. |
|
Limit confirmed by DPS after the device update. |
|
Predicted near-term device demand. |
|
|
|
Measured draw minus the prior prediction. |
A device series can be absent when the controller receives no source reading. Alert on sustained loss of coverage instead of converting absent values to zero.
Domain, Pipeline, and Scheduler Metrics#
Area |
Metrics |
|---|---|
Domain |
|
Cluster |
|
Pipeline |
|
Scheduler |
|
Pipeline metrics use the step label. Scheduler skip metrics use the reason
label. The steerable budget is the domain budget minus static power.
Investigation Workflow#
Confirm that
power_steering_scheduler_executions_totalis increasing.Check
power_steering_cluster_telemetry_responding_ratioand the count of device-power series before changing allocation settings.Compare
power_steering_device_power_limit_wattsandpower_steering_device_actual_power_limit_watts. A persistent difference means a requested update was not confirmed.Sum
power_steering_device_under_allocationby domain. A sustained value above zero indicates a budget-bound workload, not a controller stall.Use pipeline and scheduler histograms to find the slow step, then inspect the matching trace and Kubernetes log window.
sum by (domain) (power_steering_device_under_allocation)
histogram_quantile(
  0.95,
  sum by (le) (
    rate(power_steering_scheduler_duration_seconds_bucket[$__rate_interval])
  )
)
sum by (step) (increase(power_steering_control_operation_errors_total[15m]))
When a telemetry dump is configured, capture the incident window before its retention period expires. Preserve the matching metrics and logs with it. A dump supports investigation, but it does not replace device response evidence for an applied limit.
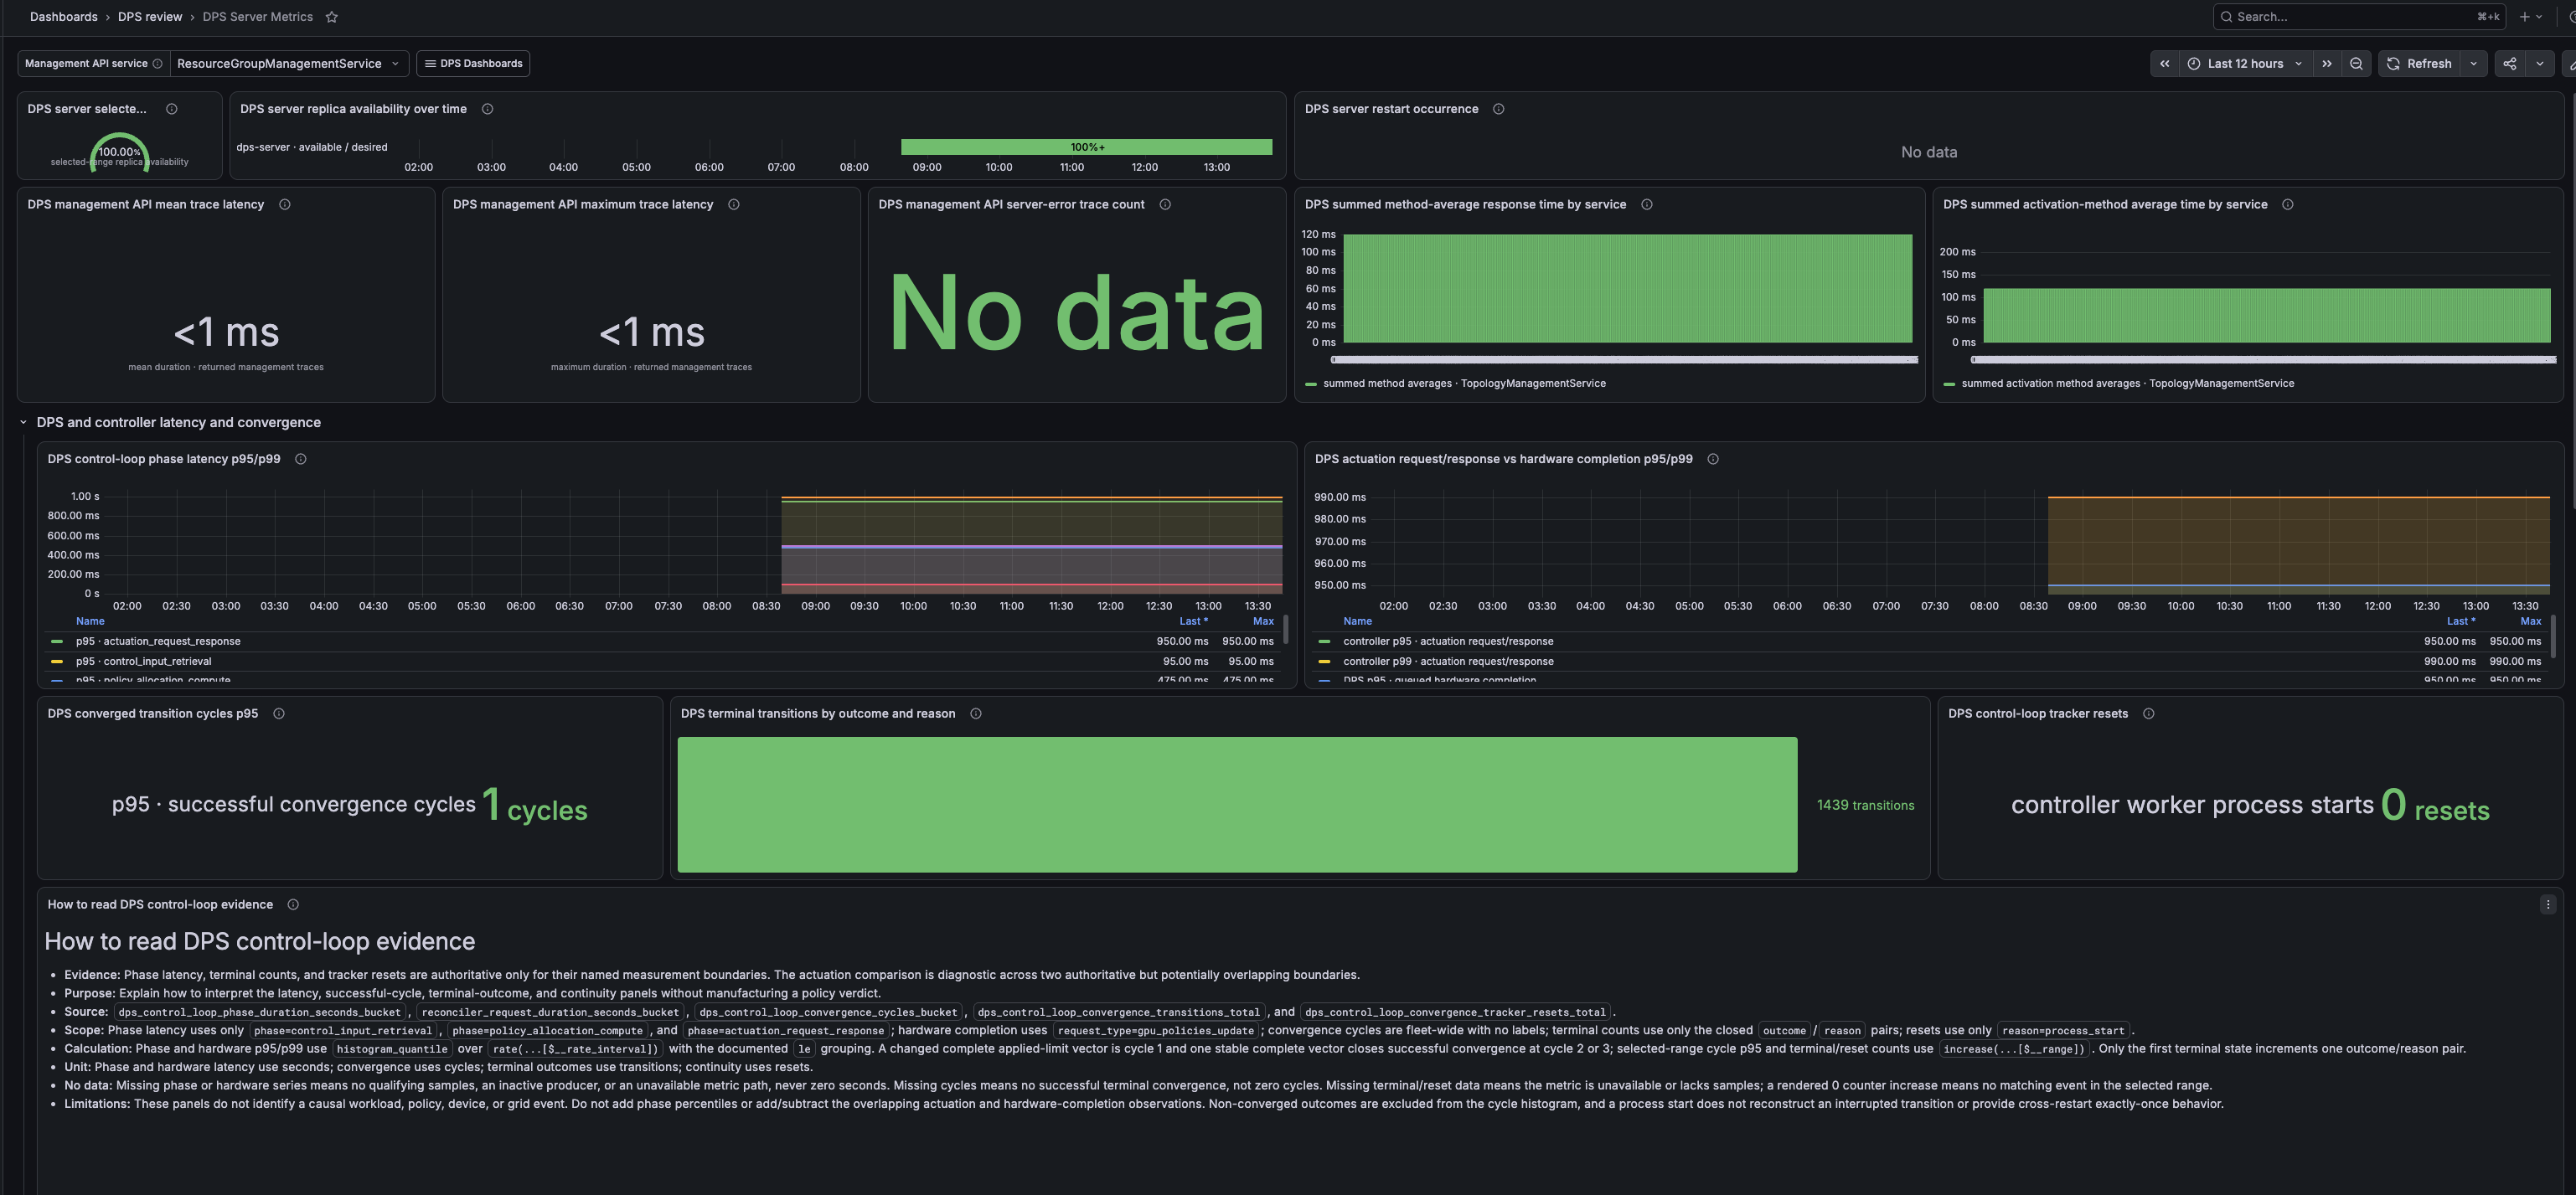
Use the controller panels in DPS Sample Dashboards as the first routine drill-down.
The following example shows server availability, API latency, and controller latency and convergence signals together.