

DPS Sample Dashboards#
DPS provides portable Grafana dashboard JSON files. They do not install Prometheus, Grafana, or a scrape configuration.
First configure collection through Prometheus Monitoring.
Then import a JSON file in Grafana and select a Prometheus datasource for
${DS_PROMETHEUS}. The dashboards avoid hard-coded namespaces and cluster
addresses.
Note
dps-sdk-dashboard.json is a scaffold with a placeholder panel and no metric
query. It is not an operational sample dashboard.
Import the Samples#
In Grafana, select Dashboards > New > Import, upload a JSON file,
and choose the Prometheus datasource for ${DS_PROMETHEUS}. Preserve the
dashboard variables; they scope queries to a topology, domain, resource group,
or node. The DPS Server Health Dashboard also requires configured log and trace
data sources.
The Datacenter Dashboard uses marcusolsson-treemap-panel and
ae3e-plotly-panel for treemap and grid views. Install these plugins when
those panels are required. Basic Prometheus panels do not require the optional
alerting datasource.
DPS Server Health Dashboard#
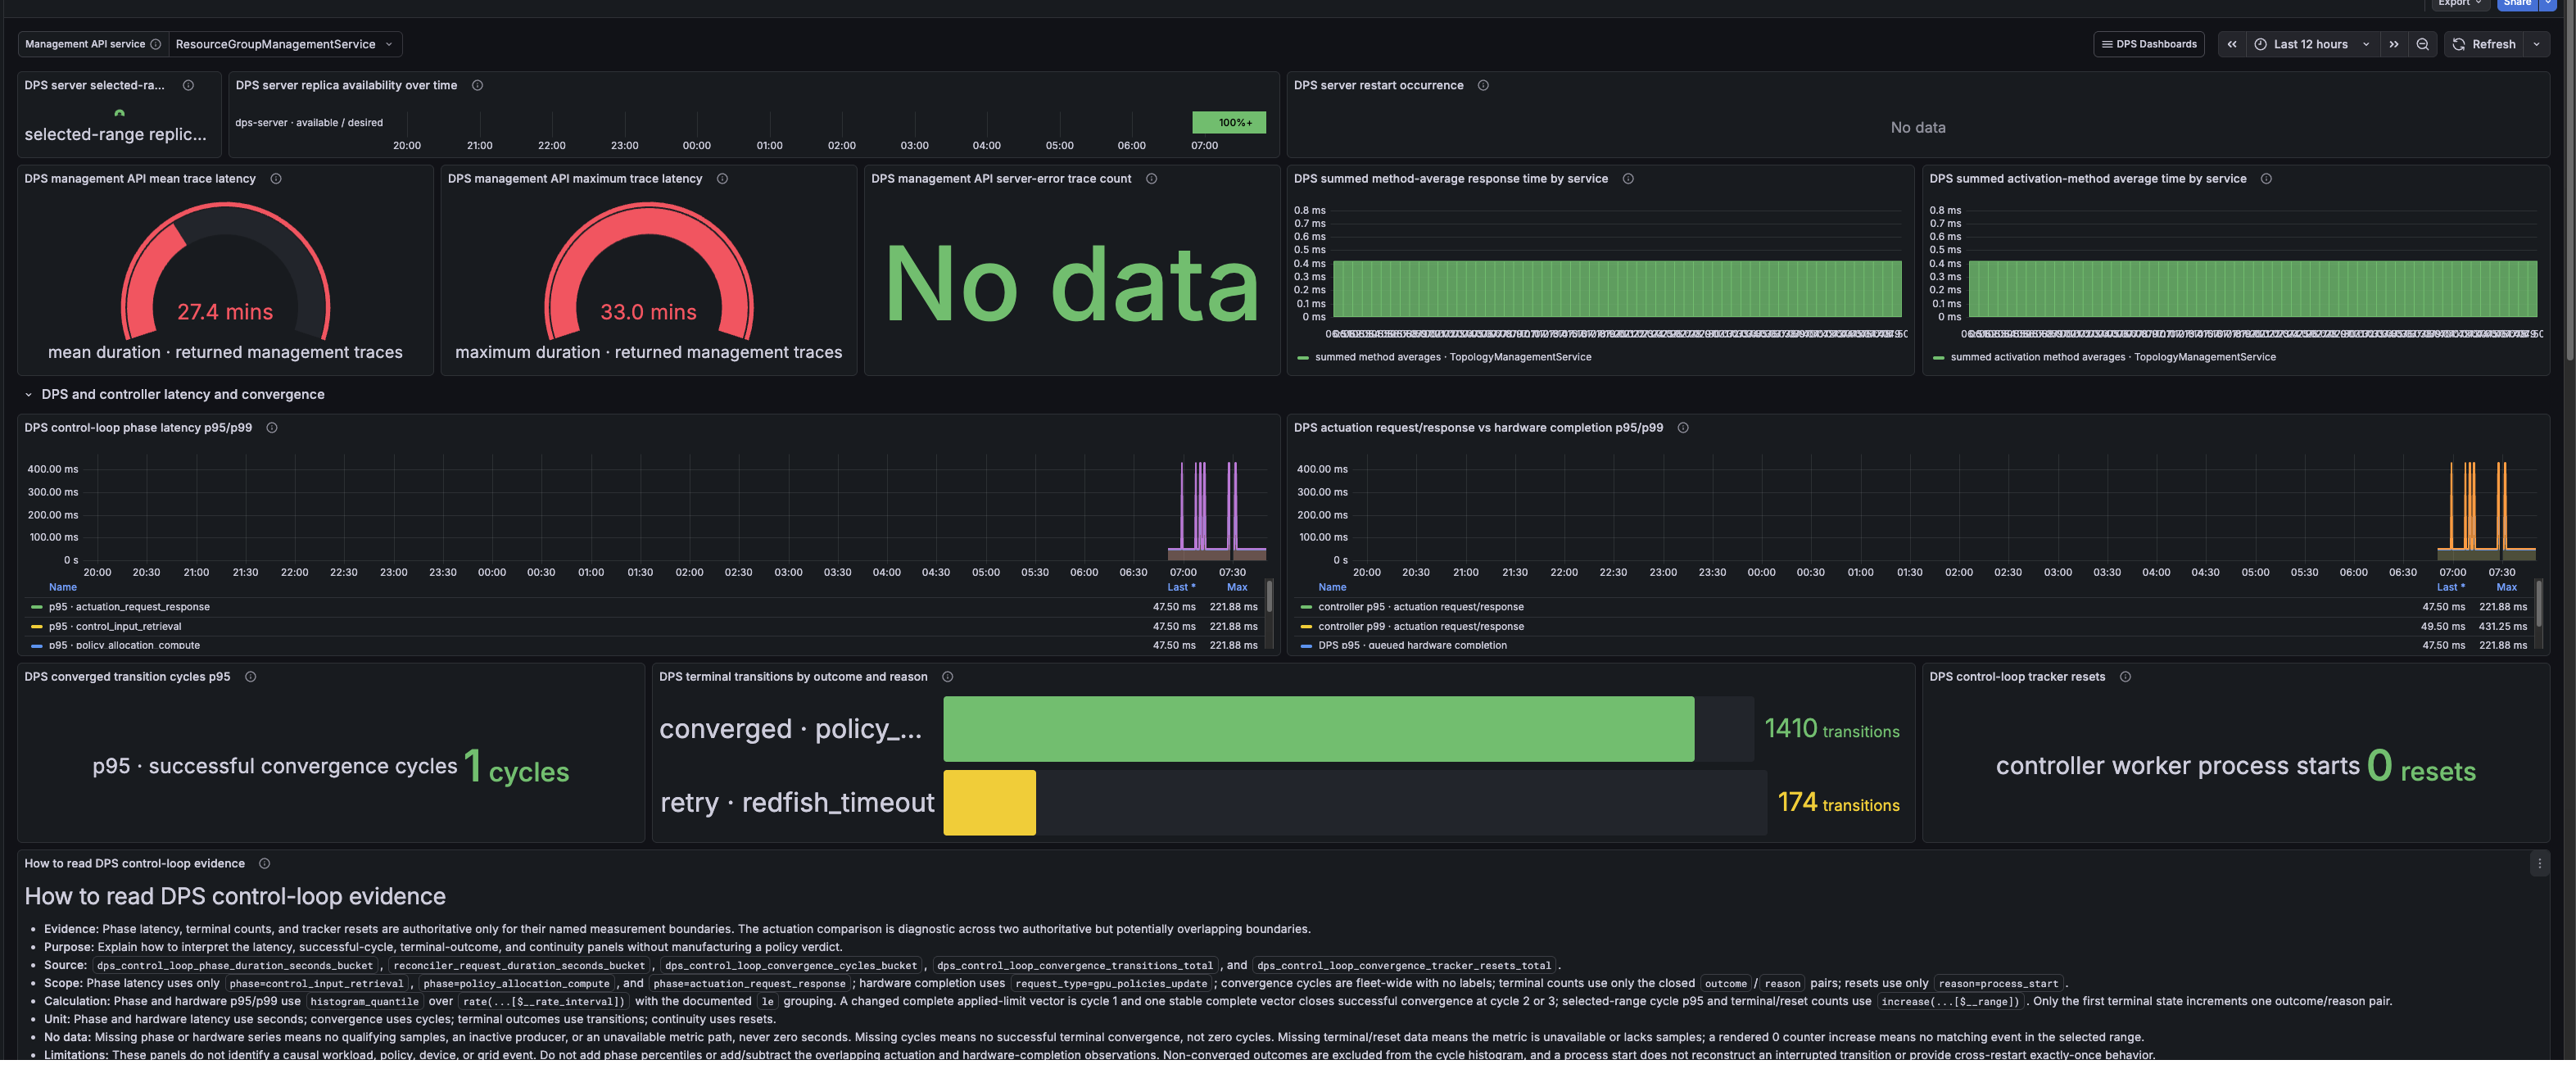
dps-server-trace.json provides DPS server availability and request-health
signals. It includes replica availability, restart occurrence, management API
latency and errors, method response and activation timing, and DPS control-loop
latency, convergence, terminal outcomes, and tracker resets.
The following example shows the server-health and control-loop view.
Datacenter Dashboard#
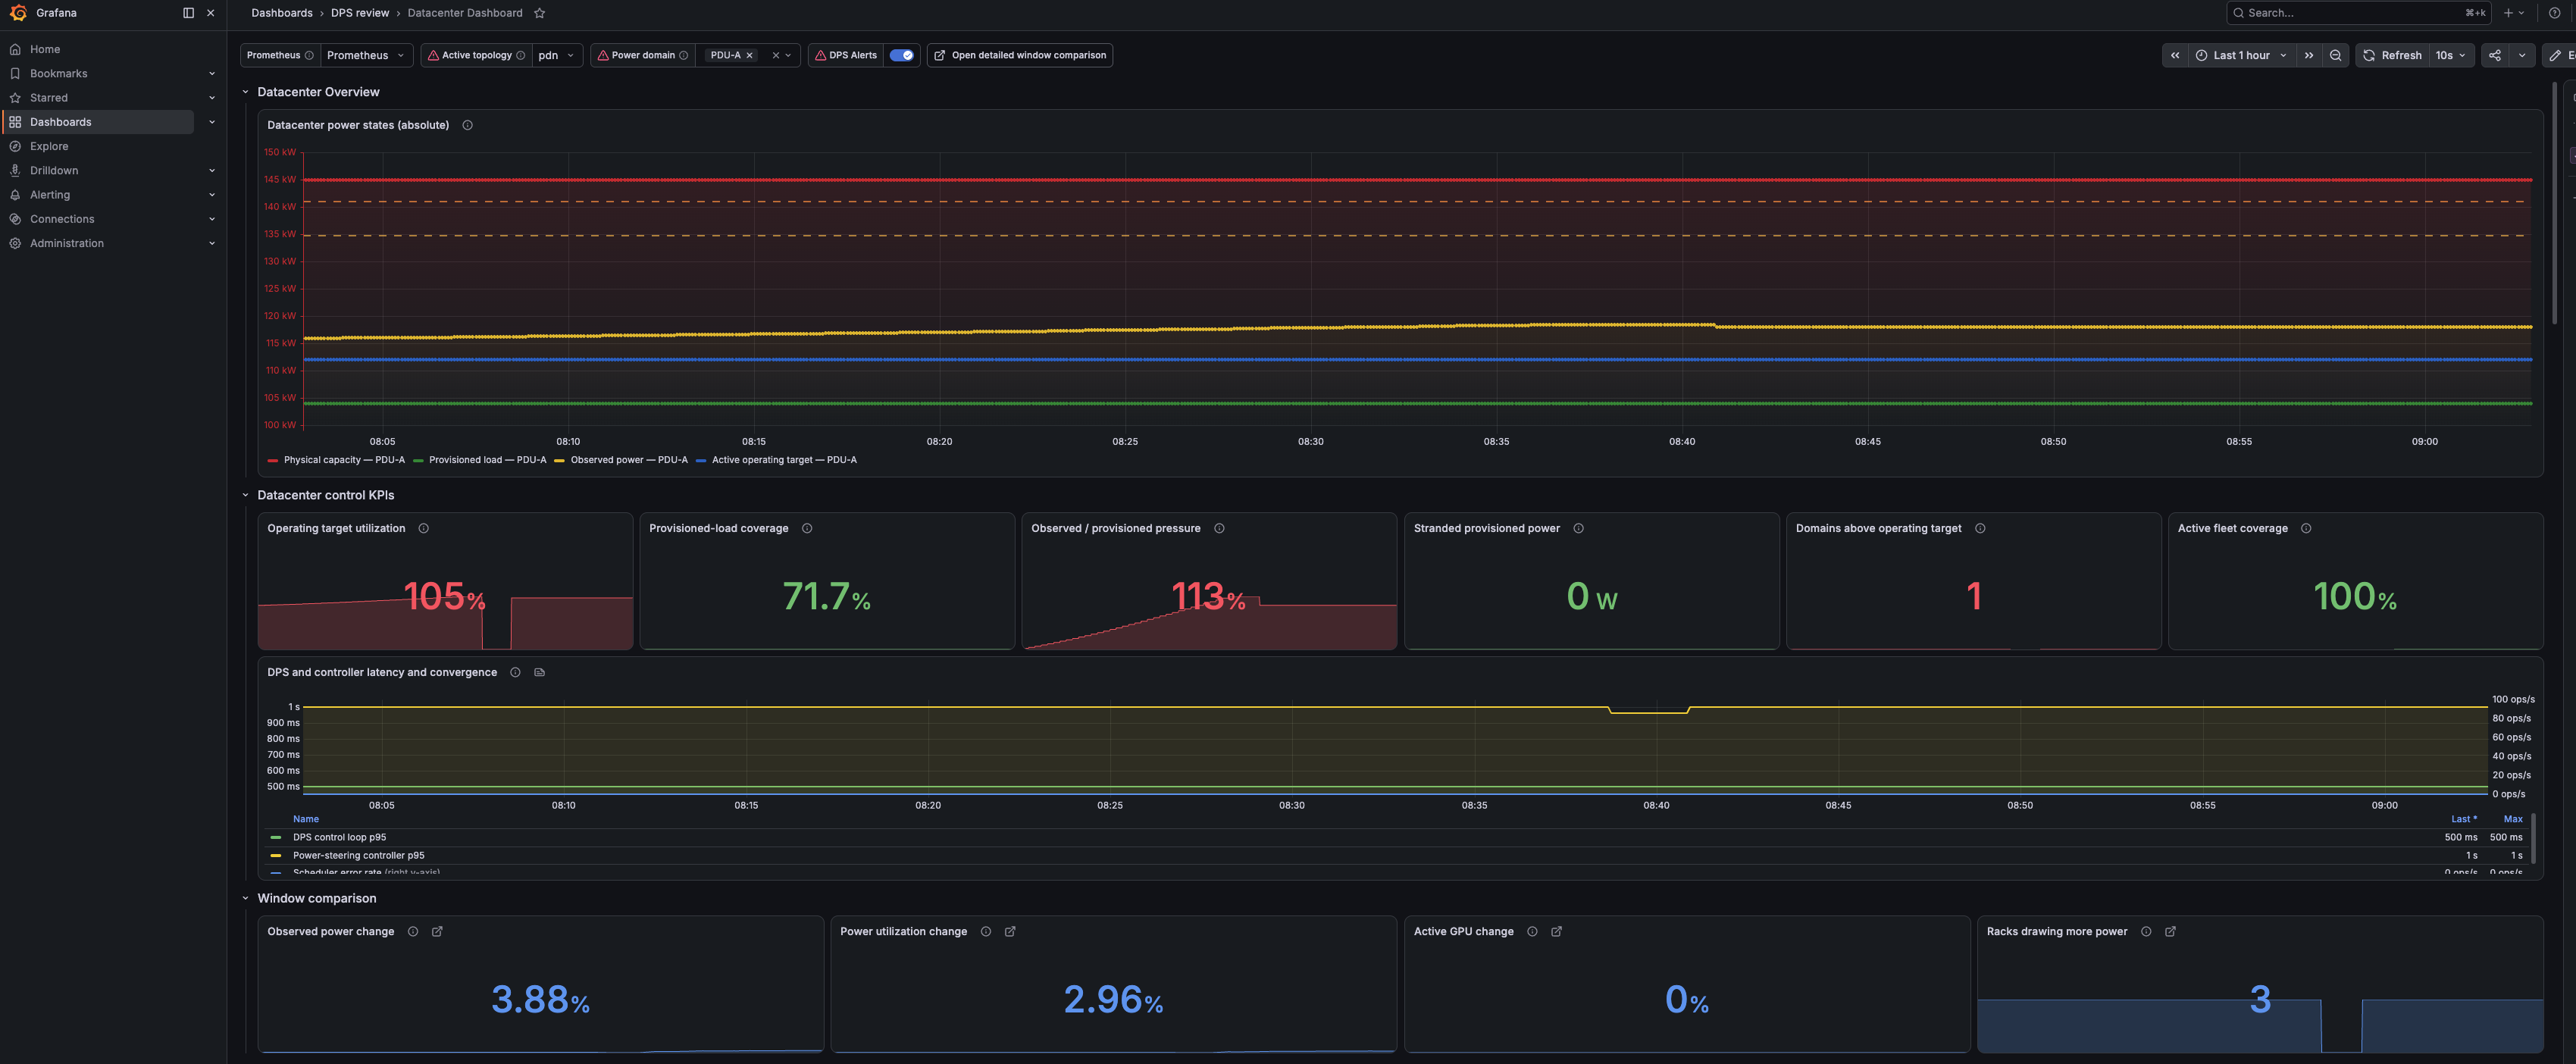
dps-sdk-datacenter.json provides the fleet-level view. It
refreshes every 10 seconds and filters by topology and domain.
Area |
What it shows |
Main metrics |
|---|---|---|
Power states |
Capacity, provisioned load, observed power, and active target |
|
Operating KPIs |
Target utilization, provisioned-load coverage, pressure, stranded power, active-fleet coverage, and domains above target |
Power-state metrics plus |
Redfish health |
Failed-request count, failure rate, and failures by class and route |
|
Controller health |
DPS and controller latency, convergence, and scheduler errors |
DPS control-loop and controller duration and error series |
Inventory and grid |
Domain ratios, topology entities, resource-group membership, and grid schedules |
|
The following example shows the power-state trend, data center KPIs, and controller latency and convergence panels.
The following example focuses on Redfish request health. It shows failed requests, the failure rate, failures grouped by class and route, and the related controller latency and convergence signals.

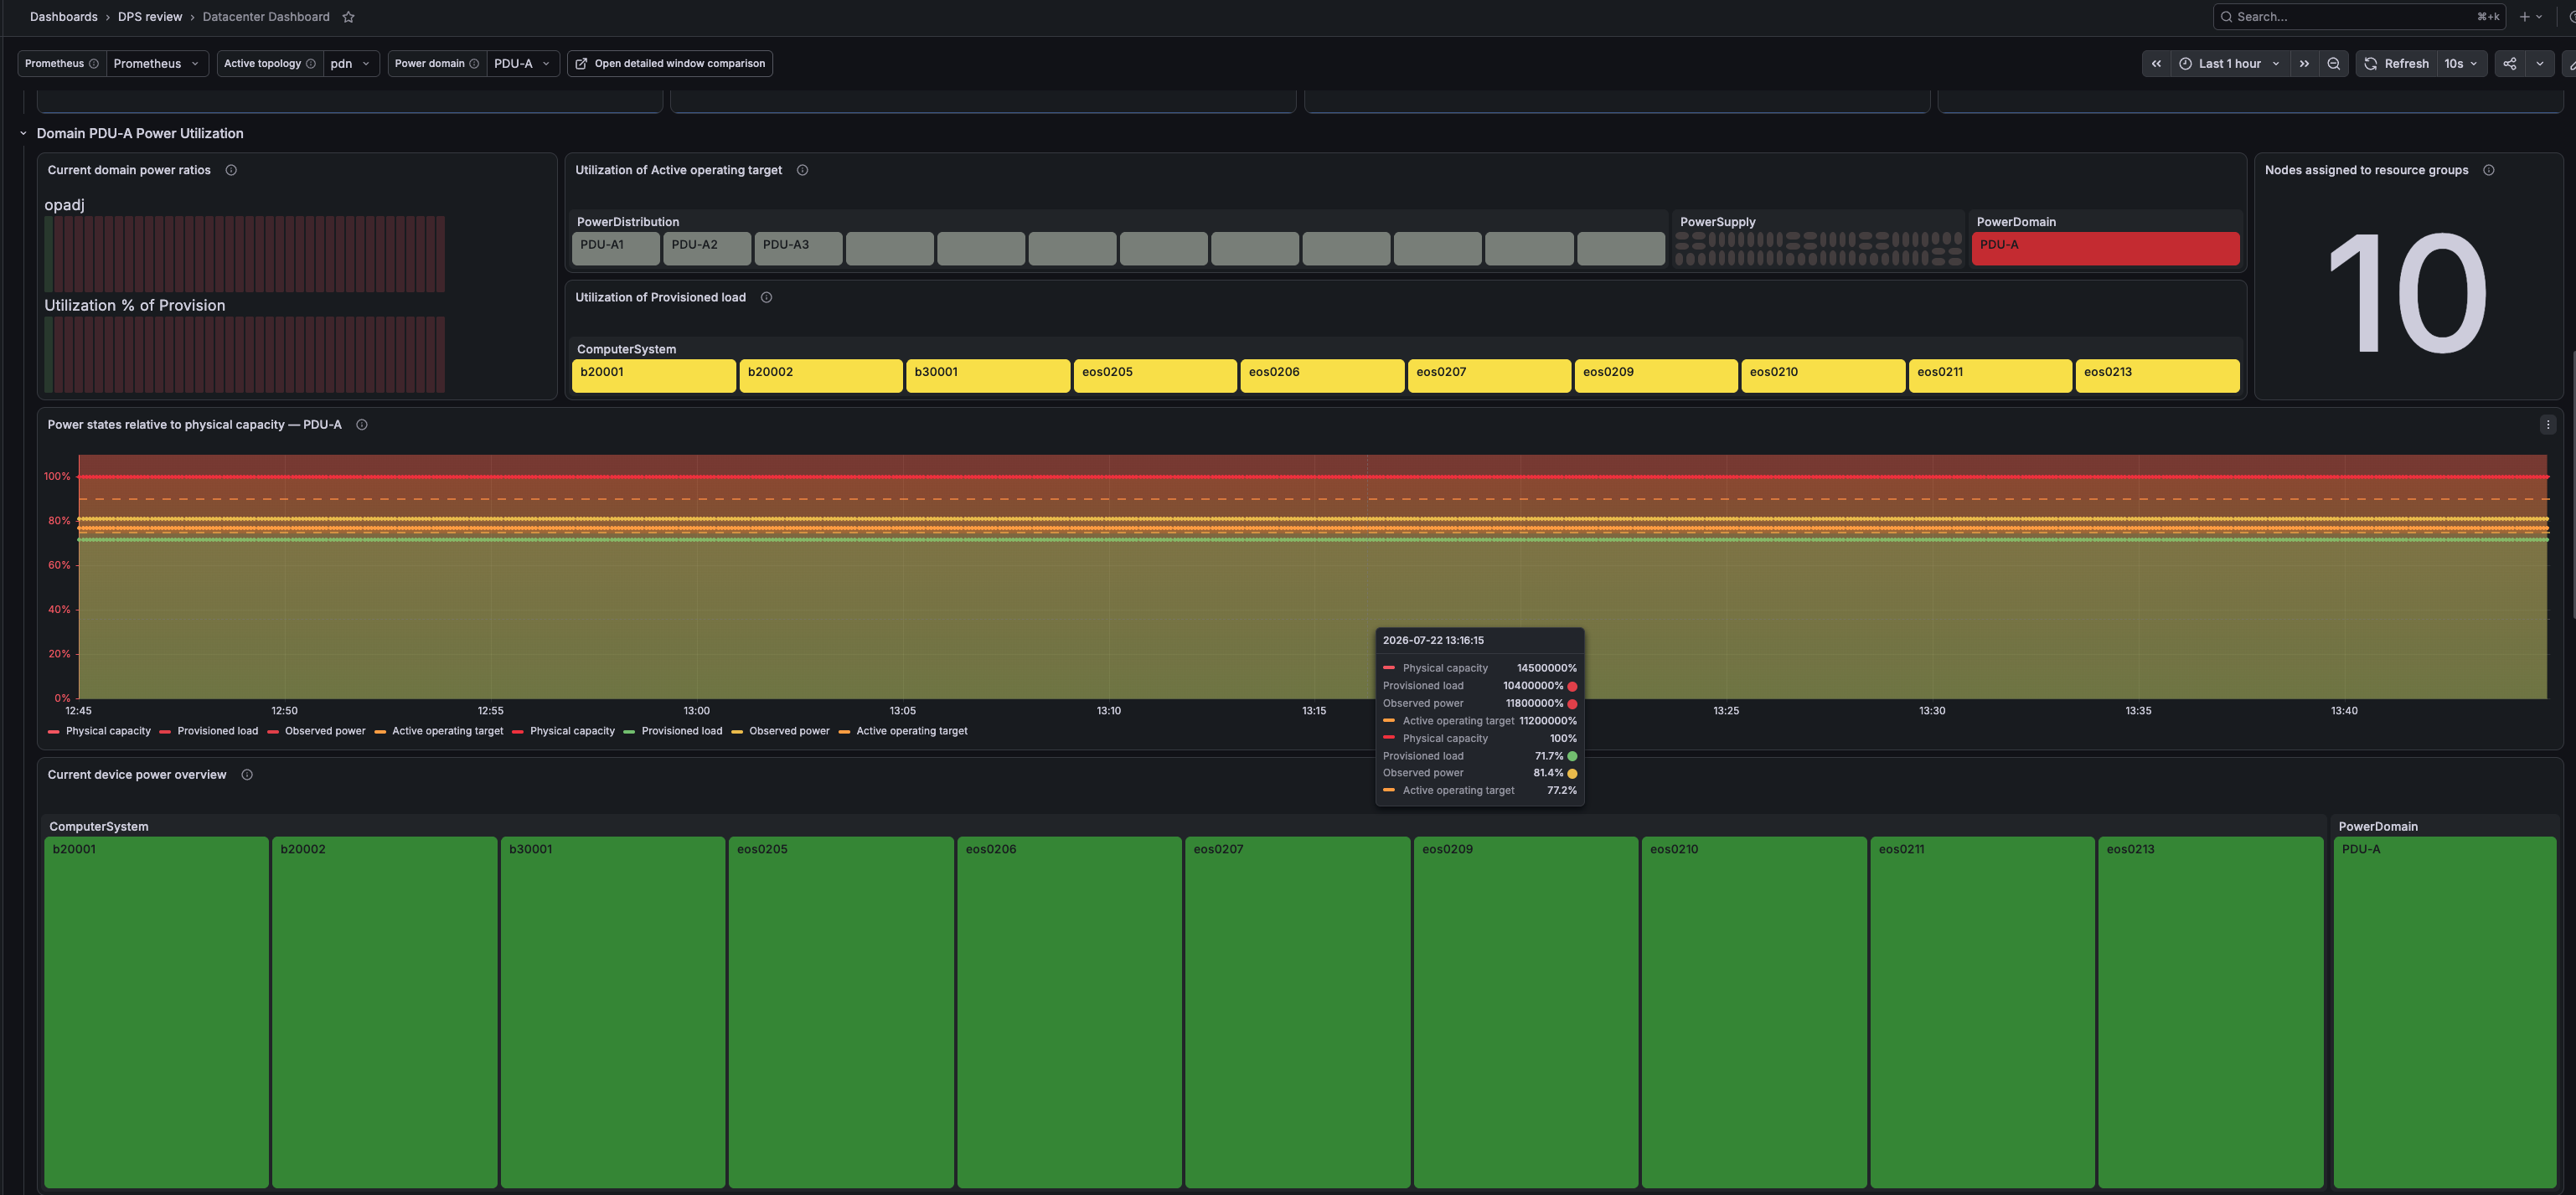
The following example shows a selected-domain drill-down with power ratios, utilization, resource-group membership, normalized power states, and device power distribution.
Resource Group Dashboard#
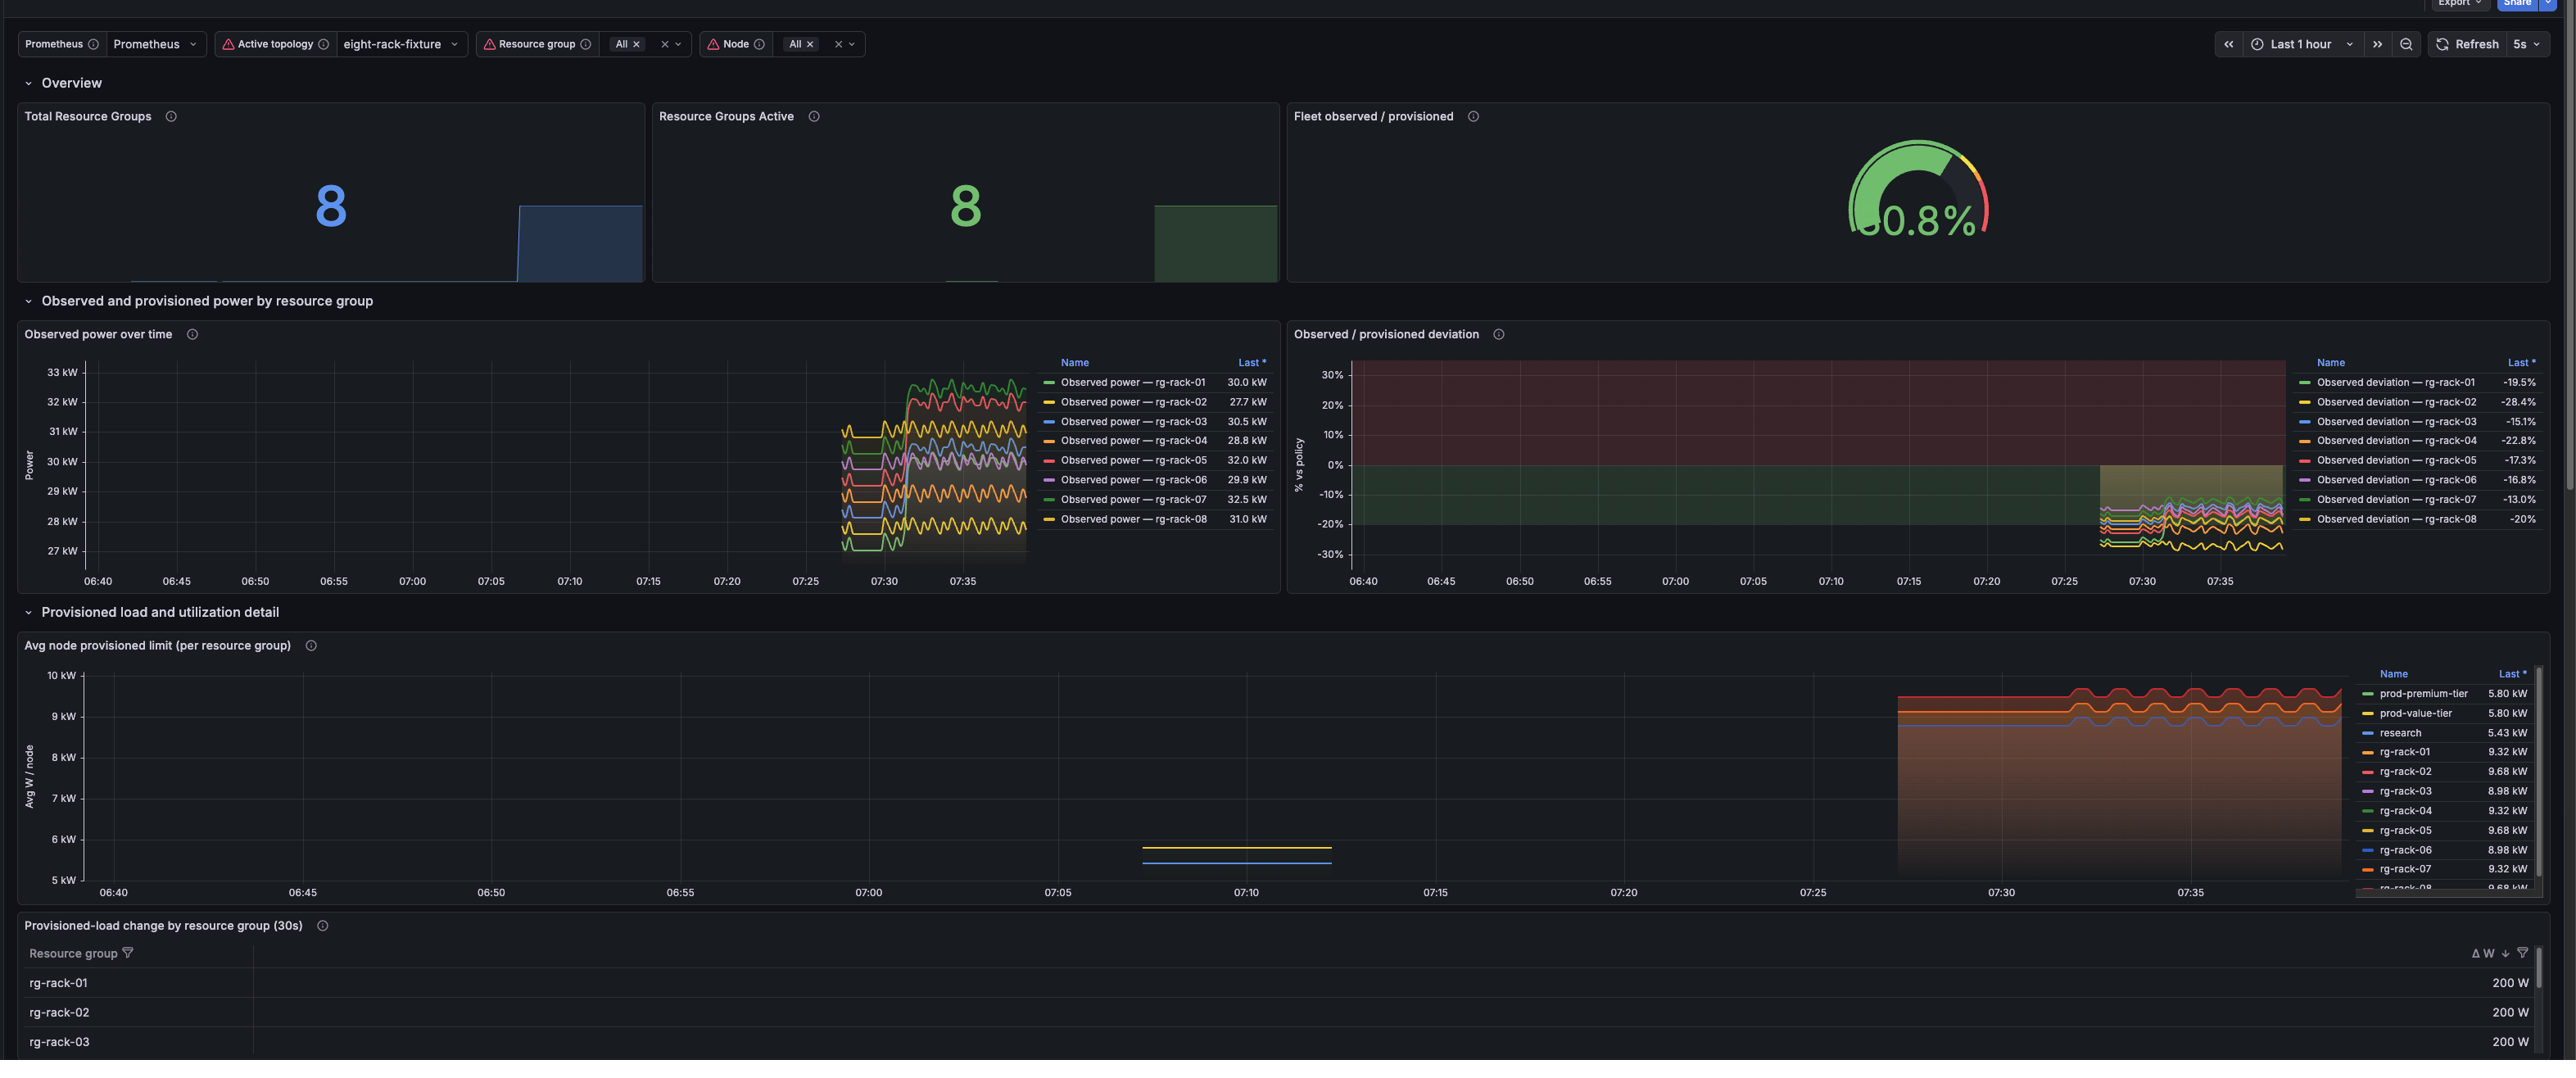
dps-sdk-resource-group.json is the workload-group view. It
refreshes every 10 seconds and filters by topology, resource group, and member
node.
Area |
What it shows |
|---|---|
Summary |
Total and active resource groups, membership, and fleet observed-versus-provisioned power. |
Power behavior |
Observed power, observed-versus-provisioned deviation, average node provisioned limit, and 30-second provisioned-load changes. |
Tables |
Power and utilization by resource group, group configuration, and nodes above provisioned load. |
It combines resource_group_count,
topology_service_resource_group_active_count, resource_group_devices,
device_total_power_watts, and topology-service provisioned-load metrics.
The following example shows the total and active resource-group summary, fleet observed-versus-provisioned power, observed-power and deviation trends, average provisioned limits, and 30-second provisioned-load changes.
MaxP Window Comparison Dashboard#
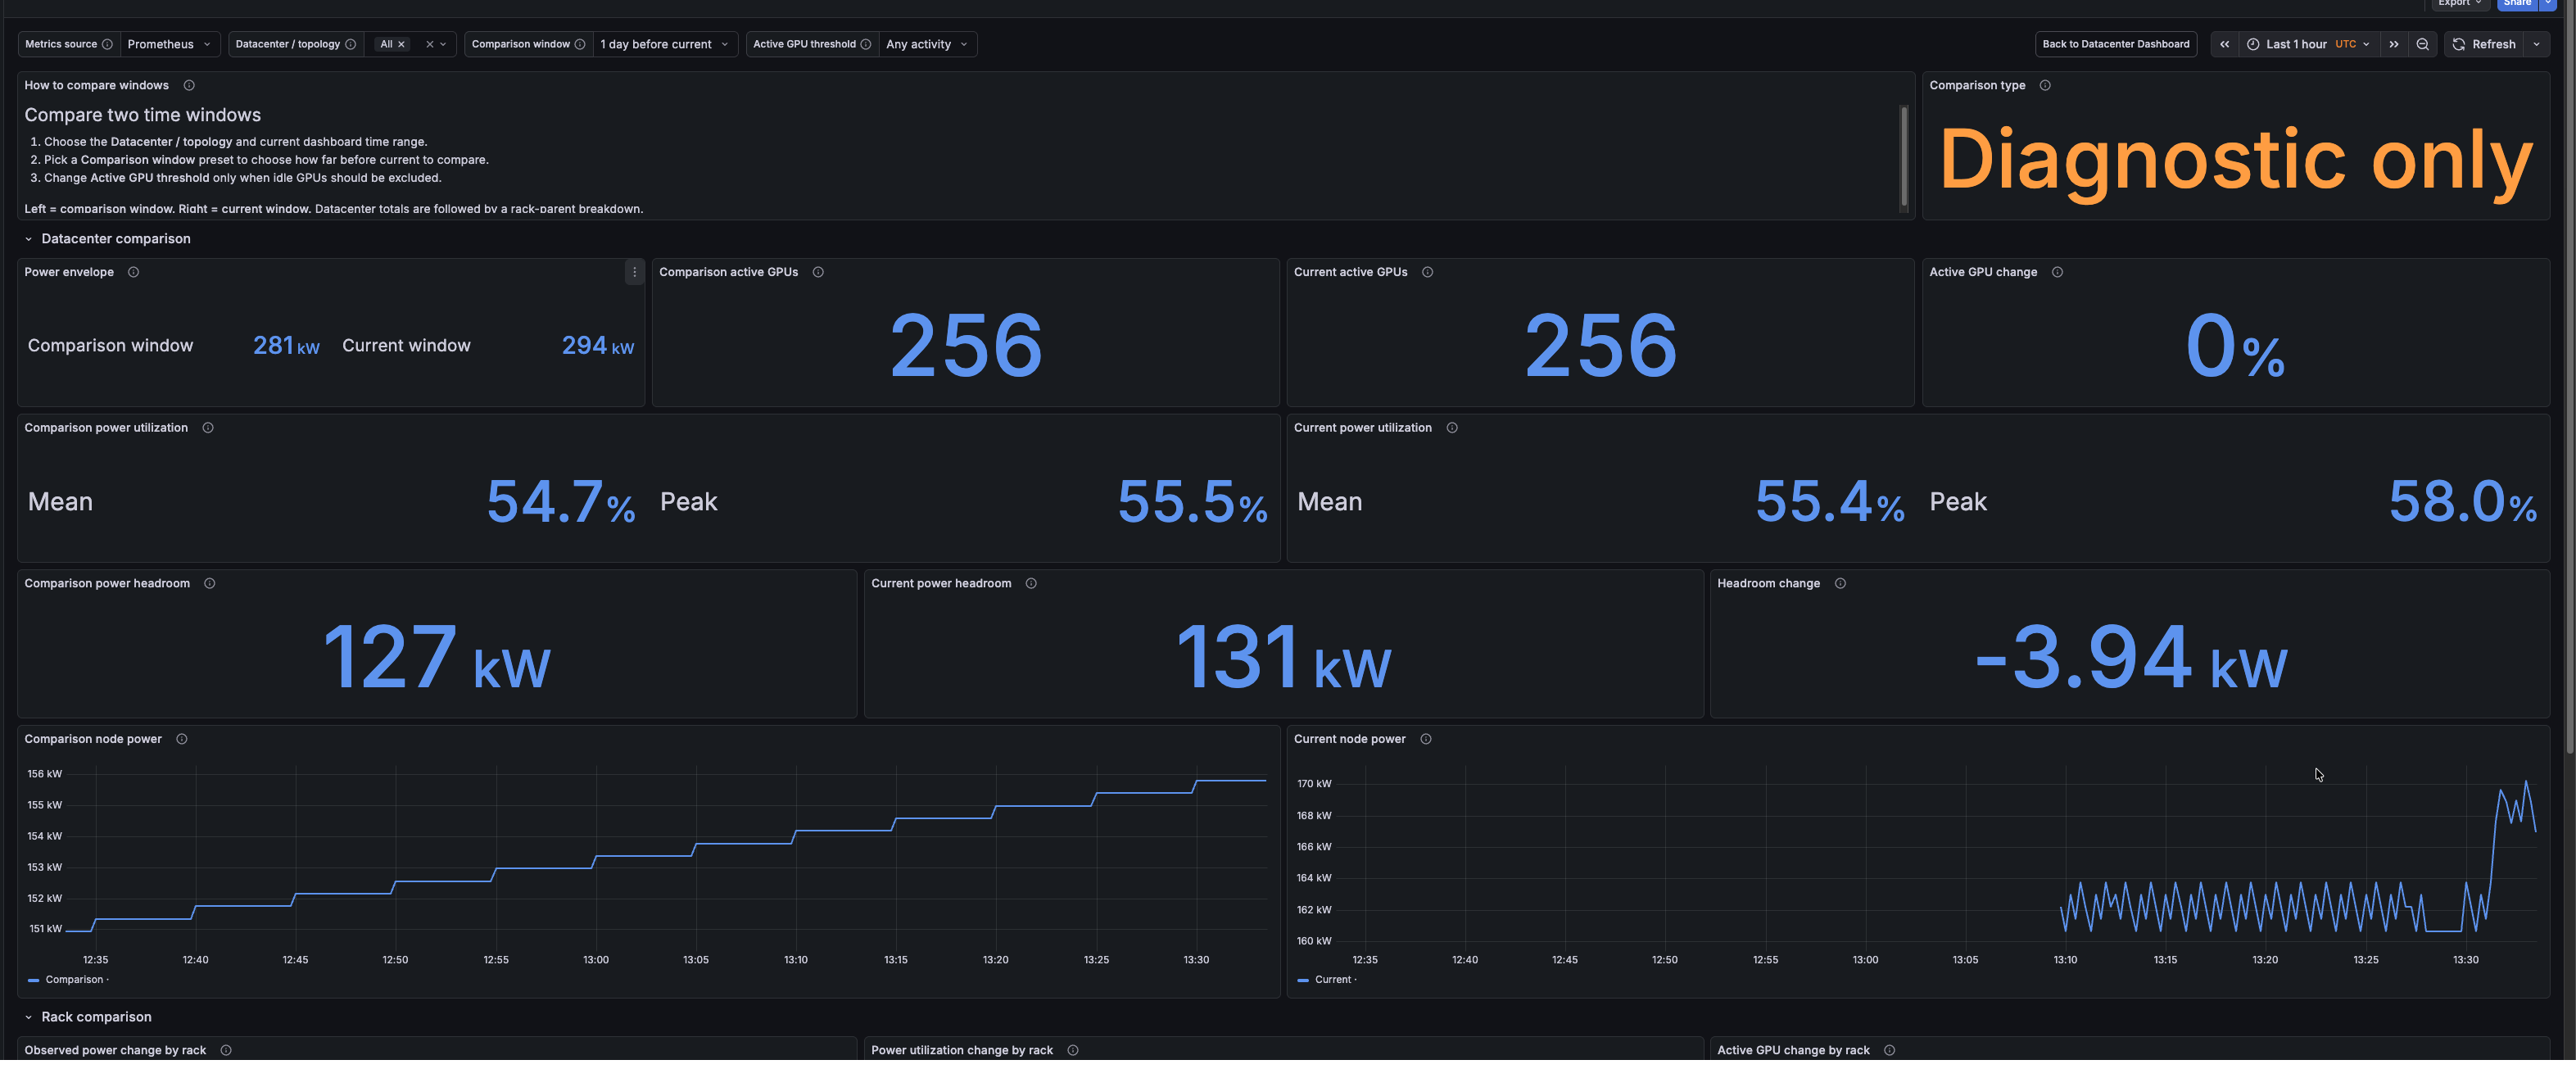
dps-sdk-maxp-comparison.json compares an operator-selected
Grafana time range with an earlier range. Select a topology, the Grafana time
range, baseline_offset, and the active-GPU threshold before interpretation.
It compares power envelope, active GPU counts, utilization, headroom, node
power, and rack-level changes using machine_nvm_avg_power_budget_watts,
DCGM_FI_DEV_POWER_USAGE, and DCGM_FI_DEV_GPU_UTIL.
Warning
This dashboard is an operator-selected diagnostic comparison. It does not create or retain release evidence. Record the time ranges, topology, and workload conditions separately.
The following example shows the diagnostic comparison view with comparison and current power envelopes, active GPU counts, utilization, headroom, and node-power panels.
Optional Alert Rules#
sdk-datacenter-alert-rules.yaml is an example Grafana alert
rule file, not a dashboard-import manifest. It assumes a datasource UID named
prometheus. Adapt the datasource, labels, routing, and thresholds before
provisioning it.