DOCA Telemetry Service
NVIDIA DOCA Telemetry Service Guide
This document provides instructions on how to use the DOCA Telemetry Service (DTS) container on top of NVIDIA® BlueField® DPU.
DOCA Telemetry Service (DTS) collects data from built-in providers and from external telemetry applications. The following providers are available:
- Data providers:
- sysfs
- ethtool
- tc (traffic control)
- Aggregation providers
- fluent_aggr
- prometheus_aggr
Sysfs provider is enabled by default.
DTS stores collected data into binary files under the /opt/mellanox/doca/services/telemetry/data directory. Data write is disabled by default due to BlueField storage restrictions.
DTS can export the data via Prometheus Endpoint (pull) or Fluent Bit (push).
DTS allows exporting NetFlow packets when data is collected from the DOCA Telemetry NetFlow API client application. NetFlow exporter is enabled from dts_config.ini by setting NetFlow collector IP/address and port.
For more information about the deployment of DOCA containers on top of the BlueField DPU, refer to NVIDIA DOCA Container Deployment Guide.
2.1. DOCA Service on NGC
DTS is available on NGC, NVIDIA's container catalog. Service-specific configuration steps and deployment instructions can be found under the service's container page.
2.2. DPU Deployment
DTS service starts automatically on BlueField boot according to the .yaml file located at /etc/kubelet.d/doca_telemetry_standalone.yaml. Removing the .yaml file from this path stops the automatic DTS boot.
DTS files can be found under the directory /opt/mellanox/doca/services/telemetry/.
- Container folder mounts:
configdataipc_sockets
- Backup files:
doca_telemetry_service_${version}_arm64.tar.gz– DTS imagedoca_telemetry_standalone.yaml– copy of the default boot.yamlfile
2.3. Host Deployment
DTS supports x86_64 hosts. The providers and exporters all run from a single docker container.
- Initialize and configure host DTS with:
            export DTS_IMAGE=nvcr.io/nvidia/doca/doca_telemetry
docker run -v "/opt/mellanox/doca/services/telemetry/config:/config" --rm --name doca-telemetry-init -ti $DTS_IMAGE/bin/bash -c "DTS_CONFIG_DIR=host /usr/bin/telemetry-init.sh"
- Run with:
            docker run -d --net=host --uts=host --ipc=host                                        \
              --privileged                                                            \
              --ulimit stack=67108864 --ulimit memlock=-1                             \
              --device=/dev/mst/                                                      \
              --device=/dev/infiniband/                                               \
              --gpus all                                                              \
              -v "/opt/mellanox/doca/services/telemetry/config:/config"               \
              -v "/opt/mellanox/doca/services/telemetry/ipc_sockets:/tmp/ipc_sockets" \
              -v "/opt/mellanox/doca/services/telemetry/data:/data"                   \
              -v "/usr/lib/mft:/usr/lib/mft"                                          \
              -v "/sys/kernel/debug:/sys/kernel/debug"                                \
              --rm --name doca-telemetry -it $DTS_IMAGE /usr/bin/telemetry-run.sh
2.4. Deployment with Grafana Monitoring
Refer to Deployment with Grafana Monitoring.
The configuration of DTS is placed under /opt/mellanox/doca/services/telemetry/config by DTS during initialization. The user can interact with the dts_config.ini file and fluent_bit_configs folder. dts_config.ini contains the main configuration for the service and must be used to enable/disable providers, exporters, data writing. More details are provided in the corresponding sections. For every update in this file, DST must be restarted. Interaction with fluent_bit_configs folder is described in section Fluent Bit.
3.1. Init Scripts
The InitContainers section of the .yaml file has 2 scripts for config initialization:
/usr/bin/telemetry-init.sh– generates the default configuration files if, and only if, the/opt/mellanox/doca/services/telemetry/configfolder is empty./usr/bin/enable-fluent-forward.sh– configures the destination host and port for Fluent Bit forwarding. The script requires that both the host and port are present, and only in this case it would start. The script overwrites the/opt/mellanox/doca/services/telemetry/config/fluent_bit_configsfolder and configures theforward.expfile.
3.2. Enabling Fluent Bit Forwarding
To enable Fluent Bit forward, add the destination host and port to the command line found in the initContainers section of the .yaml file:
command: ["/bin/bash", "-c", "/usr/bin/telemetry-init.sh && /usr/bin/enable-fluent-forward.sh -i=127.0.0.1 -p=24224"]
The host and port shown above are just an example. See section Fluent Bit to learn about manual configuration.
3.3. Generating Configuration
The configuration folder /opt/mellanox/doca/services/telemetry/config starts empty by default. Once the service starts, the initial scripts run as a part of the initial container and create configuration as described in section Enabling Fluent Bit Forwarding.
3.4. Resetting Configuration
Resetting the configuration can be done by deleting the content found in the configuration folder and restarting the service to generate the default configuration.
3.5. Enabling Providers
Providers are enabled from the dts_config.ini configuration file. Uncomment the enable-provider=$provider-name line to allow data collection for this provider. For example, uncommenting the following line enables the ethtool provider:
#enable-provider=ethtool
More information about telemetry providers can be found under the Providers section.
3.5.1. Remote Collection
Certain providers or components are unable to execute properly within the container due to various container limitations. Therefore, they would have to perform remote collection or execution. The following steps enable remote collection:
- Activate DOCA Privileged Executer (DPE), as DPE is the means by which remote collection is achieved:
systemctl start dpe
- Add
grpcbeforeprovider-name(i.e.,enable-provider=grpc.$provider-name). For example, the following line configures remote collection of thehcaperfprovider:enable-provider=grpc.hcaperf
- If there are any configuration lines that are provider-specific, then add the
grpcprefix as well. Building upon the previous example:grpc.hcaperf.mlx5_0=sample grpc.hcaperf.mlx5_1=sample
3.6. Enabling Data Write
Uncomment the following line in dts_config.ini:
#output=/data
Changes in dts_config.ini force the main DTS process to restart in 60 seconds to apply the new settings.
3.7. Enabling IPC with Non-container Program
To enable IPC between DTS and an application that runs outside of a container, please refer to section "Using IPC with Non-container Application" in the NVIDIA DOCA Telemetry Programming Guide
4.1. Providers
DTS supports on-board data collection from sysf, ethtool, and tc providers.
Fluent and Prometheus aggregator providers can collect the data from other applications.
4.1.1. Sysfs Counters List
The sysfs provider has several components: ib_port, hw_port, mr_cache, eth, hwmon and bf_ptm . By default, all the components (except bf_ptm) are enabled when the provider is enabled:
#disable-provider=sysfs
The components can be disabled separately. For instance, to disable eth:
enable-provider=sysfs
disable-provider=sysfs.eth
ib_port and ib_hvw are state counters which are collected per port. These counters are only collected for ports whose state is active.
- ib_port counters:
{hca_name}:{port_num}:ib_port_state {hca_name}:{port_num}:VL15_dropped {hca_name}:{port_num}:excessive_buffer_overrun_errors {hca_name}:{port_num}:link_downed {hca_name}:{port_num}:link_error_recovery {hca_name}:{port_num}:local_link_integrity_errors {hca_name}:{port_num}:multicast_rcv_packets {hca_name}:{port_num}:multicast_xmit_packets {hca_name}:{port_num}:port_rcv_constraint_errors {hca_name}:{port_num}:port_rcv_data {hca_name}:{port_num}:port_rcv_errors {hca_name}:{port_num}:port_rcv_packets {hca_name}:{port_num}:port_rcv_remote_physical_errors {hca_name}:{port_num}:port_rcv_switch_relay_errors {hca_name}:{port_num}:port_xmit_constraint_errors {hca_name}:{port_num}:port_xmit_data {hca_name}:{port_num}:port_xmit_discards {hca_name}:{port_num}:port_xmit_packets {hca_name}:{port_num}:port_xmit_wait {hca_name}:{port_num}:symbol_error {hca_name}:{port_num}:unicast_rcv_packets {hca_name}:{port_num}:unicast_xmit_packets
- ib_hw counters:
{hca_name}:{port_num}:hw_state {hca_name}:{port_num}:hw_duplicate_request {hca_name}:{port_num}:hw_implied_nak_seq_err {hca_name}:{port_num}:hw_lifespan {hca_name}:{port_num}:hw_local_ack_timeout_err {hca_name}:{port_num}:hw_out_of_buffer {hca_name}:{port_num}:hw_out_of_sequence {hca_name}:{port_num}:hw_packet_seq_err {hca_name}:{port_num}:hw_req_cqe_error {hca_name}:{port_num}:hw_req_cqe_flush_error {hca_name}:{port_num}:hw_req_remote_access_errors {hca_name}:{port_num}:hw_req_remote_invalid_request {hca_name}:{port_num}:hw_resp_cqe_error {hca_name}:{port_num}:hw_resp_cqe_flush_error {hca_name}:{port_num}:hw_resp_local_length_error {hca_name}:{port_num}:hw_resp_remote_access_errors {hca_name}:{port_num}:hw_rnr_nak_retry_err {hca_name}:{port_num}:hw_rx_atomic_requests {hca_name}:{port_num}:hw_rx_dct_connect {hca_name}:{port_num}:hw_rx_icrc_encapsulated {hca_name}:{port_num}:hw_rx_read_requests {hca_name}:{port_num}:hw_rx_write_requests
- ib_mr_cache counters:
Note:
nranges from 0 to 24.{hca_name}:mr_cache:size_{n}:cur {hca_name}:mr_cache:size_{n}:limit {hca_name}:mr_cache:size_{n}:miss mlx5_0:mr_cache:size_{n}:size
- eth counters:
{hca_name}:{device_name}:eth_collisions {hca_name}:{device_name}:eth_multicast {hca_name}:{device_name}:eth_rx_bytes {hca_name}:{device_name}:eth_rx_compressed {hca_name}:{device_name}:eth_rx_crc_errors {hca_name}:{device_name}:eth_rx_dropped {hca_name}:{device_name}:eth_rx_errors {hca_name}:{device_name}:eth_rx_fifo_errors {hca_name}:{device_name}:eth_rx_frame_errors {hca_name}:{device_name}:eth_rx_length_errors {hca_name}:{device_name}:eth_rx_missed_errors {hca_name}:{device_name}:eth_rx_nohandler {hca_name}:{device_name}:eth_rx_over_errors {hca_name}:{device_name}:eth_rx_packets {hca_name}:{device_name}:eth_tx_aborted_errors {hca_name}:{device_name}:eth_tx_bytes {hca_name}:{device_name}:eth_tx_carrier_errors {hca_name}:{device_name}:eth_tx_compressed {hca_name}:{device_name}:eth_tx_dropped {hca_name}:{device_name}:eth_tx_errors {hca_name}:{device_name}:eth_tx_fifo_errors {hca_name}:{device_name}:eth_tx_heartbeat_errors {hca_name}:{device_name}:eth_tx_packets {hca_name}:{device_name}:eth_tx_window_errors
- BlueField-2 hwmon counters:
{hwmon_name}:{l3cache}:CYCLES {hwmon_name}:{l3cache}:HITS_BANK0 {hwmon_name}:{l3cache}:HITS_BANK1 {hwmon_name}:{l3cache}:MISSES_BANK0 {hwmon_name}:{l3cache}:MISSES_BANK1 {hwmon_name}:{pcie}:IN_C_BYTE_CNT {hwmon_name}:{pcie}:IN_C_PKT_CNT {hwmon_name}:{pcie}:IN_NP_BYTE_CNT {hwmon_name}:{pcie}:IN_NP_PKT_CNT {hwmon_name}:{pcie}:IN_P_BYTE_CNT {hwmon_name}:{pcie}:IN_P_PKT_CNT {hwmon_name}:{pcie}:OUT_C_BYTE_CNT {hwmon_name}:{pcie}:OUT_C_PKT_CNT {hwmon_name}:{pcie}:OUT_NP_BYTE_CNT {hwmon_name}:{pcie}:OUT_NP_PKT_CNT {hwmon_name}:{pcie}:OUT_P_PKT_CNT {hwmon_name}:{tile}:MEMORY_READS {hwmon_name}:{tile}:MEMORY_WRITES {hwmon_name}:{tile}:MSS_NO_CREDIT {hwmon_name}:{tile}:VICTIM_WRITE {hwmon_name}:{tilenet}:CDN_DIAG_C_OUT_OF_CRED {hwmon_name}:{tilenet}:CDN_REQ {hwmon_name}:{tilenet}:DDN_REQ {hwmon_name}:{tilenet}:NDN_REQ {hwmon_name}:{trio}:TDMA_DATA_BEAT {hwmon_name}:{trio}:TDMA_PBUF_MAC_AF {hwmon_name}:{trio}:TDMA_RT_AF {hwmon_name}:{trio}:TPIO_DATA_BEAT {hwmon_name}:{triogen}:TX_DAT_AF {hwmon_name}:{triogen}:TX_DAT_AF
- BlueField-3 hwmon counters:
{hwmon_name}:{llt}:GDC_BANK0_RD_REQ {hwmon_name}:{llt}:GDC_BANK1_RD_REQ {hwmon_name}:{llt}:GDC_BANK0_WR_REQ {hwmon_name}:{llt}:GDC_BANK1_WR_REQ {hwmon_name}:{llt_miss}:GDC_MISS_MACHINE_RD_REQ {hwmon_name}:{llt_miss}:GDC_MISS_MACHINE_WR_REQ {hwmon_name}:{mss}:SKYLIB_DDN_TX_FLITS {hwmon_name}:{mss}:SKYLIB_DDN_RX_FLITS
- BlueField-3 bf_ptm counters:
bf:ptm:active_power_profile bf:ptm:atx_power_available bf:ptm:core_temp bf:ptm:ddr_temp bf:ptm:error_state bf:ptm:power_envelope bf:ptm:power_throttling_event_count bf:ptm:power_throttling_state bf:ptm:thermal_throttling_event_count bf:ptm:thermal_throttling_state bf:ptm:throttling_state bf:ptm:total_power bf:ptm:vr0_power bf:ptm:vr1_power
4.1.2. Power Thermal Counters
The bf_ptm component collects BlueField-3 power thermal counters using remote collection. It is disabled by default and can be enabled as follows:
- Load the kernel module
mlxbf-ptm:modprobe -v mlxbf-ptm
- Enable component using remote collection:
enable-provider=grpc.sysfs.bf_ptm
Note:DPE server should be active before changing the
dts_config.inifile. See Remote Collection for details.
4.1.3. Ethtool Counters
Ethtool counters is the generated list of counters which corresponds to Ethtool utility. Counters are generated on a per-device basis. See this community post for more information on mlx5 ethtool counters.
4.1.4. Traffic Control Info
The following TC objects are supported and reported regarding the ingress filters:
- Filters
- Actions
The info is provided as one of the following events:
- Basic filter event
- Flower/IPv4 filter event
- Flower/IPv6 filter event
- Basic action event
- Mirred action event
- Tunnel_key/IPv4 action event
- Tunnel_key/IPv6 action event
General notes:
- Actions always belong to a filter, so action events share the filter event's ID via the
event_iddata member - Basic filter event only contains textual kind (so users can see which real life objects' support they are lacking)
- Basic action event only contains textual kind and some basic common statistics if available
4.1.5. Fluent Aggregator
fluent_aggr listens on a port for Fluent Bit Forward protocol input connections. Received data can be streamed via a Fluent Bit exporter.
The default port is 42442. This can be changed by updating the following option:
fluent-aggr-port=42442
4.1.6. Prometheus Aggregator
prometheus_aggr polls data from a list of Prometheus endpoints.
Each endpoint is listed in the following format:
prometheus_aggr_endpoint.{N}={host_name},{host_port_url},{poll_inteval_msec}
Where N starts from 0.
Aggregated data can be exported via a Prometheus aggregator exporter endpoint.
4.1.7. Network Interfaces
ifconfig collects network interface data. To enable, set:
enable-provider=ifconfig
If the Prometheus endpoint is enabled, add the following configuration to cache every collected network interface and arrange the index according to their names:
prometheus-fset-indexes=name
Metrices are collected for each network interface as follows:
name
rx_packets
tx_packets
rx_bytes
tx_bytes
rx_errors
tx_errors
rx_dropped
tx_dropped
multicast
collisions
rx_length_errors
rx_over_errors
rx_crc_errors
rx_frame_errors
rx_fifo_errors
rx_missed_errors
tx_aborted_errors
tx_carrier_errors
tx_fifo_errors
tx_heartbeat_errors
tx_window_errors
rx_compressed
tx_compressed
rx_nohandler
4.1.8. HCA Performance
hcaperf collects HCA performance data. Since it requires access to an RDMA device, it must use remote collection on the DPU. On the host, the user runs the container in privileged mode and RDMA device mount.
The counter list is device dependent.
4.1.8.1. hcaperf DPU Configuration
To enable hcaperf in remote collection mode, set:
enable-provider=grpc.hcaperf
# specify HCAs to sample
            grpc.hcaperf.mlx5_0=sample
grpc.hcaperf.mlx5_1=sample
DPE server should be active before changing the dts_config.ini file. See section Remote Collection for details.
4.1.8.2. hcaperf DPU Configuration
To enable hcaperf in regular mode, set:
            enable-provider=hcaperf

# specify HCAs to sample
hcaperf.mlx5_0=sample
hcaperf.mlx5_1=sample
4.1.9. NVIDIA System Management Interface
The nvidia-smi provider collects GPU and GPU process information provided by the system management interface.
This provider is supported only on x86_64 hosts with installed GPUs. All GPU cards supported by nvidia-smi are supported by this provider.
The counter list is GPU dependent. Additionally, per-process information is collected for the first 20 (by default) nvidia_smi_max_processes processes.
Counters can be either collected as string data "as is" in nvidia-smi or converted to numbers when nvsmi_with_numeric_fields is set.
To enable nvidia-smi provider and change parameters, set:
            enable-provider=nvidia-smi

# Optional parameters:
#nvidia_smi_max_processes=20
#nvsmi_with_numeric_fields=1
4.1.10. DCGM
The dcgm provider collects GPU information provided by the NVIDIA data center GPU manager (DCGM) API.
This provider is supported only on x86_64 hosts with installed GPUs, and requires running the nv-hostengine service (refer to DCGM documentation for details).
DCGM counters are split into several groups by context:
- GPU – basic GPU information (always)
- COMMON – common fields that can be collected from all devices
- PROF – profiling fields
- ECC – ECC errors
- NVLINK / NVSWITCH / VGPU – fields depending on the device type
To enable DCGM provider and counter groups, set:
            enable-provider=dcgm

dcgm_events_enable_common_fields=1
#dcgm_events_enable_prof_fields=0
#dcgm_events_enable_ecc_fields=0
#dcgm_events_enable_nvlink_fields=0
#dcgm_events_enable_nvswitch_fields=0
#dcgm_events_enable_vgpu_fields=0
4.2. Data Outputs
DTS can send the collected data to the following outputs:
- Data writer (saves binary data to disk)
- Fluent Bit (push-model streaming)
- Prometheus endpoint (keeps the most recent data to be pulled).
4.2.1. Data Writer
The data writer is disabled by default to save space on BlueField. Steps for activating data write during debug can be found under section Enabling Data Write.
The schema folder contains JSON-formatted metadata files which allow reading the binary files containing the actual data. The binary files are written according to the naming convention shown in the following example (apt install tree):
            tree /opt/mellanox/doca/services/telemetry/data/
/opt/mellanox/doca/services/telemetry/data/
├── {year}
│   └── {mmdd}
│        └── {hash}
│             ├── {source_id}
│             │   └── {source_tag}{timestamp}.bin
│             └── {another_source_id}
│                  └── {another_source_tag}{timestamp}.bin
└── schema
    └── schema_{MD5_digest}.json
New binary files appears when the service starts or when binary file age/size restriction is reached. If no schema or no data folders are present, refer to the Troubleshooting section.
source_id is usually set to the machine hostname. source_tag is a line describing the collected counters, and it is often set as the provider's name or name of user-counters.
Reading the binary data can be done from within the DTS container using the following command:
crictl exec -it <Container ID> /opt/mellanox/collectx/bin/clx_read -s /data/schema /data/path/to/datafile.bin
The path to the data file must be an absolute path.
Example output:
            {
    "timestamp": 1634815738799728,
    "event_number": 0,
    "iter_num": 0,
    "string_number": 0,
    "example_string": "example_str_1"
}
{
    "timestamp": 1634815738799768,
    "event_number": 1,
    "iter_num": 0,
    "string_number": 1,
    "example_string": "example_str_2"
}
…
4.2.2. Prometheus
The Prometheus endpoint keeps the most recent data to be pulled by the Prometheus server and is enabled by default. To check that data is available, run the following command on BlueField:
curl -s http://0.0.0.0:9100/metrics
The command dumps every counter in the following format:
counter_name {list of label fields} counter_value timestamp
The default port for Prometheus can be changed in dts_config.ini.
4.2.3. Configuration Details
Prometheus is configured as a part of dts_config.ini. By default, the Prometheus HTTP endpoint is set to port 9100. Comment this line out to disable Prometheus export.
prometheus=http://0.0.0.0:9100
Prometheus can use the data field as an index to keep several data records with different index values. Index fields are added to Prometheus labels.
            # Comma-separated counter set description for Prometheus indexing:
#prometheus-indexes=idx1,idx2

# Comma-separated fieldset description for prometheus indexing
#prometheus-fset-indexes=idx1,idx2
The default fset index is device_name. It allows Prometheus to keep ethtool data up for both the p0 and p1 devices.
prometheus-fset-indexes=device_name
If the fset index is not set, the data from p1 overwrites p0's data.
For quick name filtering, the Prometheus exporter supports being provided with a comma-separated list of counter names to be ignored:
#prometheus-ignore-names=counter_name1,counter_name_2
For quick filtering of data by tag, the Prometheus exporter supports being provided with a comma-separated list of data source tags to be ignored.
Users should add tags for all streaming data since the Prometheus exporter cannot be used for streaming. By default, FI_metrics are disabled.
prometheus-ignore-tags=FI_metrics
4.2.4. Prometheus Aggregator Exporter
Prometheus aggregator exporter is an endpoint that keeps the latest aggregated data using prometheus_aggr. This exporter labels data according to its source. To enable this provider, users must set 2 parameters in dts_config.ini:
            prometheus-aggr-exporter-host=0.0.0.0
prometheus-aggr-exporter-port=33333
4.2.5. Fluent Bit
Fluent Bit allows streaming to multiple destinations. Destinations are configured in .exp files that are documented in-place and can be found under:
/opt/mellanox/doca/services/telemetry/config/fluent_bit_configs
Fluent Bit allows exporting data via "Forward" protocol which connects to the Fluent Bit/FluentD instance on customer side. Export can be enabled manually:
- Uncomment the line with
fluent_bit_configs=indts_config.ini. - Set
enable=1in required.expfiles for the desired plugins. - Additional configurations can be set according to instructions in the
.expfile if needed. - Restart the DTS.
- Set up receiving instance of Fluent Bit/FluentD if needed.
- See the data on the receiving side.
Export file destinations are set by configuring .exp files or creating new ones. It is recommended to start by going over documented example files. Documented examples exist for the following supported plugins:
- forward
- file
- stdout
- kafka
- es (elastic search)
- influx
All .exp files are disabled by default if not configured by initContainer entry point through .yaml file.
To forward the data to several destinations, create several forward_{num}.exp files. Each of these files must have their own destination host and port.
4.2.5.1. Export File Configuration Details
Each export destination has the following fields:
name– configuration nameplugin_name– Fluent Bit plugin nameenable– 1 or 0 values to enable/disable this destinationhost– the host for Fluent Bit pluginport– port for Fluent Bit pluginmsgpack_data_layout– the msgpacked data format. Default isflb_std. The other option iscustom. See section Msgpack Data Layout for details.plugin_key=val– key-value pairs of Fluent Bit plugin parameter (optional)counterset/fieldset– file paths (optional). See details in section Cset/Fset Filtering.source_tag=source_tag1,source_tag2– comma separated list of data page source tags for filtering. The rest tags will be filtered out during export.
Use # to comment a configuration line.
4.2.5.2. Msgpack Data Layout
Data layout can be configured using .exp files by setting msgpack_data_layout=layout. There are two available layouts: Standard and Custom.
The standard flb_std data layout is an array of 2 fields:
- timestamp double value
- a plain dictionary (key-value pairs)
The standard layout is appropriate for all Fluent Bit plugins. For example:
[timestamp_val, {"timestamp"->ts_val, type=>"counters/events", "source"=>"source_val", "key_1"=>val_1, "key_2"=>val_2,...}]
The custom data layout is a dictionary of meta-fields and counter fields. Values are placed into a separate plain dictionary. Custom data format can be dumped with stdout_raw output plugin of Fluent-Bit installed, or can be forwarded with forward output plugin.
Counters example:
{"timestamp"=>timestamp_val, "type"=>"counters", "source"=>"source_val", "values"=> {"key_1"=>val_1, "key_2"=>val_2,...}}
Events example
{"timestamp"=>timestamp_val, "type"=>"events", "type_name"=>"type_name_val", "source"=>" source_val", "values"=>{"key_1"=>val_1, "key_2"=>val_2,...}}
4.2.5.3. Cset/Fset Filtering
Each export file can optionally use one cset and one fset file to filter UFM telemetry counters and events data.
- Cset file contains tokens per line to filter data with
"type"="counters". - Fset contains several blocks started with the header line
[event_type_name]and tokens under that header. An Fset file is used to filter data with"type"="events".Note:Event type names could be prefixed to apply the same tokens to all fitting types. For example, to filter all ethtool events, use
[ethtool_event_*].
If several tokens must be matched simultaneously, use <tok1>+<tok2>+<tok3>. Exclusive tokens are available as well. For example, the line <tok1>+<tok2>-<tok3>-<tok4> filters names that match both tok1 and tok2 and do not match tok3 or tok4.
The following are the details of writing cset files:
            # Put tokens on separate lines
# Tokens are the actual name 'fragments' to be matched
# port$ # match names ending with token "port"
# ^port # match names starting with token "port"
# ^port$ # include name that is exact token "port
# port+xmit # match names that contain both tokens "port" and "xmit"
# port-support # match names that contain the token "port" and do not match the "-" token "support"
#
# Tip: To disable counter export put a single token line that fits nothing
The following are the details of writing fset files:
            # Put your events here
# Usage:
#
# [type_name_1]
# tokens
# [type_name_2]
# tokens
# [type_name_3]
# tokens
# ...
# Tokens are the actual name 'fragments' to be matched
# port$ # match names ending with token "port"
# ^port # match names starting with token "port"
# ^port$ # include name that is exact token "port
# port+xmit # match names that contain both tokens "port" and "xmit"
# port-support # match names that contain the token "port" and do not match the "-" token "support"

# The next example will export all the "tc" events and all events with type prefix "ethtool_" "ethtool" are filtered with token "port":
# [tc]
#
# [ethtool_*]
# packet

# To know which event type names are available check export and find field "type_name"=>"ethtool_event_p0"
# ...
# Corner cases:
# 1. Empty fset file will export all events.
# 2. Tokens written above/without [event_type] will be ignored.
# 3. If cannot open fset file, warning will be printed, all event types will be exported.
4.2.6. NetFlow Exporter
NetFlow exporter must be used when data is collected as NetFlow packets from the telemetry client applications. In this case, DOCA Telemetry NetFlow API sends NetFlow data packages to DTS via IPC. DTS uses NetFlow exporter to send data to the NetFlow collector (3rd party service).
To enable NetFlow exporter, set netflow-collector-ip and netflow-collector-port in dts_config.ini. netflow-collector-ip could be set either to IP or an address.
For additional information, refer to the dts_config.ini file.
DOCA Privileged Executer (DPE) is a daemon that allows specific DOCA services (DTS included) to access BlueField information that is otherwise inaccessible from a container due to technology limitations or permission granularity issues.
When enabled, DPE enriches the information collected by DTS. However, DTS can still be used if DPE is disabled (default).
5.1. DPE Usage
DPE is controlled by systemd, and can be used as follows:
- To check DPE status:
sudo systemctl status dpe
- To start DPE:
sudo systemctl start dpe
- To stop DPE:
sudo systemctl stop dpe
DPE logs can be found in /var/log/doca/telemetry/dpe.log.
5.2. DPE Configuration File
DPE can be configured by the user. This section covers the syntax and implications of its configuration file.
The DPU telemetry collected by DTS does not require for this configuration file to be used.
The DPE configuration file allows users to define the set of commands that DPE should support. This may be done by passing the -f option in the following line of /etc/systemd/system/dpe.service:
ExecStart=/opt/mellanox/doca/services/telemetry/dpe/bin/dpeserver -vvv
To use the configuration file:
ExecStart=/opt/mellanox/doca/services/telemetry/dpe/bin/dpeserver -vvv -f /path/to/dpe_config.ini
The configuration file supports the following sections:
- [server] - list of key=value lines for general server configuration. Allowed keys:
socket. - [commands] - list of bash command lines that are not using custom RegEx
- [commands_regex] - list of bash command lines that are using custom RegEx
- [regex_macros] - custom RegEx definitions used in the
commands_regexsection
Consider the following example configuration file:
            [server]
socket=/tmp/dpe.sock

[commands]
hostname
cat /etc/os-release

[commands_regex]
crictl inspect $HEXA       # resolved as "crictl inspect [a-f0-9]+"
lspci $BDF                 # resolved as "lspci ([0-9a-f]{4}\:|)[0-9a-f]{2}\:[0-9a-f]{2}\.[0-9a-f]"

[regex_macros]
HEXA=[a-f0-9]+
BDF=([0-9a-f]{4}\:|)[0-9a-f]{2}\:[0-9a-f]{2}\.[0-9a-f]
DPE is shipped with a preconfigured file that matches the commands used by the standalone DTS version included in the same DOCA installation. The file is located in /opt/mellanox/doca/services/telemetry/dpe/etc/dpe_config.ini.
Using a DPE configuration file allows for a fine-grained control over the interface exposed by it to the rest of the DOCA services. However, even when using the pre-supplied configuration file mentioned above, one should remember that it has been configured to match a fixed DTS version. That is, replacing the standalone DTS version with a new one downloaded from NGC means that the used configuration file might not cover additional features added in the new DTS version.
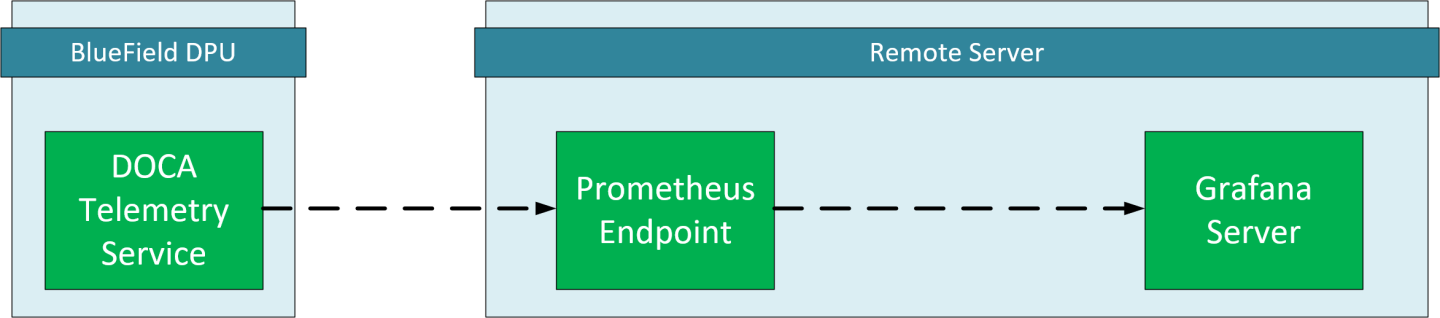
This chapter provides an overview and deployment configuration of DOCA Telemetry Service with Grafana.
6.1. Grafana Deployment Prerequisites
- BlueField DPU running DOCA Telemetry Service.
- Optional remote server to host Grafana and Prometheus.
- Prometheus installed on the host machine. Please refer to the Prometheus website for more information.
- Grafana installed on the host machine. Please refer to Grafana Labs website for more information.
6.2. Grafana Deployment Configuration
6.2.1. DTS Configuration (DPU Side)
DTS will be configured to export the sysfs counter using the Prometheus plugin.
Sysfs is used as an example, other counters are available. Please refer to the NVIDIA DOCA Telemetry Service Guide for more information.
- Make sure the sysfs counter is enabled.
            vim /opt/mellanox/doca/services/telemetry/config/dts_config.ini

enable-provider=sysfs
- Enable Prometheus exporter by setting the
prometheusaddress and port.vim /opt/mellanox/doca/services/telemetry/config/dts_config.ini prometheus=http://0.0.0.0:9100
6.2.2. Prometheus Configuration (Remote Server)
Please download Prometheus for your platform.
Prometheus is configured via command-line flags and a configuration file, prometheus.yml.
- Open the
prometheus.ymlfile and configure the DPU as the endpoint target.vim prometheus.yml # metrics_path defaults to '/metrics' # scheme defaults to 'http'. static_configs: - targets: ["<dpu-ip>:<prometheus-port>"]
-
<dpu-ip>is the DPU IP address. Prometheus reaches to this IP to pull data. -
<prometheus-port>the exporter port that set in DTS configuration.
-
- Run Prometheus server:
./prometheus --config.file="prometheus.yml"
Tip:Prometheus services are available as Docker images. Please refer to Using Docker in Prometheus' Installation guide.
6.2.3. Grafana Configuration (Remote Server)
Please download and install Grafana for your platform.
- Setup Grafana. Please refer to Install Grafana guide in Grafana documentation.
- Log into the Grafana dashboard at http://localhost:3000.
Add Prometheus as data source by navigating to Settings → Data sources → Add data source → Prometheus.

Configure the Prometheus data source. Under the HTTP section, set the Prometheus server address.
 Note:
Note:- Save and test.
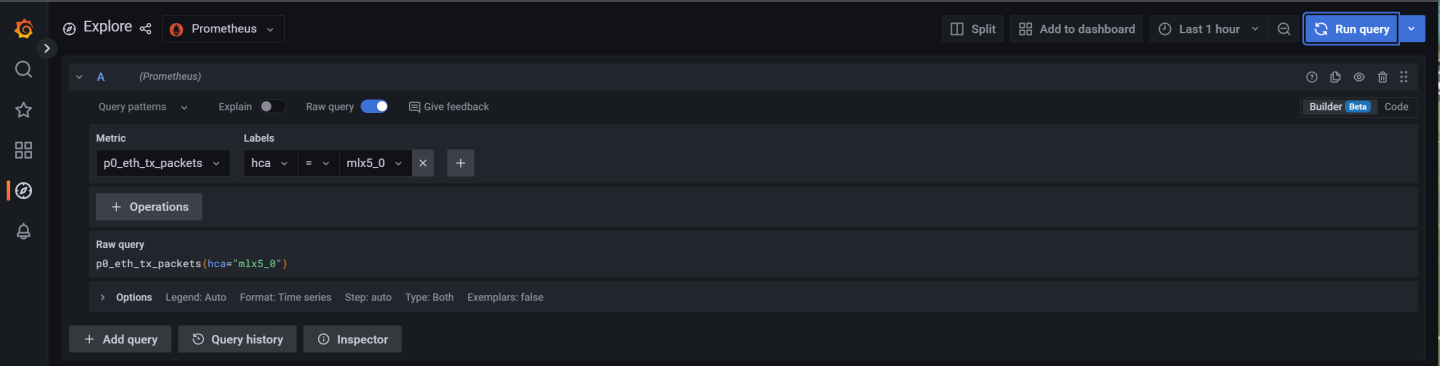
6.3. Exploring Telemetry Data
Go to the Explore page on the left-hand side, and choose a Prometheus provider.
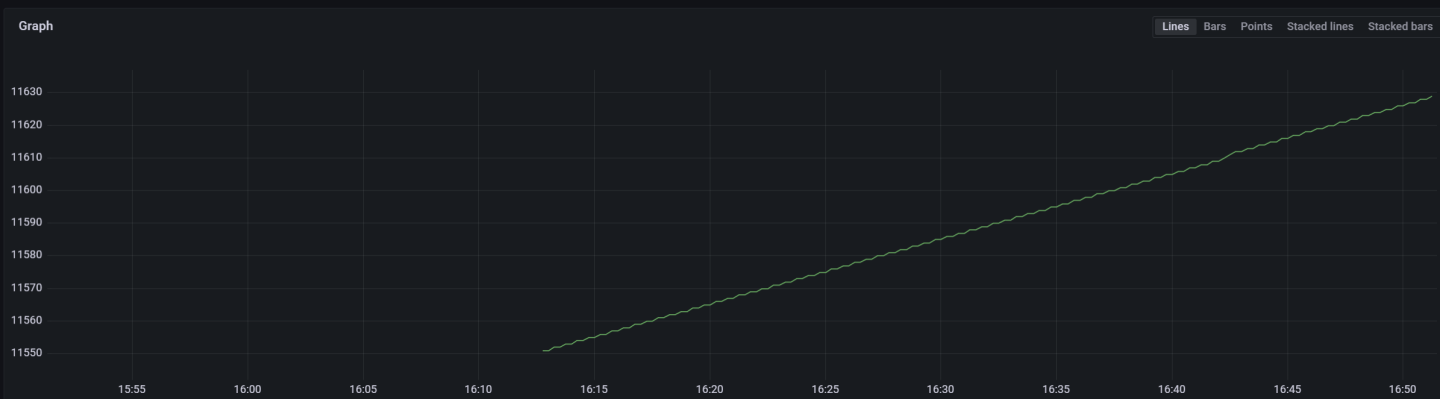
Choose a metric to display and specify a label. The label can be used to filter out data based on the source and HCA devices.
Graph display after selecting a metric and specifying a label to filter by:
On top of the troubleshooting section found in the NVIDIA DOCA Container Deployment Guide, here are additional troubleshooting tips for DTS:
- For general troubleshooting, refer to the NVIDIA DOCA Troubleshooting Guide
- If the pod's state fails to be marked as Ready, refer to the log
/var/log/syslog. - Check if the service is configured to write data to the disk, as this may cause the system to run out of disk space.
- If a PIC bus error occurs, configure the following files inside the container:
            crictl exec -it <Container ID> /bin/bash
# Add to /config/clx.env the following line:
"export UCX_TLS=tcp
"
Notice
This document is provided for information purposes only and shall not be regarded as a warranty of a certain functionality, condition, or quality of a product. NVIDIA Corporation nor any of its direct or indirect subsidiaries and affiliates (collectively: “NVIDIA”) make no representations or warranties, expressed or implied, as to the accuracy or completeness of the information contained in this document and assume no responsibility for any errors contained herein. NVIDIA shall have no liability for the consequences or use of such information or for any infringement of patents or other rights of third parties that may result from its use. This document is not a commitment to develop, release, or deliver any Material (defined below), code, or functionality.
NVIDIA reserves the right to make corrections, modifications, enhancements, improvements, and any other changes to this document, at any time without notice.
Customer should obtain the latest relevant information before placing orders and should verify that such information is current and complete.
NVIDIA products are sold subject to the NVIDIA standard terms and conditions of sale supplied at the time of order acknowledgement, unless otherwise agreed in an individual sales agreement signed by authorized representatives of NVIDIA and customer (“Terms of Sale”). NVIDIA hereby expressly objects to applying any customer general terms and conditions with regards to the purchase of the NVIDIA product referenced in this document. No contractual obligations are formed either directly or indirectly by this document.
NVIDIA products are not designed, authorized, or warranted to be suitable for use in medical, military, aircraft, space, or life support equipment, nor in applications where failure or malfunction of the NVIDIA product can reasonably be expected to result in personal injury, death, or property or environmental damage. NVIDIA accepts no liability for inclusion and/or use of NVIDIA products in such equipment or applications and therefore such inclusion and/or use is at customer’s own risk.
NVIDIA makes no representation or warranty that products based on this document will be suitable for any specified use. Testing of all parameters of each product is not necessarily performed by NVIDIA. It is customer’s sole responsibility to evaluate and determine the applicability of any information contained in this document, ensure the product is suitable and fit for the application planned by customer, and perform the necessary testing for the application in order to avoid a default of the application or the product. Weaknesses in customer’s product designs may affect the quality and reliability of the NVIDIA product and may result in additional or different conditions and/or requirements beyond those contained in this document. NVIDIA accepts no liability related to any default, damage, costs, or problem which may be based on or attributable to: (i) the use of the NVIDIA product in any manner that is contrary to this document or (ii) customer product designs.
No license, either expressed or implied, is granted under any NVIDIA patent right, copyright, or other NVIDIA intellectual property right under this document. Information published by NVIDIA regarding third-party products or services does not constitute a license from NVIDIA to use such products or services or a warranty or endorsement thereof. Use of such information may require a license from a third party under the patents or other intellectual property rights of the third party, or a license from NVIDIA under the patents or other intellectual property rights of NVIDIA.
Reproduction of information in this document is permissible only if approved in advance by NVIDIA in writing, reproduced without alteration and in full compliance with all applicable export laws and regulations, and accompanied by all associated conditions, limitations, and notices.
THIS DOCUMENT AND ALL NVIDIA DESIGN SPECIFICATIONS, REFERENCE BOARDS, FILES, DRAWINGS, DIAGNOSTICS, LISTS, AND OTHER DOCUMENTS (TOGETHER AND SEPARATELY, “MATERIALS”) ARE BEING PROVIDED “AS IS.” NVIDIA MAKES NO WARRANTIES, EXPRESSED, IMPLIED, STATUTORY, OR OTHERWISE WITH RESPECT TO THE MATERIALS, AND EXPRESSLY DISCLAIMS ALL IMPLIED WARRANTIES OF NONINFRINGEMENT, MERCHANTABILITY, AND FITNESS FOR A PARTICULAR PURPOSE. TO THE EXTENT NOT PROHIBITED BY LAW, IN NO EVENT WILL NVIDIA BE LIABLE FOR ANY DAMAGES, INCLUDING WITHOUT LIMITATION ANY DIRECT, INDIRECT, SPECIAL, INCIDENTAL, PUNITIVE, OR CONSEQUENTIAL DAMAGES, HOWEVER CAUSED AND REGARDLESS OF THE THEORY OF LIABILITY, ARISING OUT OF ANY USE OF THIS DOCUMENT, EVEN IF NVIDIA HAS BEEN ADVISED OF THE POSSIBILITY OF SUCH DAMAGES. Notwithstanding any damages that customer might incur for any reason whatsoever, NVIDIA’s aggregate and cumulative liability towards customer for the products described herein shall be limited in accordance with the Terms of Sale for the product.
Trademarks
NVIDIA, the NVIDIA logo, and Mellanox are trademarks and/or registered trademarks of Mellanox Technologies Ltd. and/or NVIDIA Corporation in the U.S. and in other countries. The registered trademark Linux® is used pursuant to a sublicense from the Linux Foundation, the exclusive licensee of Linus Torvalds, owner of the mark on a world¬wide basis. Other company and product names may be trademarks of the respective companies with which they are associated.
Copyright
© 2023 NVIDIA Corporation & affiliates. All rights reserved.