

Planner 设计
Planner 设计
面向贡献者和架构设计者的 Tier 3 设计文档。面向用户的文档请参阅 Planner 指南。
概览
Planner 是 Dynamo 的自动扩缩容控制器。它支持两种扩缩容模式:基于吞吐量 的模式使用 profiling 数据和流量预测,基于负载 的模式使用实时引擎指标和在线回归。本文介绍这两种模式的内部架构、算法和设计取舍。
运行时 Pipeline
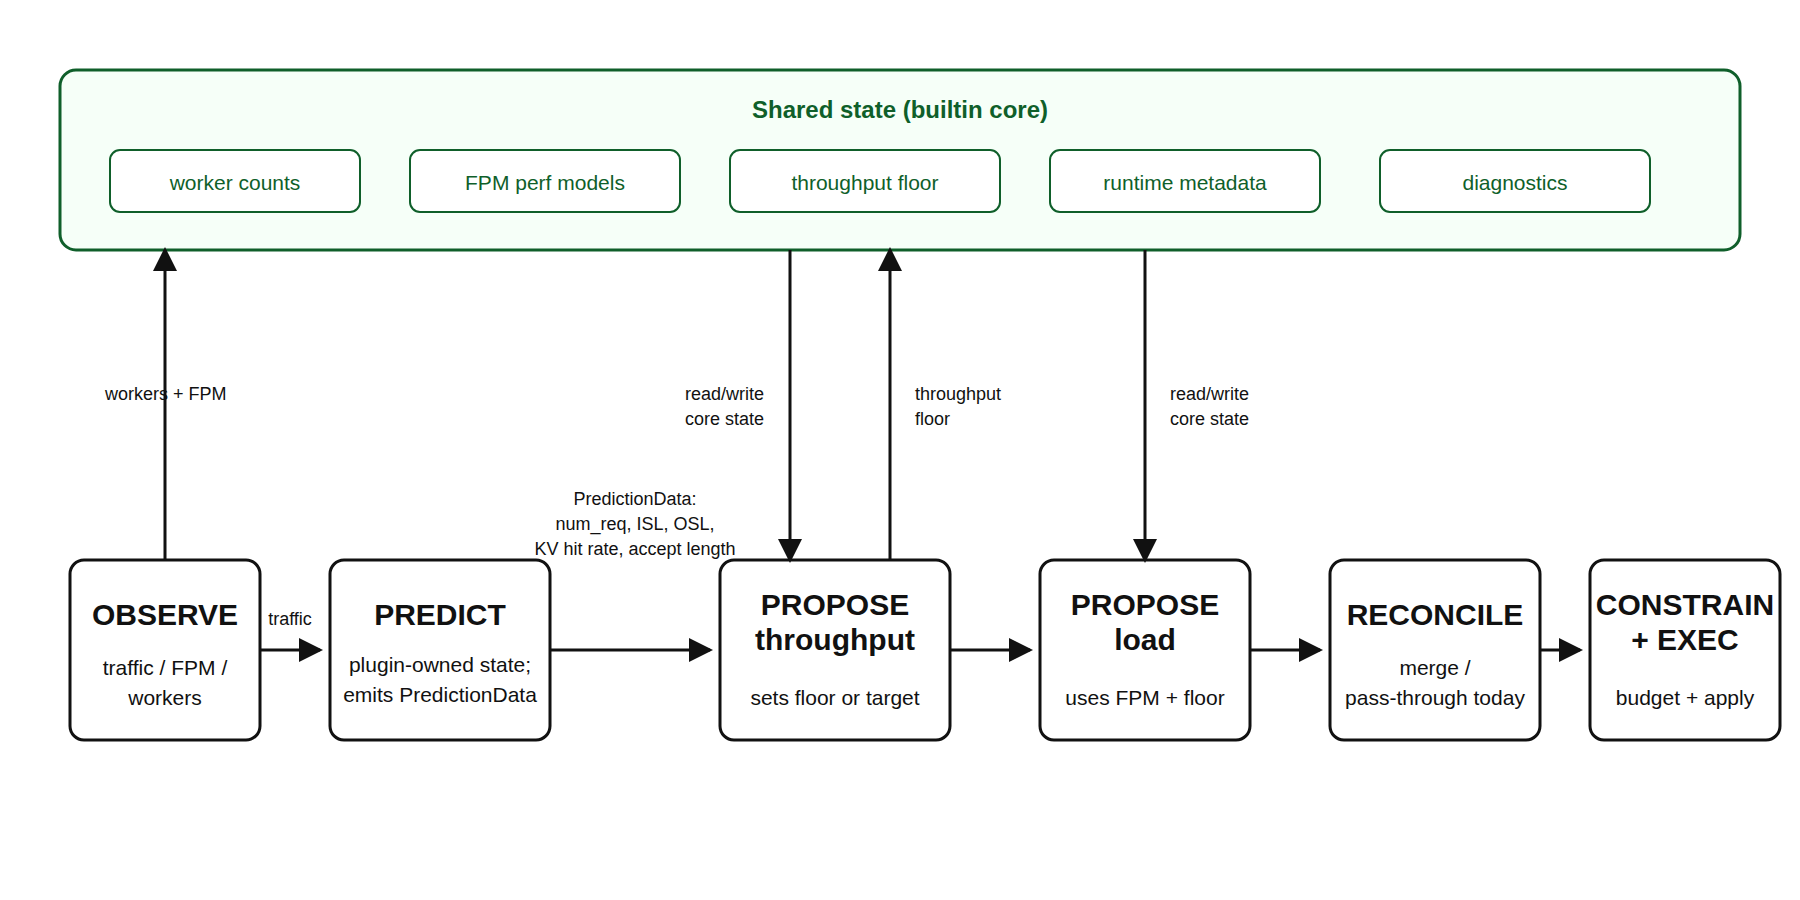
运行时 planner 由 OrchestratorEngineAdapter 驱动。它把本地扩缩容算法包装成 builtin plugins,并运行与外部 gRPC plugins 相同的 plugin pipeline。
- OBSERVE:
NativePlannerBase和 engine adapter 收集 worker 数量、流量指标和 forward-pass metrics。观测数据通过PipelineContext.observations暴露。 - PREDICT:
builtin_load_predict按 throughput interval 运行。它消费流量观测,并为当前 tick 输出预测的请求数、ISL、OSL、KV hit rate 和 speculative accept length。 - PROPOSE:
builtin_throughput_propose消费同一个 tick 的预测结果,并更新 throughput lower bound。builtin_load_propose消费 FPM 和 worker 观测,并执行基于负载的 +/-1 扩缩容算法。 - RECONCILE / CONSTRAIN:通用 pipeline 合并 builtin 和外部 plugins 的 proposal。CONSTRAIN 之后,engine adapter 会在返回 scaling effect 前应用本地 planner 的最终
min_endpoint和 GPU budget 不变量。 - EXECUTE:adapter 返回
PlannerEffects.scale_to;NativePlannerBase通过配置的 connector 应用这些目标。
为了兼容现有配置和 DGDR 生成的 planner payload,load_adjustment_interval_seconds 和 throughput_adjustment_interval_seconds 仍然定义 builtin plugin 的 fire interval。基础 scheduling.scale_interval_seconds 默认是已启用 interval 的最大公约数,因此现有 load 和 throughput 的 fire time 会保持不变。
为什么需要两个 Scaling Loop
两个 builtin scaling loop 对应不同的控制周期。基于吞吐量的扩缩容是较慢的预测式 capacity loop:它使用更长的流量窗口、负载预测,以及 profiling 或 perf-model 的容量估算,为持续需求提前准备容量。这样可以避免对短期指标噪声做反应,也给 scale-out 留出足够时间,让容量在预测负载到来前完成就绪。
基于负载的扩缩容是更快的反应式 SLA-correction loop。它使用当前 FPM、queue、worker count 和在线 perf-model 观测,处理短期 overload、预测或 profiling 误差、KV hit rate 或 speculative accept length 等 runtime metadata 变化,以及前一次扩缩容之后实际观察到的状态。
当两个 loop 同时启用时,基于吞吐量的扩缩容设置 replica lower bound,基于负载的扩缩容在这个 floor 之上以更高频率调整。这样既不会因为短暂 idle period 移除为近未来需求预测出的容量,也能在实时 SLA 压力出现时,比 throughput interval 更快响应。
Builtin 共享状态
Pipeline context 是每个 tick 的数据平面:observations、predictions 和 proposals 都是为当前 tick 产生,并通过 public plugin API 在 stage 之间传递。Builtin local planner 还需要跨 tick 状态来保持现有 planner 行为。这些状态保存在 PlannerScalingState 中;它是 builtin plugins 和 engine adapter 的私有状态,不是 public gRPC plugin contract。
PlannerScalingState 保存:
- Worker inventory:当前 ready 的 prefill/decode 数量、expected 数量,以及 prefill 或 decode 扩缩容操作是否仍在进行中。
- Perf models:prefill、decode 或 aggregated
PlannerEnginePerfModel实例,包括部署前 benchmark FPM 和在线 FPM 更新。 - Throughput lower bounds:由基于吞吐量的扩缩容产生的当前 prefill/decode floor。基于负载的扩缩容可以扩到这个 floor 之上,但不能缩到这个 floor 之下。
- Runtime metadata:最近观测到的 KV hit rate 和 speculative accept length。这些值使用 last-value 语义,并作为 capacity estimation 的输入特征。
- 每个 tick 的 diagnostics scratch:估算的 TTFT/ITL、预测的流量形状、engine RPS、decision reasons、lower bounds,以及 metrics 和 HTML reports 使用的 execution/audit metadata。
- Worker capabilities 和 budget 输入:组件 GPU 数量和运行时能力,用于把最终目标 clamp 到
min_endpoint和 GPU budgets。
Predictor history 不保存在 PlannerScalingState 中。builtin_load_predict 自己维护 request count、ISL 和 OSL predictor state,并通过 PredictionData 把同一个 tick 的输出显式传给后续 stage。这样 PREDICT -> PROPOSE 的依赖是显式的,同时 builtin proposer plugins 仍然可以共享天然跨 tick 的状态,例如 perf-model fitting 和 throughput floors。
基于吞吐量的扩缩容
基于吞吐量的扩缩容由两个 builtin plugins 实现:builtin_load_predict 和 builtin_throughput_propose。
Step 1: 流量观测
在 throughput cadence 的 tick 上,engine adapter 会根据 throughput_metrics_source 从 frontend 或 router 查询 Prometheus 流量指标:
- request count
- average input sequence length (ISL)
- average output sequence length (OSL)
- KV hit rate
- speculative decode accept length
观测窗口是 throughput_adjustment_interval_seconds,而外层 pipeline cadence 仍然是 scheduling.scale_interval_seconds。
Step 2: 负载预测
Planner 会预测下一个 interval 的三个流量形状值:
next_num_req:请求数量next_isl:平均 input sequence lengthnext_osl:平均 output sequence length
可用的 predictor 实现有四种:
所有 predictors 都支持从 trace 文件 warm-starting(--load-predictor-warmup-trace)。
描述 engine/router 行为的 runtime metadata 不通过这些 predictors 预测。KV hit rate 和 speculative decode accept length 使用 last-value 语义:planner 保存最新的有效 Prometheus 观测,并在新的有效值到来前复用它。冷启动时,KV hit rate 缺失表示不做 discount,accept length 缺失表示 1.0。
Step 3: 容量估算
builtin_throughput_propose 消费同一个 tick 的预测结果,并根据配置的 SLA 目标查询 planner perf model 的 prefill/decode capacity。Perf model 会从第一个可用来源启动:
- worker
get_perf_metricsself-benchmark data - 配置了
aic_interpolation时的 AI Configurator interpolation profile_results_dir中的 NPZ/JSON fallback data- 没有 pre-deployment data 时的 live FPM regression warmup
Rust perf shim 可以使用原生 AIC 估算和在线 FPM tuning。KV hit rate 和 speculative accept length 等 runtime metadata 会作为输入特征使用,而不是作为持久 correction-factor flags。
Step 4: Proposal 和 Lower Bound
Throughput proposer 会把预测负载和每个 engine 的 capacity 转换成 replica targets。当同时启用 throughput 和 load scaling 时,基于吞吐量的扩缩容写入 lower bound;更快的 load-based proposer 可以扩到这个 bound 之上,但不能缩到这个 bound 之下。
Step 5: 执行扩缩容
合并后的 pipeline result 会变成 PlannerEffects.scale_to。运行时 base 随后调用配置的 connector 来应用组件 replica targets。
Connector 设计
Interface
KubernetesConnector
直接 PATCH DGD resource 来更新 replica counts。operator 会监听 DGD 变更,并 reconcile component deployments。
设计决策:
- 使用
DYN_PARENT_DGD_K8S_NAME找到父 DGD(由 operator 注入) - 通过
subComponentType字段解析 service(prefill/decode),并 fallback 到 legacy component names - 启动时验证 deployment 结构:检查 prefill 和 decode services 是否存在,以及 model names 是否匹配
VirtualConnector
用于非原生环境(例如自定义 orchestrators)。它通过 VirtualConnectorCoordinator(Rust binding)把扩缩容决策写入 distributed runtime。外部系统使用 VirtualConnectorClient poll 决策并上报完成。
扩缩容决策流程:
- Planner 向 runtime 写入
(num_prefill, num_decode, decision_id) - 外部系统通过
client.wait()读取决策 - 外部系统执行扩缩容
- 外部系统通过
client.complete(decision)上报完成 - Planner 看到
scaled_decision_id >= decision_id后继续
Timeout:如果扩缩容在 1800s 内没有 ack(可配置),planner 仍会继续处理新的决策。
Performance Interpolation
Planner 使用部署前 profiling 数据(NPZ 文件)把 (throughput, ISL/OSL, context_length) 映射到 (TTFT, ITL)。这些数据来自 SLA-driven profiling 流程,可以是真实 GPU profiling,也可以是 AI Configurator 估算。
维护了两个 interpolators:
- Prefill interpolator:映射
(throughput_per_gpu, ISL) -> TTFT - Decode interpolator:映射
(throughput_per_gpu, context_length) -> ITL
Interpolators 使用 profiling sweep granularity 来决定精度。granularity 越细,profiling samples 越多,interpolation 也越准确。
初始化
python -m dynamo.planner entrypoint 加载 PlannerConfig,构造 mode-specific planner wrapper,然后初始化所选 connector。运行时 base 会验证 worker topology、发现 worker capabilities、把可用的 pre-deployment FPM 安装到 perf model、启动 builtin 和已配置 plugins,并进入 tick loop。
Performance Considerations
- Adjustment interval sizing:plugin execution interval 必须足够长,让扩缩容操作完成。如果
load_adjustment_interval_seconds或throughput_adjustment_interval_seconds短于添加/移除 worker 的时间(包括 pod scheduling、model loading 和 registration),后续扩缩容决策可能观察到一个仍在进行中的 replica transition,并 hold 到它完成。 - Perf-model bootstrap quality:基于吞吐量的扩缩容可以从 worker self-benchmark data、AI Configurator interpolation、
profile_results_dir文件或 live FPM regression 启动。缺少 bootstrap data 是允许的,但早期决策可能会 hold,直到足够的 live FPM observations 到达。 - Interpolation accuracy vs profiling cost:profiler sweep 中更高的
prefillInterpolationGranularity和decodeInterpolationGranularity会产生更准确的 bootstrap data,但 profiling 时间也会线性增加。默认 granularity(16 prefill,6 decode)在准确性和 profiling duration 之间做平衡。 - Predictor warm-up period:所有 predictors 都需要 observation history 才能产生可靠预测。ARIMA 和 Prophet 需要多个 adjustment intervals 的数据。Kalman 在
--kalman-min-points个观测之后开始预测。Warm-up 期间,planner 使用 constant predictor 作为 fallback。
基于负载的扩缩容
基于负载的模式使用 Dynamo event plane 中的 ForwardPassMetrics (FPM),在不需要 profiling data 或 KV Router 的情况下做 SLA-aware 扩缩容决策。
Metrics
每个 engine 会通过 ZMQ -> FpmEventRelay -> event plane 发出每次 iteration 的 ForwardPassMetrics。Planner 通过 FpmEventSubscriber 订阅,并支持自动 engine discovery 和基于 MDC 的 lifecycle tracking。关键字段包括:
- wall_time:每次 iteration 的执行时间(regression target)
- scheduled_requests.sum_prefill_tokens:prefill regression input
- scheduled_requests.sum_decode_kv_tokens:decode regression input
- queued_requests:用于 TTFT/ITL simulation 的 queued prefill/decode load
- Idle heartbeats(wall_time=0)会被跳过
Diagnostics
每个 tick 中,scaling state machine 会通过内部 _diag_* 字段填充 TickDiagnostics,包含中间决策数据,例如 estimated latencies、predicted load、per-engine RPS 和 decision reasons。Adapter layer 读取 PlannerEffects.diagnostics 并:
- 设置 Prometheus gauges,例如
dynamo_planner_estimated_ttft_ms和相关估算指标 - 记录 load-scaling decision reasons 的 enum metrics(
dynamo_planner_load_scaling_decision) - 送入
DiagnosticsRecorder,它会累计 per-tick snapshots,并按计划输出基于 Plotly 的 HTML reports
来自 _collect_fpm() 的 per-engine FPM queue depths 会以带 label 的 Prometheus gauges 导出。
Regression Models
三个专用 regression models 位于 components/src/dynamo/planner/core/perf_model/:
- PrefillRegressionModel:1D regression
sum_prefill_tokens -> wall_time。通过模拟 chunked prefill scheduling(chunk 大小为max_num_batched_tokens)估算 TTFT。 - DecodeRegressionModel:1D regression
sum_decode_kv_tokens -> wall_time。估算 total decode load(scheduled + queued + avg decode length)的 ITL。 - AggRegressionModel:2D regression
(sum_prefill_tokens, sum_decode_kv_tokens) -> wall_time。估算 TTFT(带 piggybacked decode 的 simulated prefill)和 ITL(带 average piggybacked prefill 的 decode)。
Scaling Decisions
- Prefill/Decode:如果所有 engines 的 estimated TTFT/ITL 都大于 SLA,则 scale up;如果所有都小于
SLA * sensitivity,则 scale down。 - Agg:如果所有 TTFT 大于 SLA 或所有 ITL 大于 SLA,则 scale up;只有当所有 TTFT 都小于
SLA * sensitivity且所有 ITL 都小于SLA * sensitivity时才 scale down。 - 每个 interval 只调整 +/-1(non-blocking,并带 pending-desired guard:扩缩容进行中仍会持续观测 metrics,但不会在前一个操作完成前发出新的 scaling action)。
与基于吞吐量的扩缩容共存
当两种模式都启用时,基于吞吐量的扩缩容(更长 interval)会设置 replicas 的 lower bound,而基于负载的扩缩容(更短 interval)负责在这个 floor 之上的实时调整。
Aggregated Mode
在 aggregated mode(--mode agg)下,engines 同时处理 prefill 和 decode,并使用 chunked prefill。Planner 维护 TTFT 和 ITL 两个 regression models,但使用按 worker 时间平均的 metrics(不是瞬时值)进行 regression training,以平滑 chunked prefill noise。如果 prefill 或 decode 任一信号 overload,则 scale up;只有两者都 underload 时才 scale down。
Known Limitations
- Adjustment interval vs scaling latency:如果 plugin interval 短于扩缩容耗时,后续 tick 可能观察到正在进行中的 transition,并 hold,而不是叠加新的 replica change。
- Average-based prediction:基于吞吐量的扩缩容使用平均 ISL/OSL,这可能无法很好表示 bimodal 或 heavy-tailed distributions。
- Single DGD scope:每个 planner instance 只管理一个 DGD。不支持 multi-model/multi-DGD coordination。
Future Work
- 面向 shared-cluster 场景的 multi-DGD coordination
- Distribution-aware interpolation(超越 mean ISL/OSL)
- 基于 observed scaling latency 的 adaptive adjustment interval