

Logging
Set OTEL_EXPORT_ENABLED=true on every Dynamo process. Without it, logs never leave the process and Loki will be silent regardless of OTEL_EXPORTER_OTLP_LOGS_ENDPOINT.
Overview
Dynamo provides structured logging in both text as well as JSONL. When
JSONL is enabled, logs support trace_id and span_id fields for
distributed tracing. Span creation and exit events can be optionally
enabled via the DYN_LOGGING_SPAN_EVENTS environment variable.
Environment Variables
OTLP Log Export
When OTEL_EXPORT_ENABLED=true, Dynamo exports both traces and logs via OTLP. Logs are sent to an OpenTelemetry Collector which routes them to Grafana Loki for aggregation and querying.
Set OTEL_EXPORTER_OTLP_ENDPOINT to configure the default OTLP collector endpoint for both traces and logs. To send logs somewhere else, set OTEL_EXPORTER_OTLP_LOGS_ENDPOINT; to send traces somewhere else, set OTEL_EXPORTER_OTLP_TRACES_ENDPOINT.
Signal-specific endpoints are used as-is. When using the generic OTEL_EXPORTER_OTLP_ENDPOINT with http/protobuf, Dynamo appends the signal path (/v1/logs or /v1/traces). With grpc, the endpoint is used without a path.
Changed in v1.3.0: OTEL_EXPORTER_OTLP_LOGS_ENDPOINT no longer falls back to OTEL_EXPORTER_OTLP_TRACES_ENDPOINT. It now falls back to the generic OTEL_EXPORTER_OTLP_ENDPOINT, then the protocol default. A deployment that sets only the traces endpoint sends logs to the protocol default (http://localhost:4317 for grpc, http://localhost:4318/v1/logs for http/protobuf), where they are silently dropped if no collector is listening. Also set OTEL_EXPORTER_OTLP_LOGS_ENDPOINT, or use the generic OTEL_EXPORTER_OTLP_ENDPOINT for both signals.
The local observability stack (see Getting Started) includes an OpenTelemetry Collector that receives OTLP on localhost:4317 and routes traces to Tempo and logs to Loki. In Grafana, the Loki datasource is pre-configured with a derived field that links trace_id labels to Tempo, so you can jump directly from a log line to its corresponding trace.
Getting Started Quickly
Start Observability Stack
For collecting and visualizing logs with Grafana Loki, or viewing trace context in logs alongside Grafana Tempo, start the observability stack. See Observability Getting Started for instructions. The stack includes Loki, an OpenTelemetry Collector, and Tempo — all pre-wired together.
Enable Structured Logging
Enable structured JSONL logging:
Logs will be written to stderr in JSONL format with trace context.
Available Logging Levels
Example Readable Format
Environment Setting:
Resulting Log format:
Example JSONL Format
Environment Setting:
Resulting Log format:
Logging of Trace and Span IDs
When DYN_LOGGING_JSONL is enabled, all logs include trace_id and span_id fields, and spans are automatically created for requests. This is useful for short debugging sessions where you want to examine trace context in logs without setting up a full tracing backend and for correlating log messages with traces.
The trace and span information uses the OpenTelemetry format and libraries, which means the IDs are compatible with OpenTelemetry-based tracing backends like Tempo or Jaeger if you later choose to enable trace export.
Note: This section has overlap with Distributed Tracing with Tempo. For trace visualization in Grafana Tempo and persistent trace analysis, see Distributed Tracing with Tempo.
Configuration for Logging
To see trace information in logs:
This enables JSONL logging with trace_id and span_id fields. Traces appear in logs but are not exported to any backend.
Example Request
Send a request to generate logs with trace context:
Check the logs (stderr) for JSONL output containing trace_id, span_id, and x_request_id fields.
Trace and Span Information in Logs
This section shows how trace and span information appears in JSONL logs. These logs can be used to understand request flows even without a trace visualization backend.
Example Disaggregated Trace in Grafana
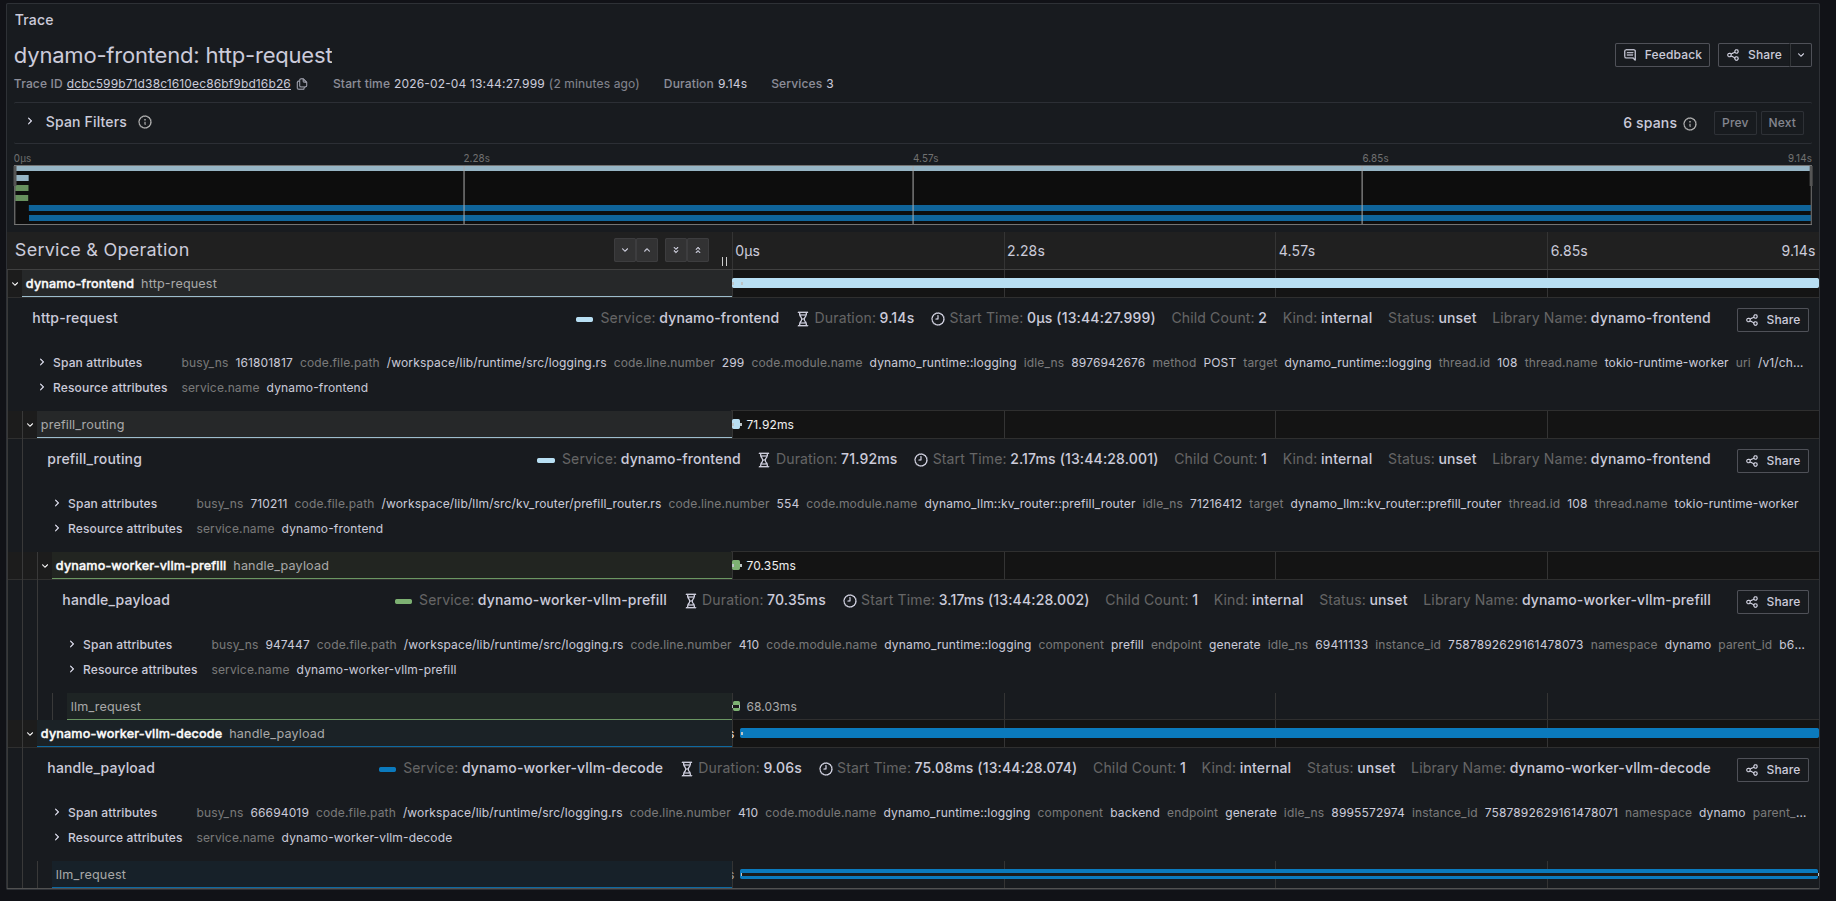
When viewing the corresponding trace in Grafana, you should be able to see something like the following:
Trace Overview
Dynamo creates distributed traces that span across multiple services in a disaggregated serving setup. The following sections describe the key spans you’ll see in Grafana when viewing traces for chat completion requests.
Available Spans in Disaggregated Mode
When running Dynamo in disaggregated mode, a typical request creates the following spans:
1. http-request (Frontend - Root Span)
The root span for the entire request lifecycle, created in the dynamo-frontend service.
Key Attributes:
- Service:
dynamo-frontend - Operation: Handles the HTTP request from client to completion
- Duration: Total end-to-end request time (includes prefill + decode)
- Method: HTTP method (typically
POST) - URI: Request endpoint (e.g.,
/v1/chat/completions) - Status: Request completion status
- Children: Typically 2-3 child spans (routing span + worker spans)
This span represents the complete request flow from when the frontend receives the HTTP request until the final response is sent back to the client.
2. prefill_routing (Frontend - Routing Span)
A child span of http-request, created in the dynamo-frontend service during the routing phase.
Key Attributes:
- Service:
dynamo-frontend - Operation: Routes the prefill request to an appropriate prefill worker
- Duration: Time spent selecting and the span of prefill.
- Parent:
http-requestspan
This span captures the routing logic and decision-making process and the request sent to the prefill worker.
3. handle_payload (Prefill Worker Span)
A child span of http-request, created in the dynamo-worker-vllm-prefill service.
Key Attributes:
- Service:
dynamo-worker-vllm-prefill(ordynamo-worker-sglang-prefillfor SGLang) - Operation: Processes the prefill phase of generation
- Duration: Time to compute prefill (typically milliseconds to seconds)
- Component:
prefill - Endpoint:
generate - Parent:
http-requestspan
This span represents the actual prefill computation on a prefill-specialized worker, including prompt processing and initial KV cache generation.
4. handle_payload (Decode Worker Span)
A child span of http-request, created in the dynamo-worker-vllm-decode service.
Key Attributes:
- Service:
dynamo-worker-vllm-decode(ordynamo-worker-sglang-decodefor SGLang) - Operation: Processes the decode phase of generation
- Duration: Time to generate all output tokens (typically seconds)
- Component:
decodeorbackend - Endpoint:
generate - Parent:
http-requestspan
This span represents the iterative token generation phase on a decode-specialized worker, which consumes the KV cache from prefill and produces output tokens.
Understanding Span Metrics
Each span provides several useful metrics:
The relationship Duration = Busy Time + Idle Time helps identify where time is spent and potential bottlenecks.
Custom Request IDs in Logs
You can provide a custom request ID using the x-request-id header. This ID will be attached to all spans and logs for that request, making it easier to correlate traces with application-level request tracking.
Example Request with Custom Request ID
All spans and logs for this request will include the x_request_id attribute with value 8372eac7-5f43-4d76-beca-0a94cfb311d0.
Frontend Logs with Custom Request ID
Notice how the x_request_id field appears in all log entries, alongside the trace_id (80196f3e3a6fdf06d23bb9ada3788518) and span_id:
Backend Engine Log Levels
Dynamo’s DYN_LOG environment variable controls Dynamo’s own logging. Each
inference backend has its own log level control that is independent of
DYN_LOG.
vLLM
vLLM log level is controlled by the VLLM_LOGGING_LEVEL environment variable.
It defaults to INFO and is completely independent of DYN_LOG.
Valid values: DEBUG, INFO, WARNING, ERROR, CRITICAL.
TensorRT-LLM
TensorRT-LLM log level is controlled by the TLLM_LOG_LEVEL environment
variable. It defaults to INFO and is completely independent of DYN_LOG.
Valid values: TRACE, DEBUG, INFO, WARNING, ERROR, INTERNAL_ERROR.
Note: TLLM_LOG_LEVEL is read once at TensorRT-LLM import time. It must
be set before the process starts.
SGLang
SGLang logging is currently configured through Dynamo and follows the
DYN_LOG level by default. To disable Dynamo’s SGLang log configuration
and manage it independently, set:
Alternatively, pass the --log-level argument to the SGLang worker
command to set the SGLang engine’s log level directly (e.g.
--log-level DEBUG). This is independent of DYN_LOG.
Request Payload Logging (OTLP)
Dynamo emits per-request /v1/chat/completions payloads through request trace.
The request_payload row carries the client request and, when one completes,
the response. The same DYN_REQUEST_TRACE_SINKS setting selects local
files, stderr, NATS, and OTLP log export.
Request payload logging is opt-in and independent of OTEL_EXPORT_ENABLED
(which controls application log and trace export). By default, Dynamo does not
emit request or response payload rows, even when the OpenAI request sets
store=true. Set DYN_REQUEST_TRACE_RECORDS=request_payload to emit payload
rows for every captured chat-completions request, or include request_payload alongside
other selected record types.
Audit payload logging has migrated to request trace. This is a breaking
migration for legacy audit consumers: the store=true audit trigger and old
audit wire schema are not preserved. Payload rows use
dynamo.request.trace.v1 with event_type=request_payload.
The OTLP payload path is enabled by DYN_REQUEST_TRACE_SINKS=otel, or
by combining sinks such as DYN_REQUEST_TRACE_SINKS=file,otel.
Setting DYN_REQUEST_TRACE_SINKS=stderr together with
OTEL_EXPORTER_OTLP_LOGS_ENDPOINT writes request trace JSON directly to
stderr only; it does not export payload records over OTLP.
How records are emitted
- One
dynamo.request.trace.v1record withevent_type=request_payloadis published per chat-completions request. - When requests are cancelled or fail, the record is
still emitted with
payload.responseomitted, so those cases remain inspectable. A hard process crash before emission can lose a record. - When
DYN_REQUEST_TRACE_HTTP_HEADER_CAPTURE_LISTis set, allowlisted headers are included only inevent_type=request_payloadrecords aspayload.http_request_headers(case-insensitive; omitted when no listed header is present); other record types do not include HTTP headers. Listed headers with empty or non-UTF-8 values are also omitted. These payload records are emitted to every configured sink. Captured values are unredacted, so avoid allowlisting credential-bearing headers. - Each
otelsink record maps to one OTLPLogRecord: scopedynamo.request_trace, bodyrequest_payload, with attributesschema,event_type,rid,endpoint,model,streaming,payload_complete, andpayload(the request trace row serialized as a JSON string).
Configuration
Payload-related request trace variables:
Deprecated. DYN_AUDIT_SINKS, DYN_AUDIT_FORCE_LOGGING,
DYN_AUDIT_NATS_SUBJECT, and DYN_AUDIT_OTEL_MAX_PAYLOAD_BYTES are
migration shims, not legacy audit compatibility aliases.
A truthy DYN_AUDIT_FORCE_LOGGING maps to
DYN_REQUEST_TRACE_RECORDS=request_payload; DYN_AUDIT_SINKS only selects
destinations and does not enable request_end replay metadata. Prefer the
DYN_REQUEST_TRACE_* variables for new deployments.
The otel sink ships over OTLP using the standard
OTEL_EXPORTER_OTLP_* variables, resolved the same way as the runtime log and
trace exporter:
- Protocol:
OTEL_EXPORTER_OTLP_LOGS_PROTOCOL→OTEL_EXPORTER_OTLP_PROTOCOL→grpc. - Endpoint:
OTEL_EXPORTER_OTLP_LOGS_ENDPOINT(used as-is) →OTEL_EXPORTER_OTLP_ENDPOINT(/v1/logsappended only forhttp/protobuf) → default (http://localhost:4317forgrpc,http://localhost:4318/v1/logsforhttp/protobuf). OTEL_SERVICE_NAMEsets the service name on exported records (defaultdynamo).
Keep the endpoint consistent with the protocol: a grpc endpoint is used
verbatim, while http/protobuf expects an HTTP URL and gets /v1/logs
appended. Because the request trace OTLP sink and the runtime exporter
share these variables and the same grpc default, request payload records and
application telemetry resolve to the same destination unless you override the
logs signal explicitly.
Example
Export chat-completion payload rows over OTLP gRPC to a collector, logging every request:
To also write request trace JSON to stderr:
For local files, set DYN_REQUEST_TRACE_SINKS=file and configure
DYN_REQUEST_TRACE_FILE_PATH and DYN_REQUEST_TRACE_FILE_FORMAT. See
Request Replay Tracing for the full request trace
configuration and record schema.