For AI agents: a documentation index is available at the root level at /llms.txt and /llms-full.txt. Append /llms.txt to any URL for a page-level index, or .md for the markdown version of any page.
  • Welcome
    • Overview
    • Release Notes
  • Installation and Configuration
    • System Requirements
    • Installation
    • Services and Utilities
    • Executor Resource Manager
    • Configuration Parameters
    • Security
    • Distributed Configuration
  • Loading and Exporting Data
    • Supported Data Sources
    • Command Line
  • SQL
    • Data Definition (DDL)
    • Data Manipulation (DML)
  • HeavyImmerse
    • Introduction to HeavyImmerse
    • Admin Portal
    • Control Panel
    • Working with Dashboards
    • Measures and Dimensions
    • Using Parameters
    • Using Filters
    • Using Cross-link
    • Color Consistency
    • Chart Animation
    • Multilayer Charts
    • SQL Editor
    • Customization
    • Joins (Beta)
    • Chart Types
    • Deprecated Charts
    • HeavyIQ SQL Notebook
  • HeavyIQ Conversational Analytics
    • HeavyIQ Overview
    • HeavyIQ Model Overview (HeavyLM)
  • HeavyRF
    • Introduction to HeavyRF
    • Getting Started
    • HeavyRF Table Functions
  • HeavyConnect
    • HeavyConnect Release Overview
    • Getting Started
    • Best Practices
    • Examples
    • Command Reference
    • Parquet Data Wrapper Reference
    • ODBC Data Wrapper Reference
    • Raster Data Wrapper Reference
  • HeavyML (BETA)
    • HeavyML Overview
    • Clustering Algorithms
    • Regression Algorithms
    • Principal Components Analysis
  • Python / Data Science
    • Data Science Foundation
    • JupyterLab Installation and Configuration
    • Using HEAVY.AI with JupyterLab
    • Python User-Defined Functions (UDFs) with RBC
    • Ibis
    • Interactive Data Exploration with Altair
    • Additional Examples
  • APIs and Interfaces
    • heavysql
    • Thrift
    • JDBC
    • ODBC
    • Vega
    • RJDBC
    • SQuirreL SQL
    • heavyai-connector
  • Tutorials and Demos
    • Loading Data
    • Using Heavy Immerse
    • Hello World
    • Creating a Kafka Streaming Application
    • Getting Started with Open Source
    • Try Vega
  • Troubleshooting and Special Topics
    • Vulkan Renderer
    • Optimizing
    • Known Issues and Limitations
    • Logs and Monitoring
    • Archived Release Notes
NVIDIANVIDIA
Developer-friendly docs for your API
Privacy Policy | Your Privacy Choices | Terms of Service | Accessibility | Corporate Policies | Product Security | Contact

Copyright © 2026, NVIDIA Corporation.

LogoLogoDocumentation
On this page
  • Example: Opacity with Multilayer Charts
  • Example: Zoom Level with Multilayer Charts
HeavyImmerse

Multilayer Charts

||View as Markdown|
Previous

Chart Animation

Next

SQL Editor

You can superimpose multiple Pointmap, Linemap, Choropleth, and Geo Heatmap charts on one another to look for correlations between datasets.

To create a multilayer chart:

  1. Create one of the charts that support multilayer.
  2. Click the Add Layer tab.
  3. Create another multilayer-compatible chart in the new layer.
  4. Click the Master tab.
  5. Adjust the Opacity and the Zoom level of the chart layers using the sliders on the right.

You can change the order of the layers by dragging the contents of a layer field on top of another layer field.

A single chart can have up to eight layers, depending on your server memory and processing capacity.

Example: Opacity with Multilayer Charts

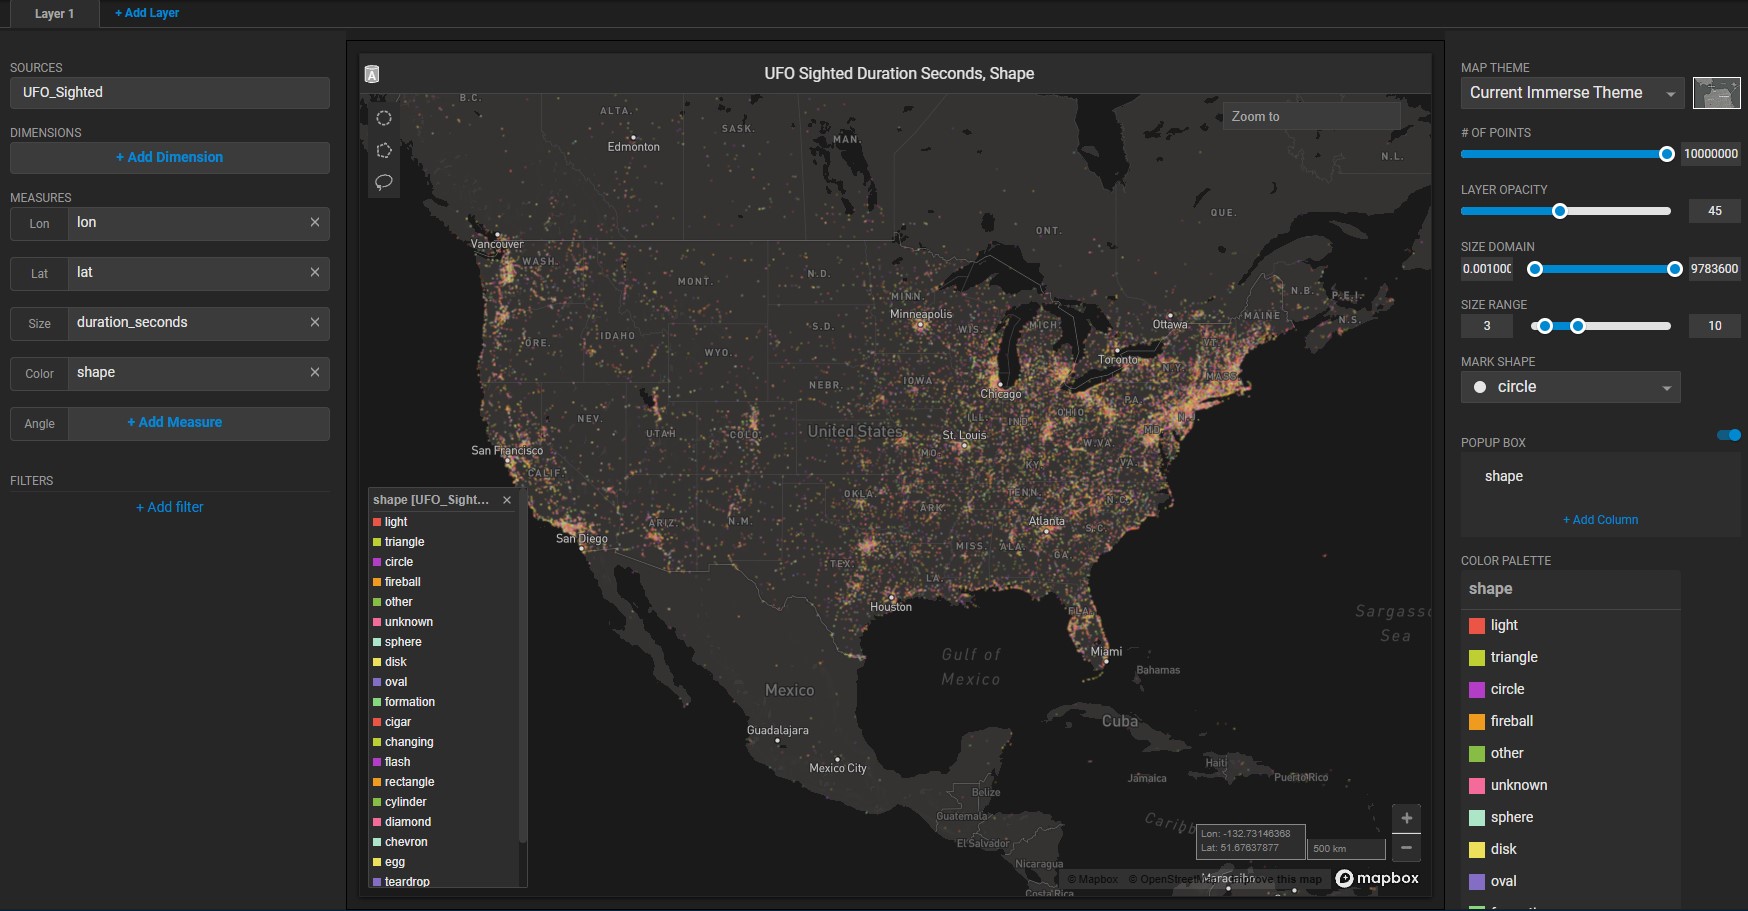
Create a new Pointmap. For the Data Source, use the official database of UFO sightings.

Set the Lon measure to longitude and Lat measure to latitude. Set the Size measure to duration_seconds. Set the Color measure to shape.

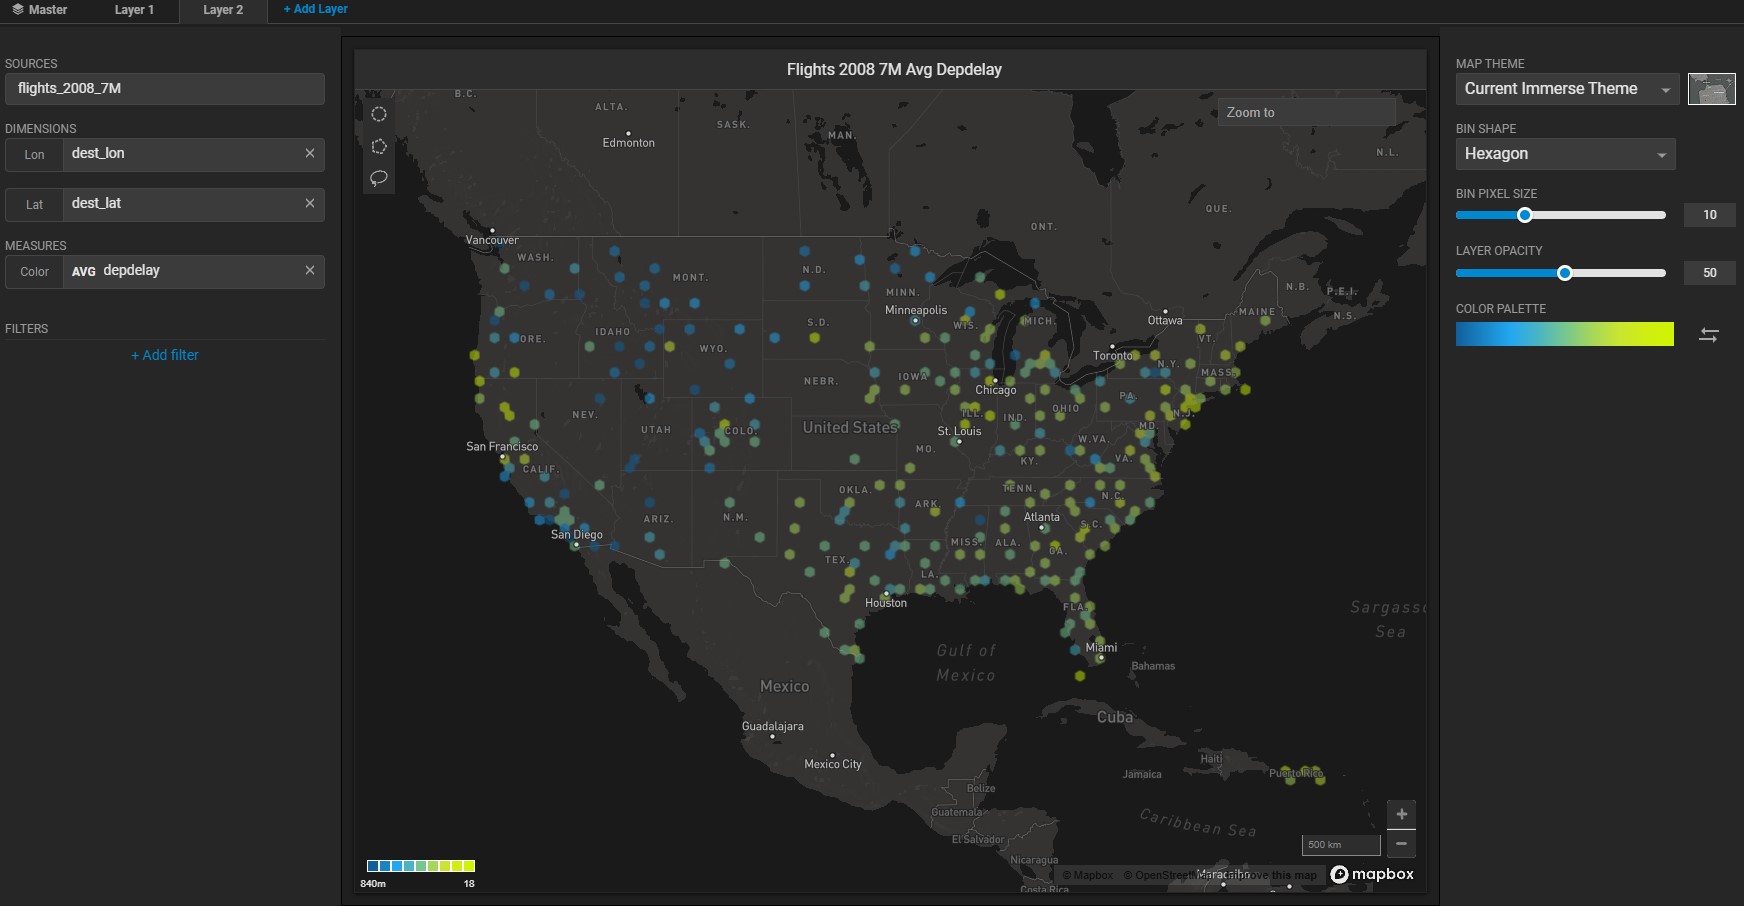
Click the Add Layer tab, and create a Geo Heatmap. Set the data source to the flights_2008_7M database. Set Lon to dest_lon and Lat to dest_lat. Set the Color measure to AVG depdelay.

The resulting chart compares a Geo Heatmap of flight departure delays to a Pointmap of UFO sightings.

Click the Master tab, and reduce the opacity of the UFOs Sighted chart to enhance the visibility of the flights_2008_7M delay information.

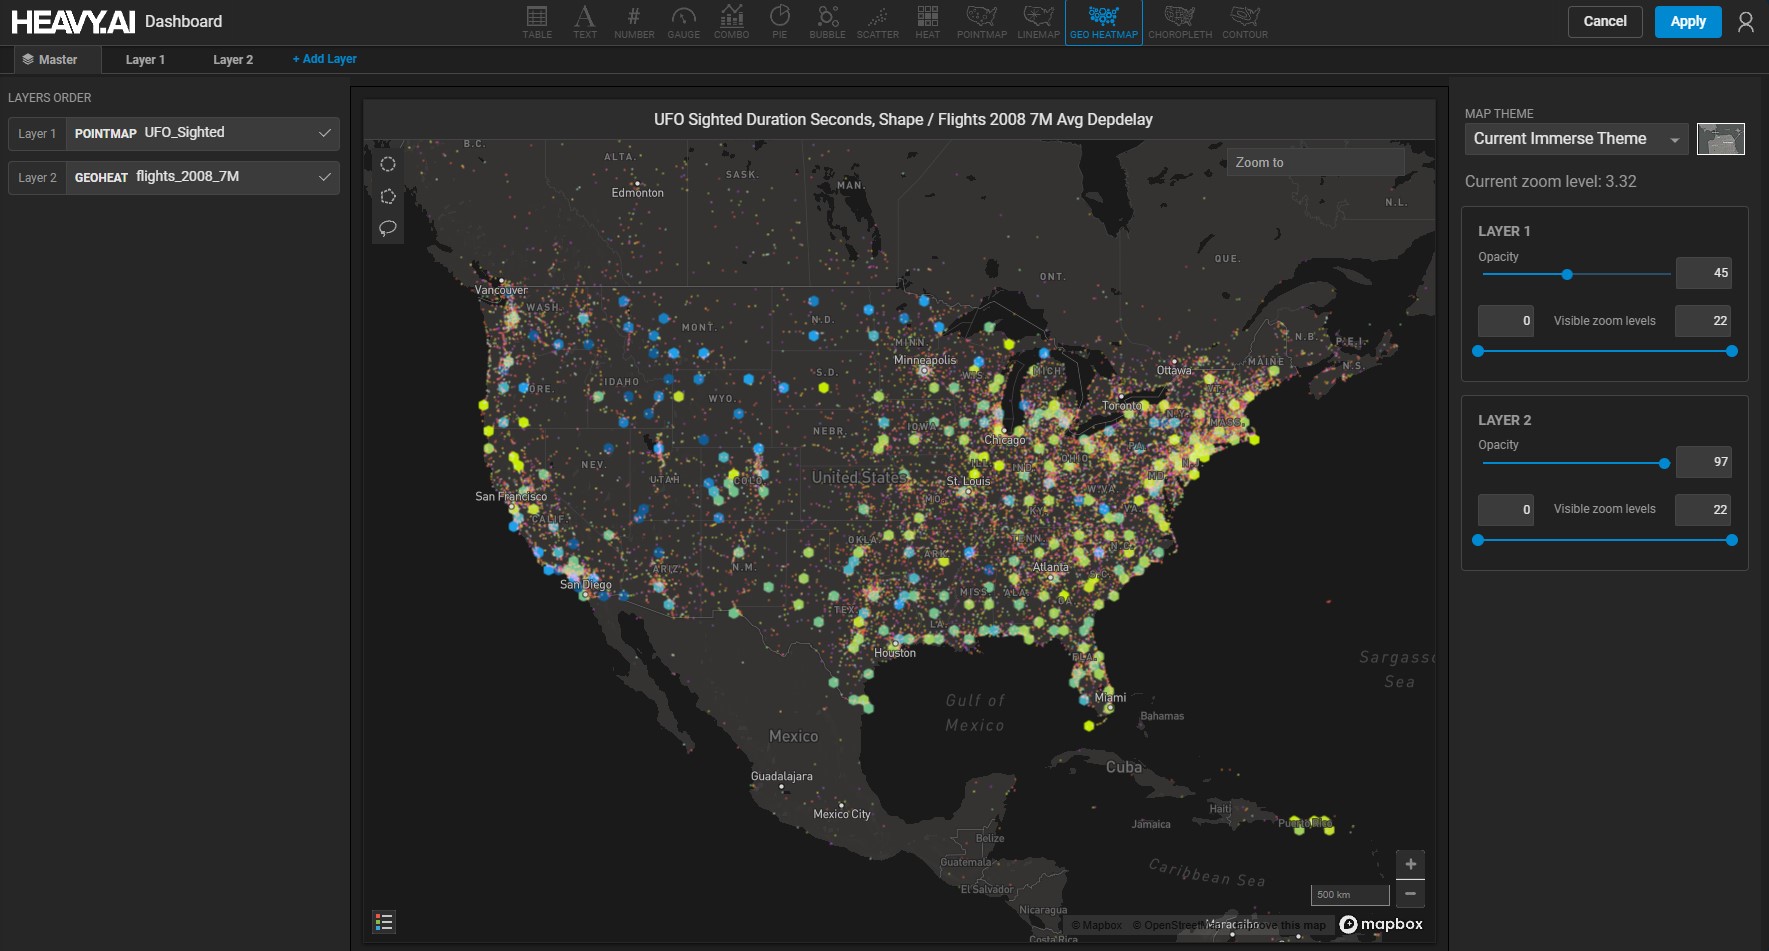
Clearly, some flights have been delayed where UFOs have been sighted, making it impossible to make a definitive statement that there is no correlation between the two datasets. Spooky.

Example: Zoom Level with Multilayer Charts

You can configure the visibility of a layer based on zoom level.

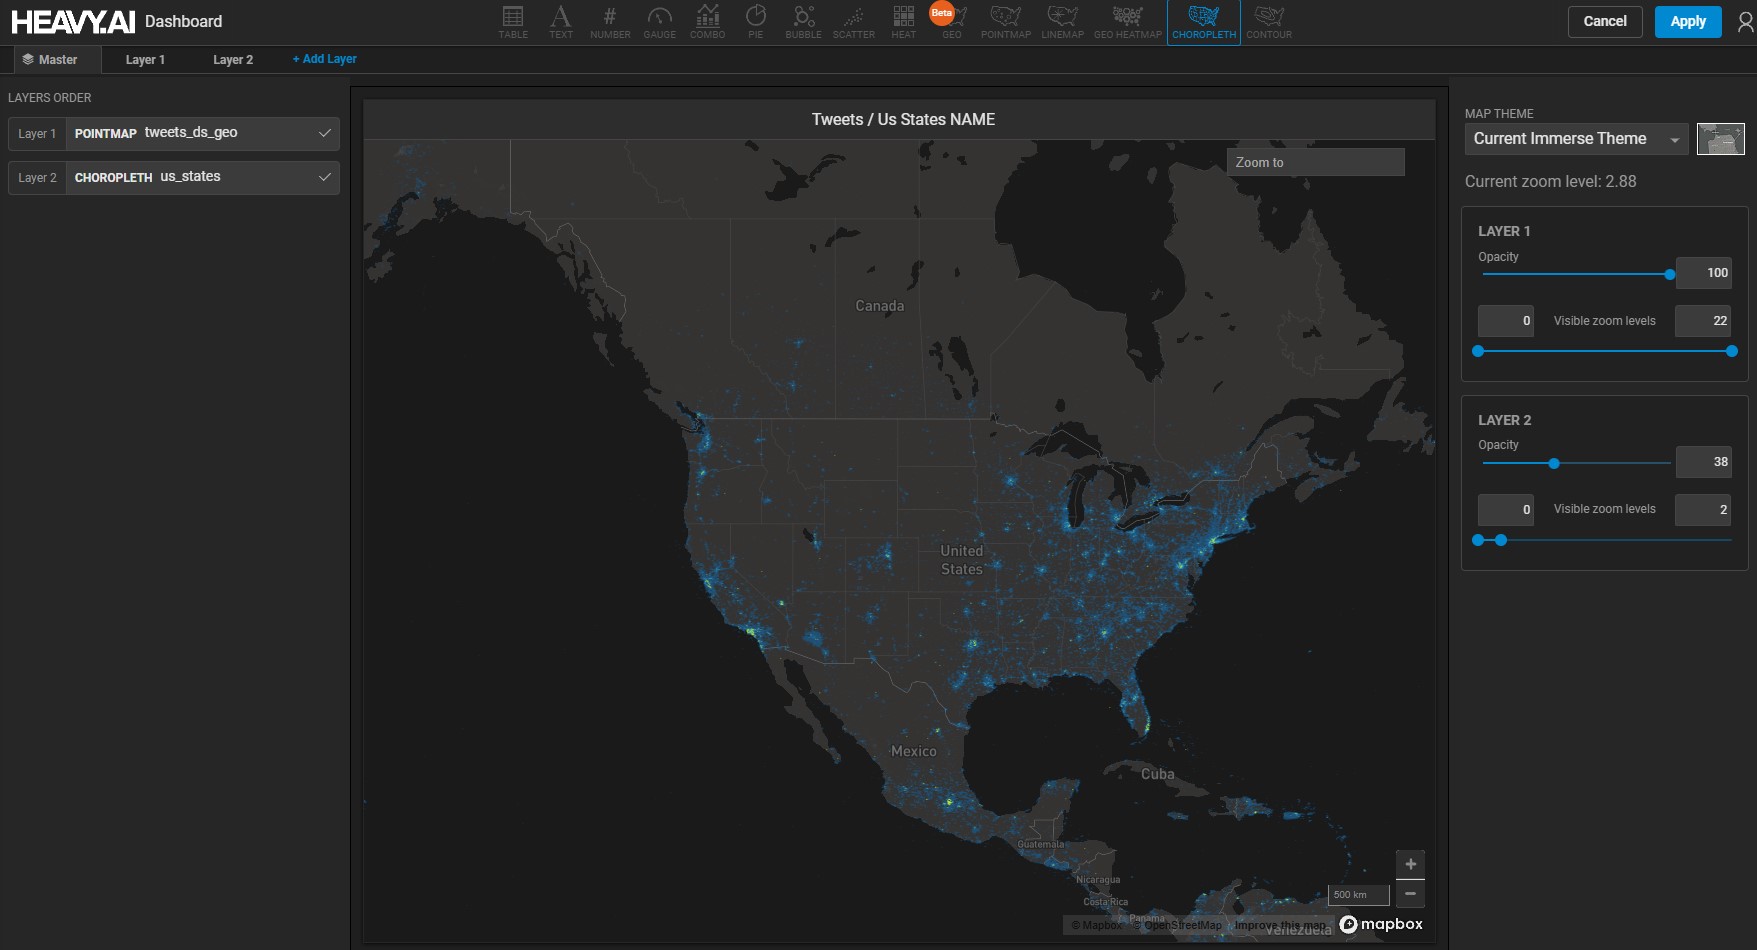
This chart has two layers: a Pointmap based on tweets and a Choropleth based on 14 states defined by name, with the rest defined as Other. Currently, the chart is zoomed to level 5.

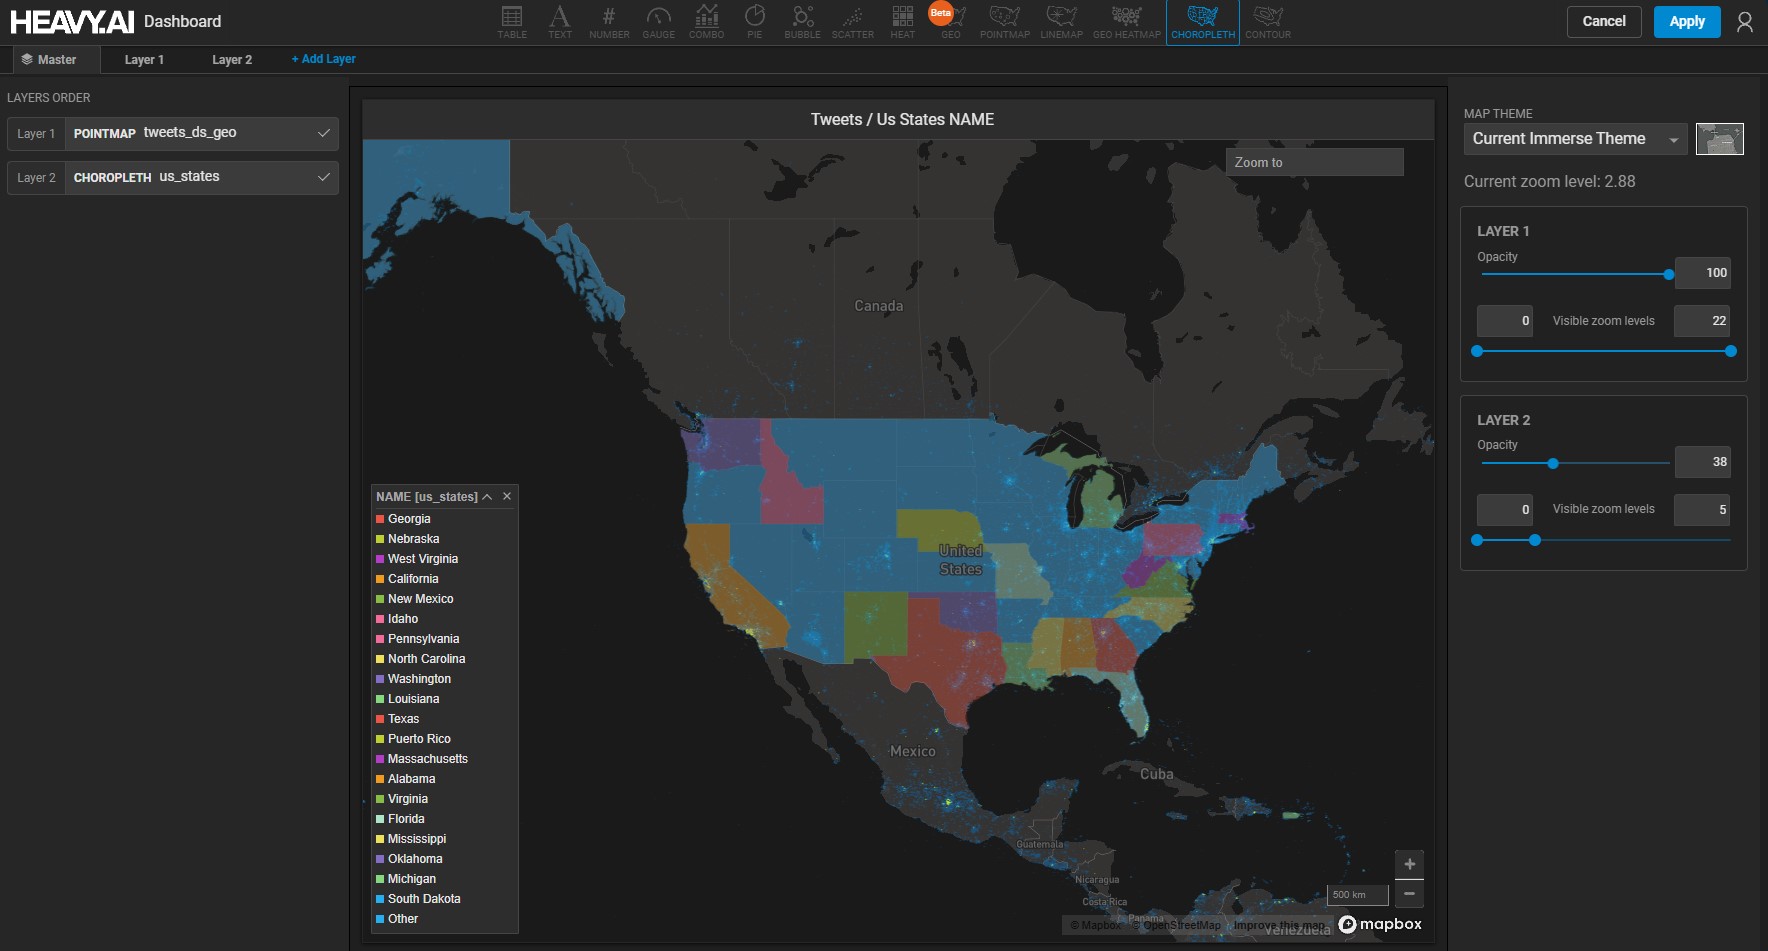
You determine that when you zoom to level 2, you no longer want to see the states layer, so you adjust the sliders to reflect this.