Hello World
This topic demonstrates how you can:
- Clone the mapd-connector repository.
- Connect to a HEAVY.AI server instance.
- Retrieve the results of a SQL query.
- Display the results on an HTML page.
Clone
Much of the underlying infrastructure you need to interact with a HEAVY.AI server is provided by the mapd-connector repository. You can clone the repository locally to take advantage of its utilities.
To clone the mapd-connector repository:
- Go to https://github.com/heavyai/mapd-connector.
- Click Clone or Download.
- Choose whether to clone the repository using HTTPS or SSH, or optionally download a Zip archive to expand on your local drive.
For more information on cloning GitHub repositories, see https://help.github.com/articles/cloning-a-repository/
Open mapd-connector/examples/browser.html in a web browser to connect to a sample HEAVY.AI server instance and display information from the sample database. You can open mapd-connector/examples/browser.js in a text editor and follow along as the following sections describe how the script connects, retrieves, and displays data from the HEAVY.AI server.
Connect
The lynchpin of the application is establishing a connection to HEAVY.AI. Fortunately, the MapdCon object does the heavy lifting for you. You provide the location and port of the HEAVY.AI host and your user credentials to create a connection.
Retrieve
Connecting to the HEAVY.AI server is not the final goal, of course. Once you have a connection, you can send SQL queries to retrieve data.
First, create constant variables for your SQL queries.
Create an empty array for your query options.
Connect as shown above.
Use a promise to send a series of queries, including the ones defined as constants.
Display
Promise returns a values object with an array of query results. The first item in the values array is a list of tables. Write the results to the browser console.
The second item in the array contains a list of fields in the table flights_donotmodify.
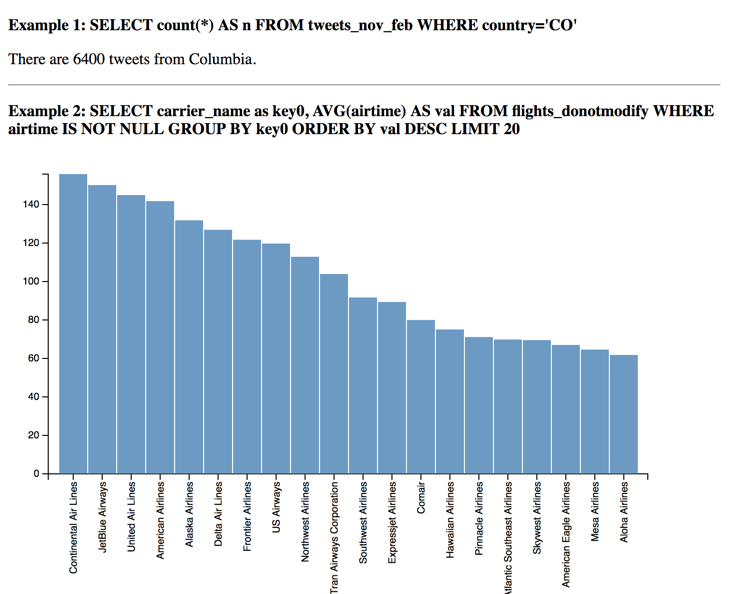
The third query contains a count of Twitter™ tweets from Columbia. Display that in the HTML page using the DOM.
The final query returns the average air time for flights listed in the flights_donotmodify table, with a limit of 100 records. Display the results as a chart using the createRowChart method.
Use the array to create a chart using the D3 API. This example is based on an example from the free ebook D3 Tips and Tricks